RCP Anomaly Detection — Automated ILI Alignment, Matching, and Growth Analytics
Inspiration
Pipelines are lifelines. Yet, inspection data collected years apart rarely lines up: odometer drift, differing references, and evolving corrosion make apples‑to‑apples comparisons hard. Engineers still match defects by eye—slow, costly, and inconsistent. We were inspired to automate the way experts think: align runs, match the same physical defects, quantify growth, and surface new or missing anomalies so teams can act faster and safer.
What it does
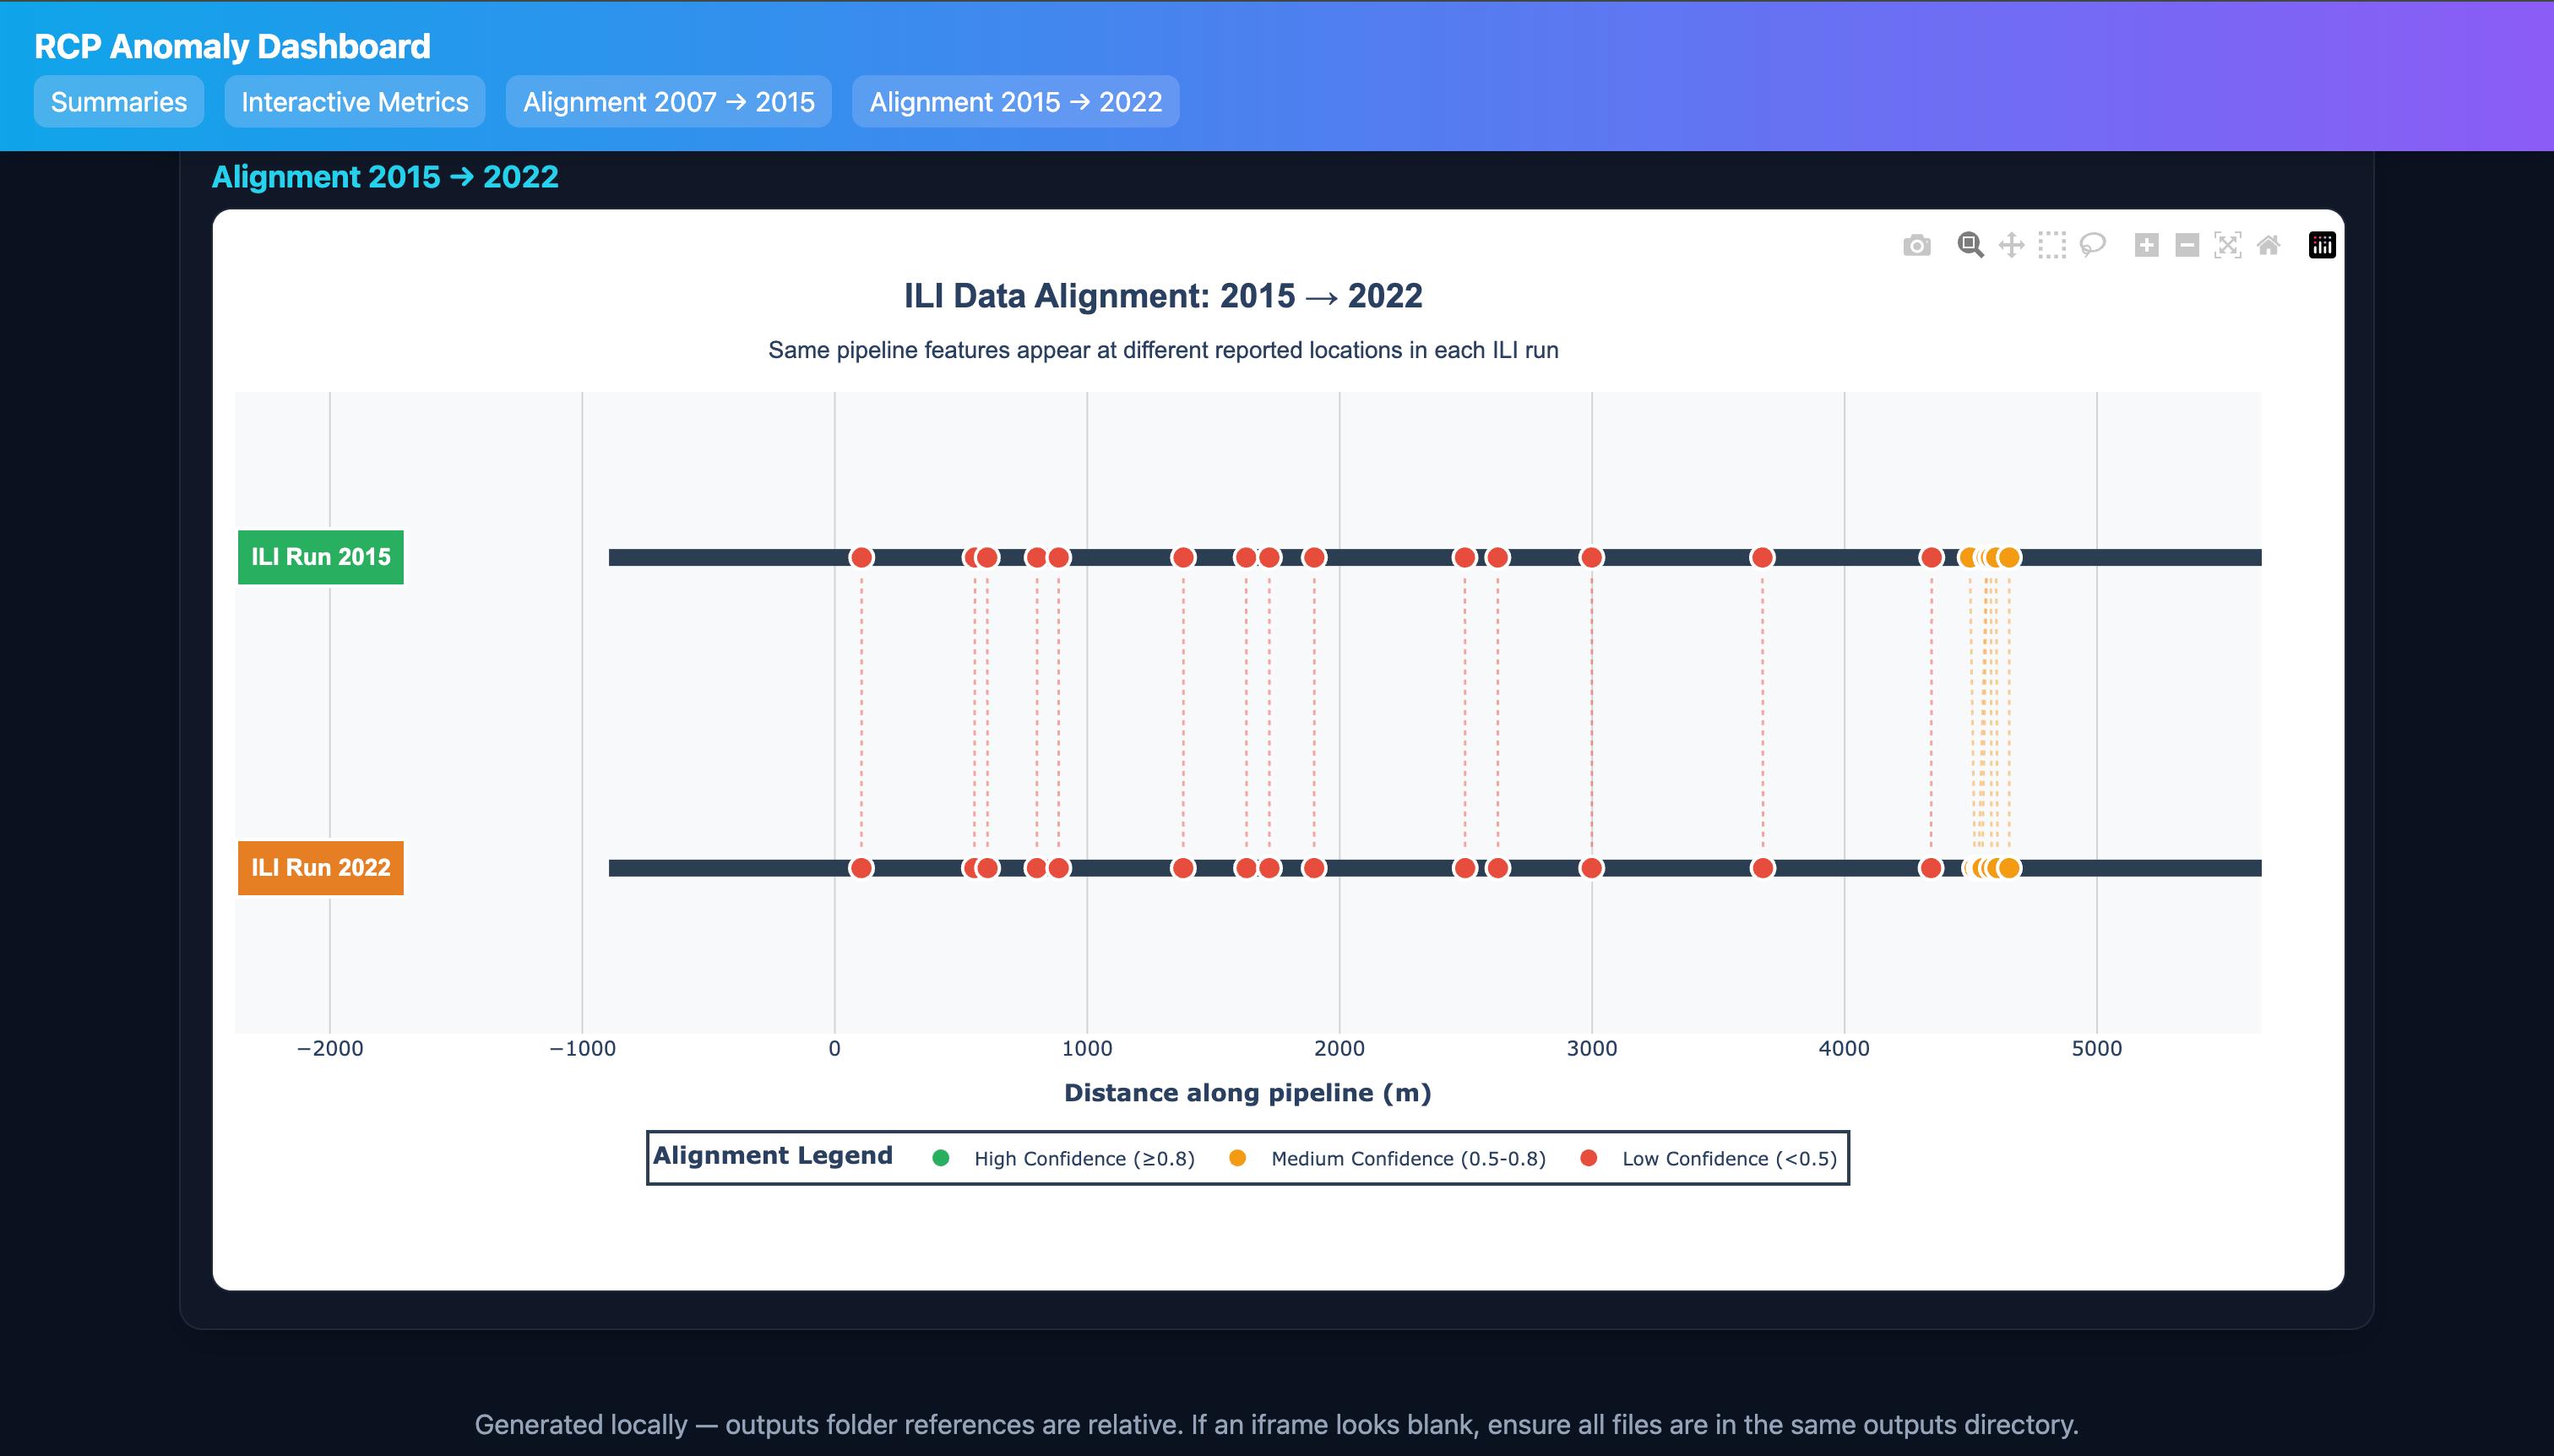
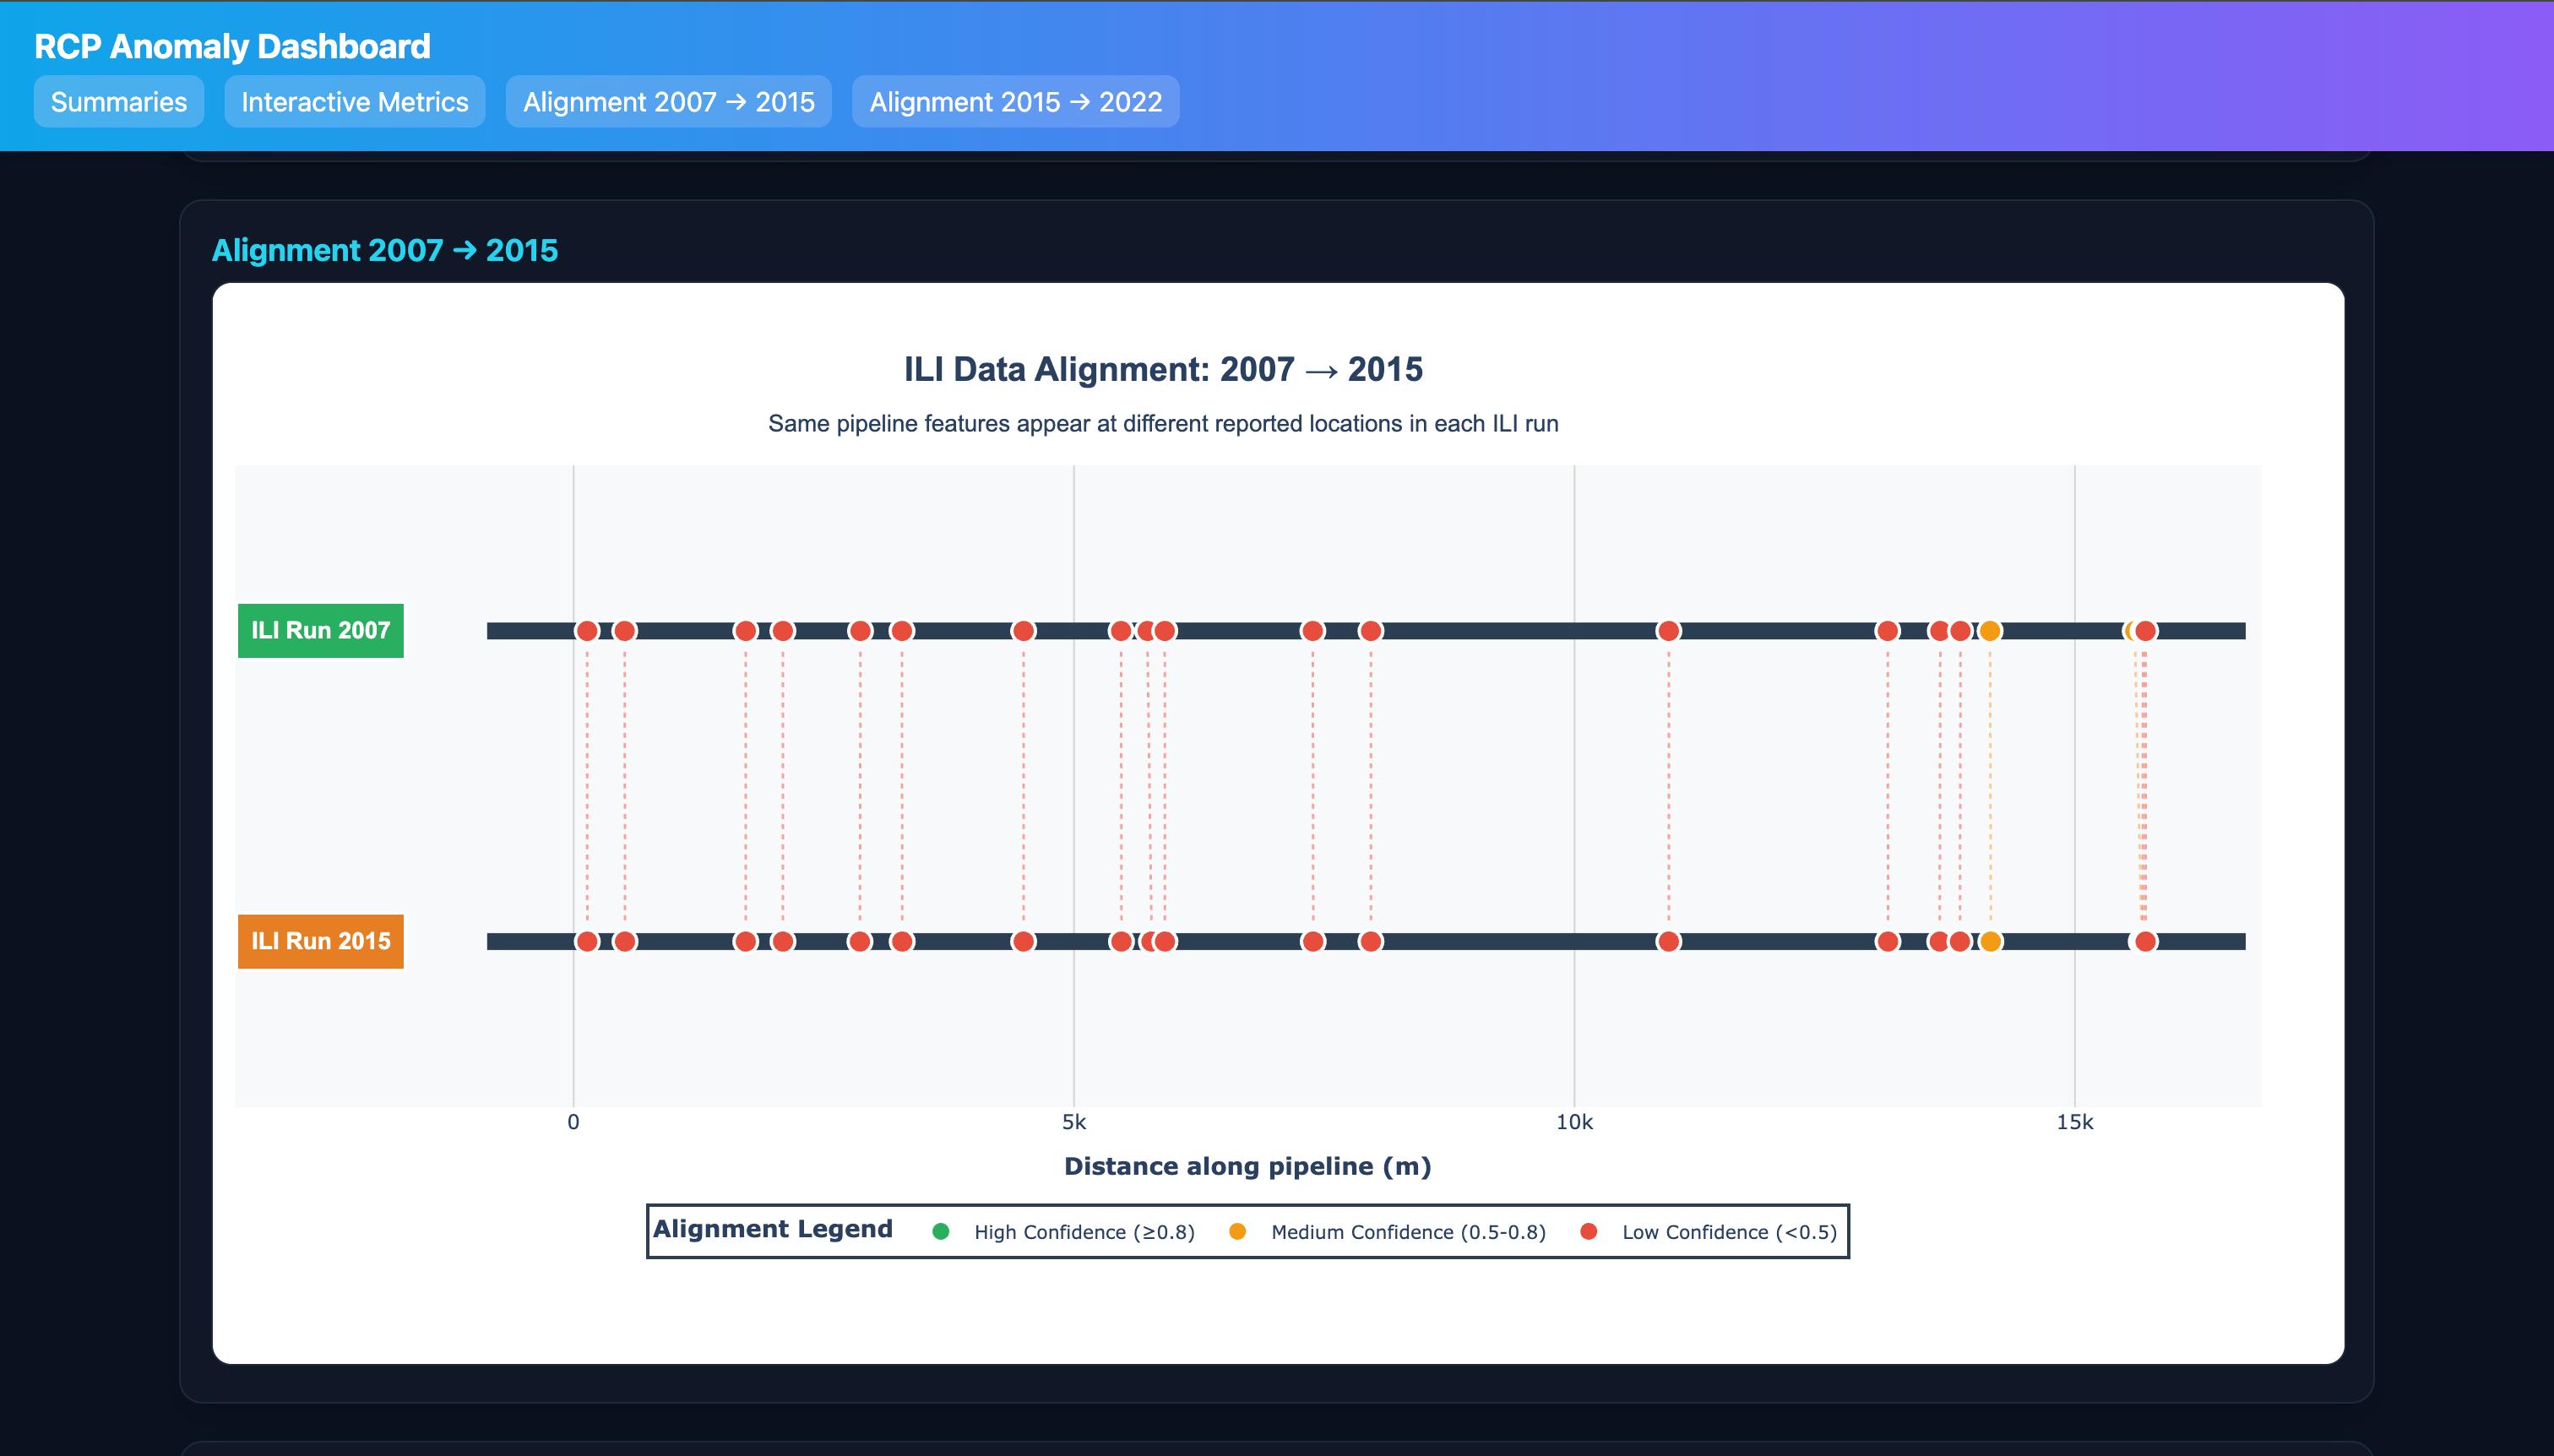
- Aligns two inspection runs (e.g., 2007→2015 and 2015→2022) to a common coordinate system, correcting distance drift.
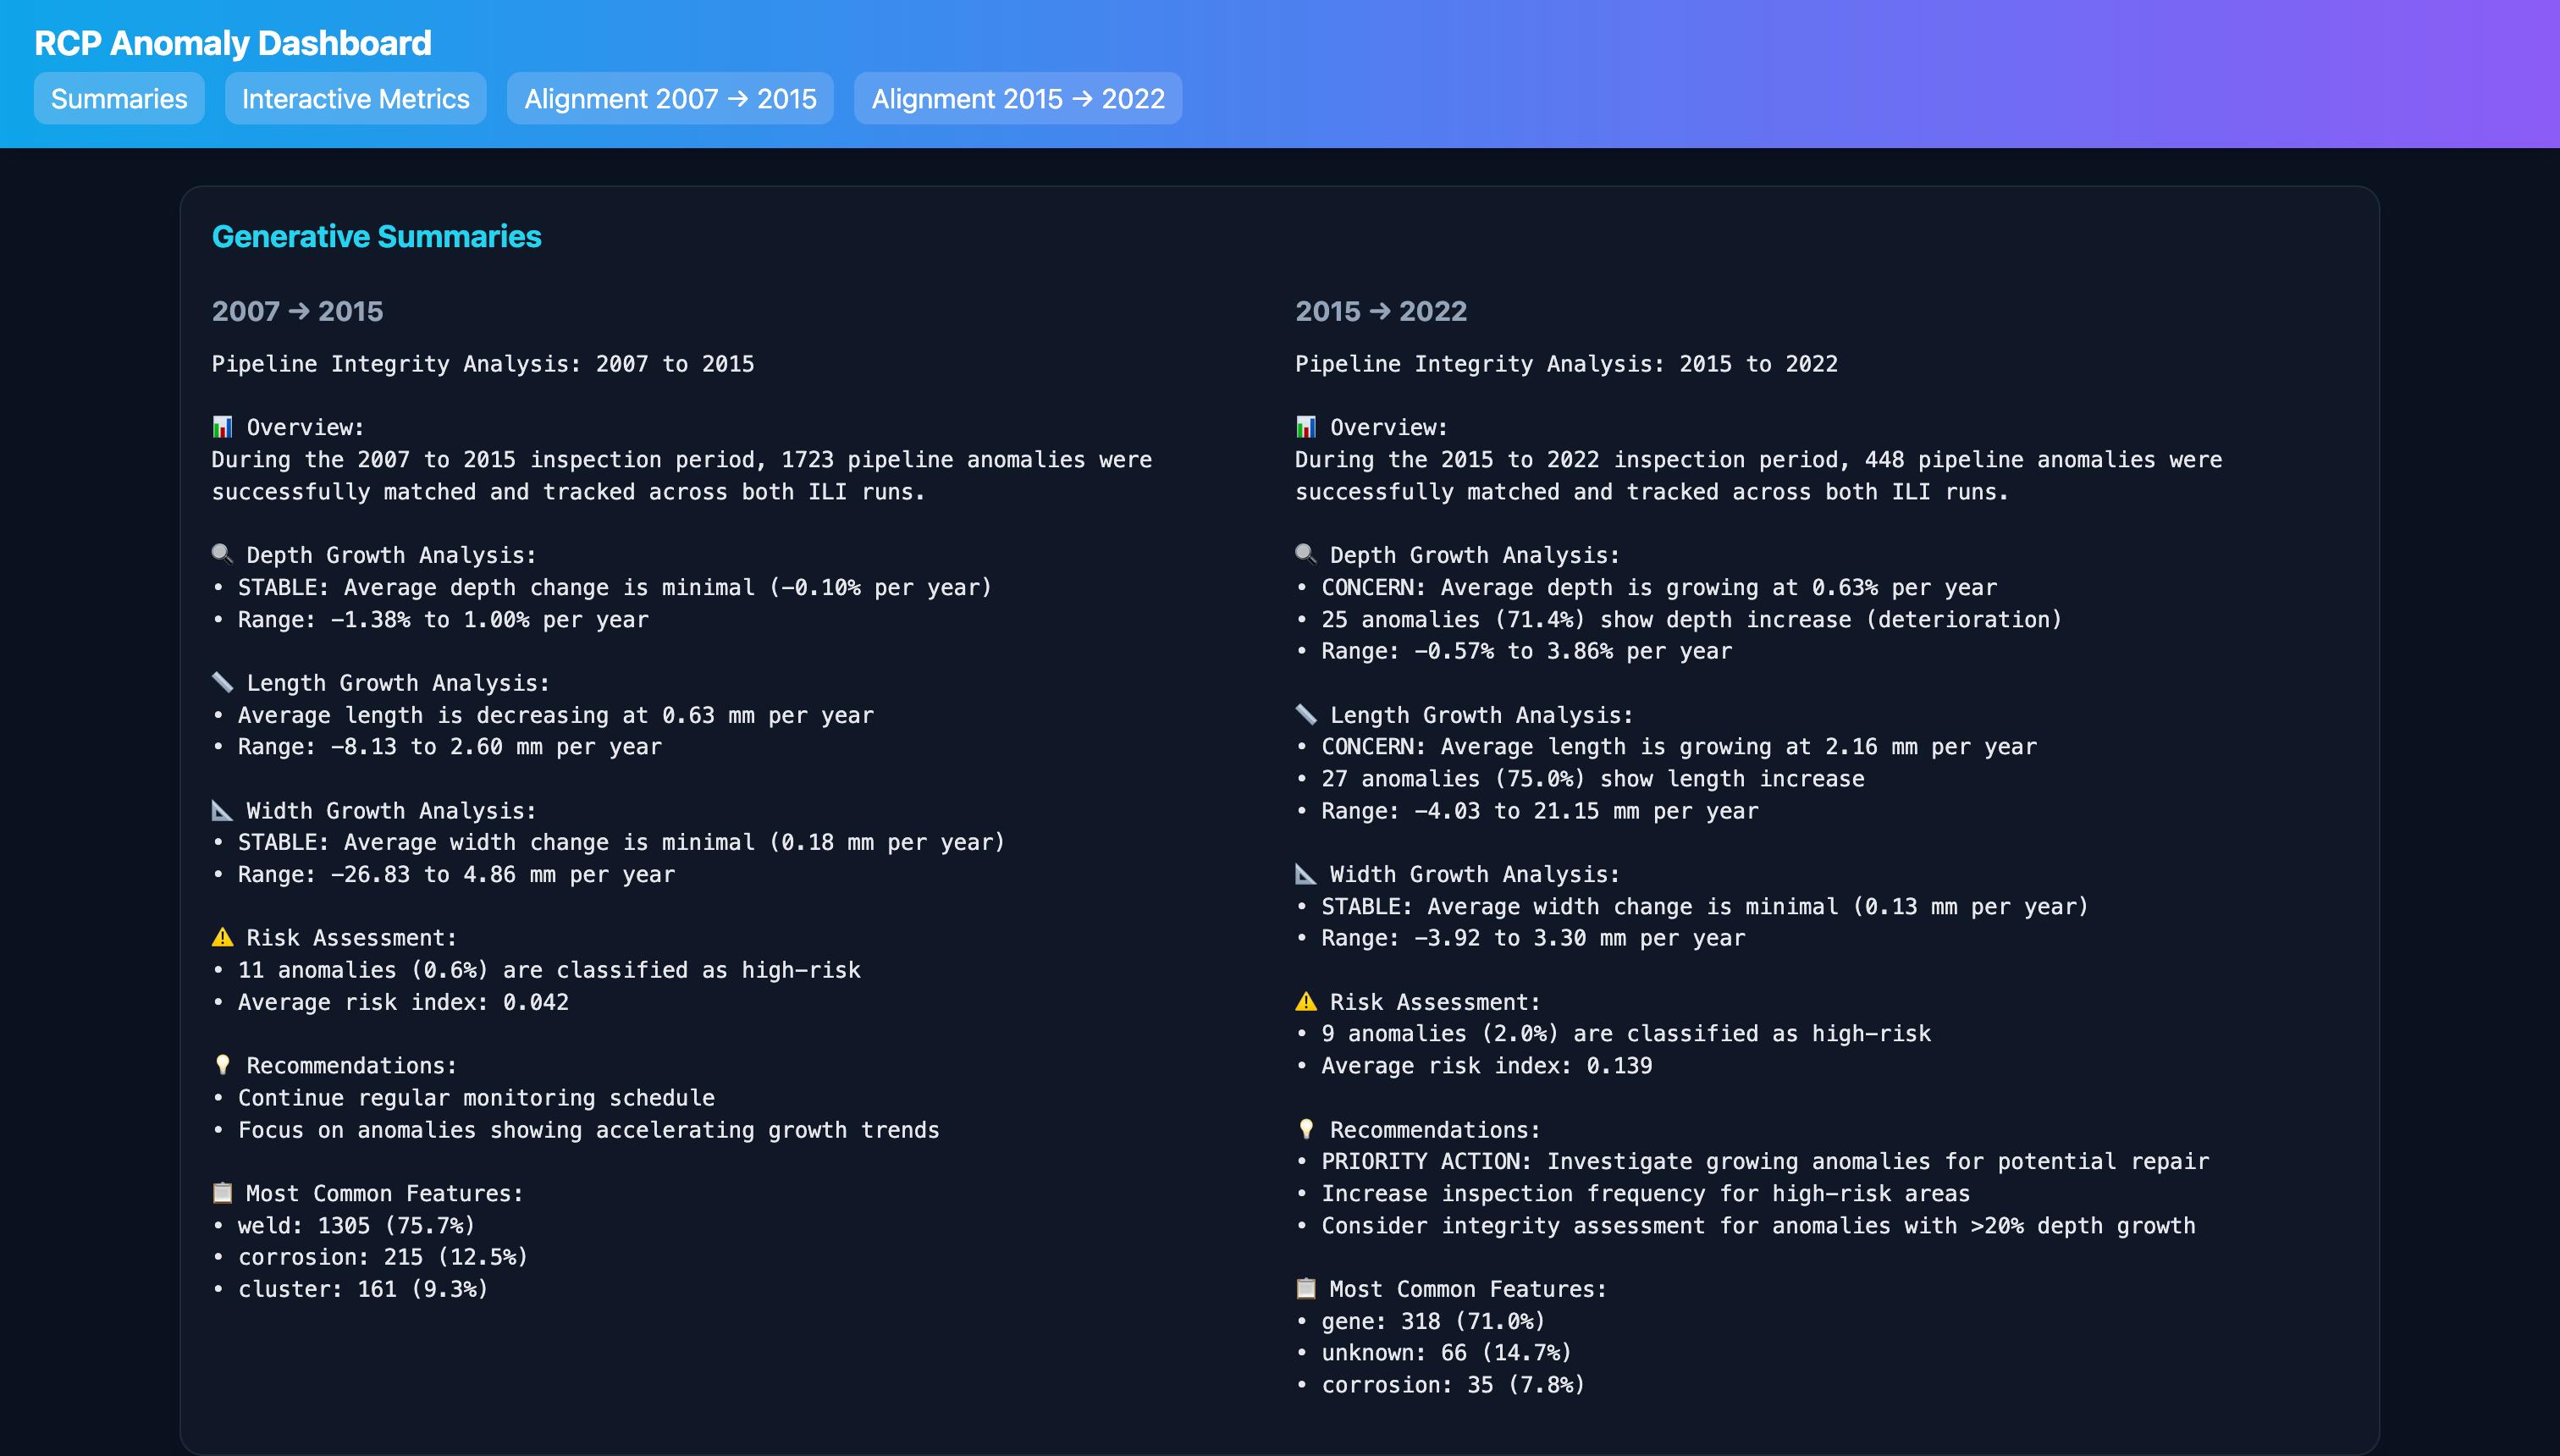
- Matches the same physical defects across runs with confidence bands (High/Med/Low).
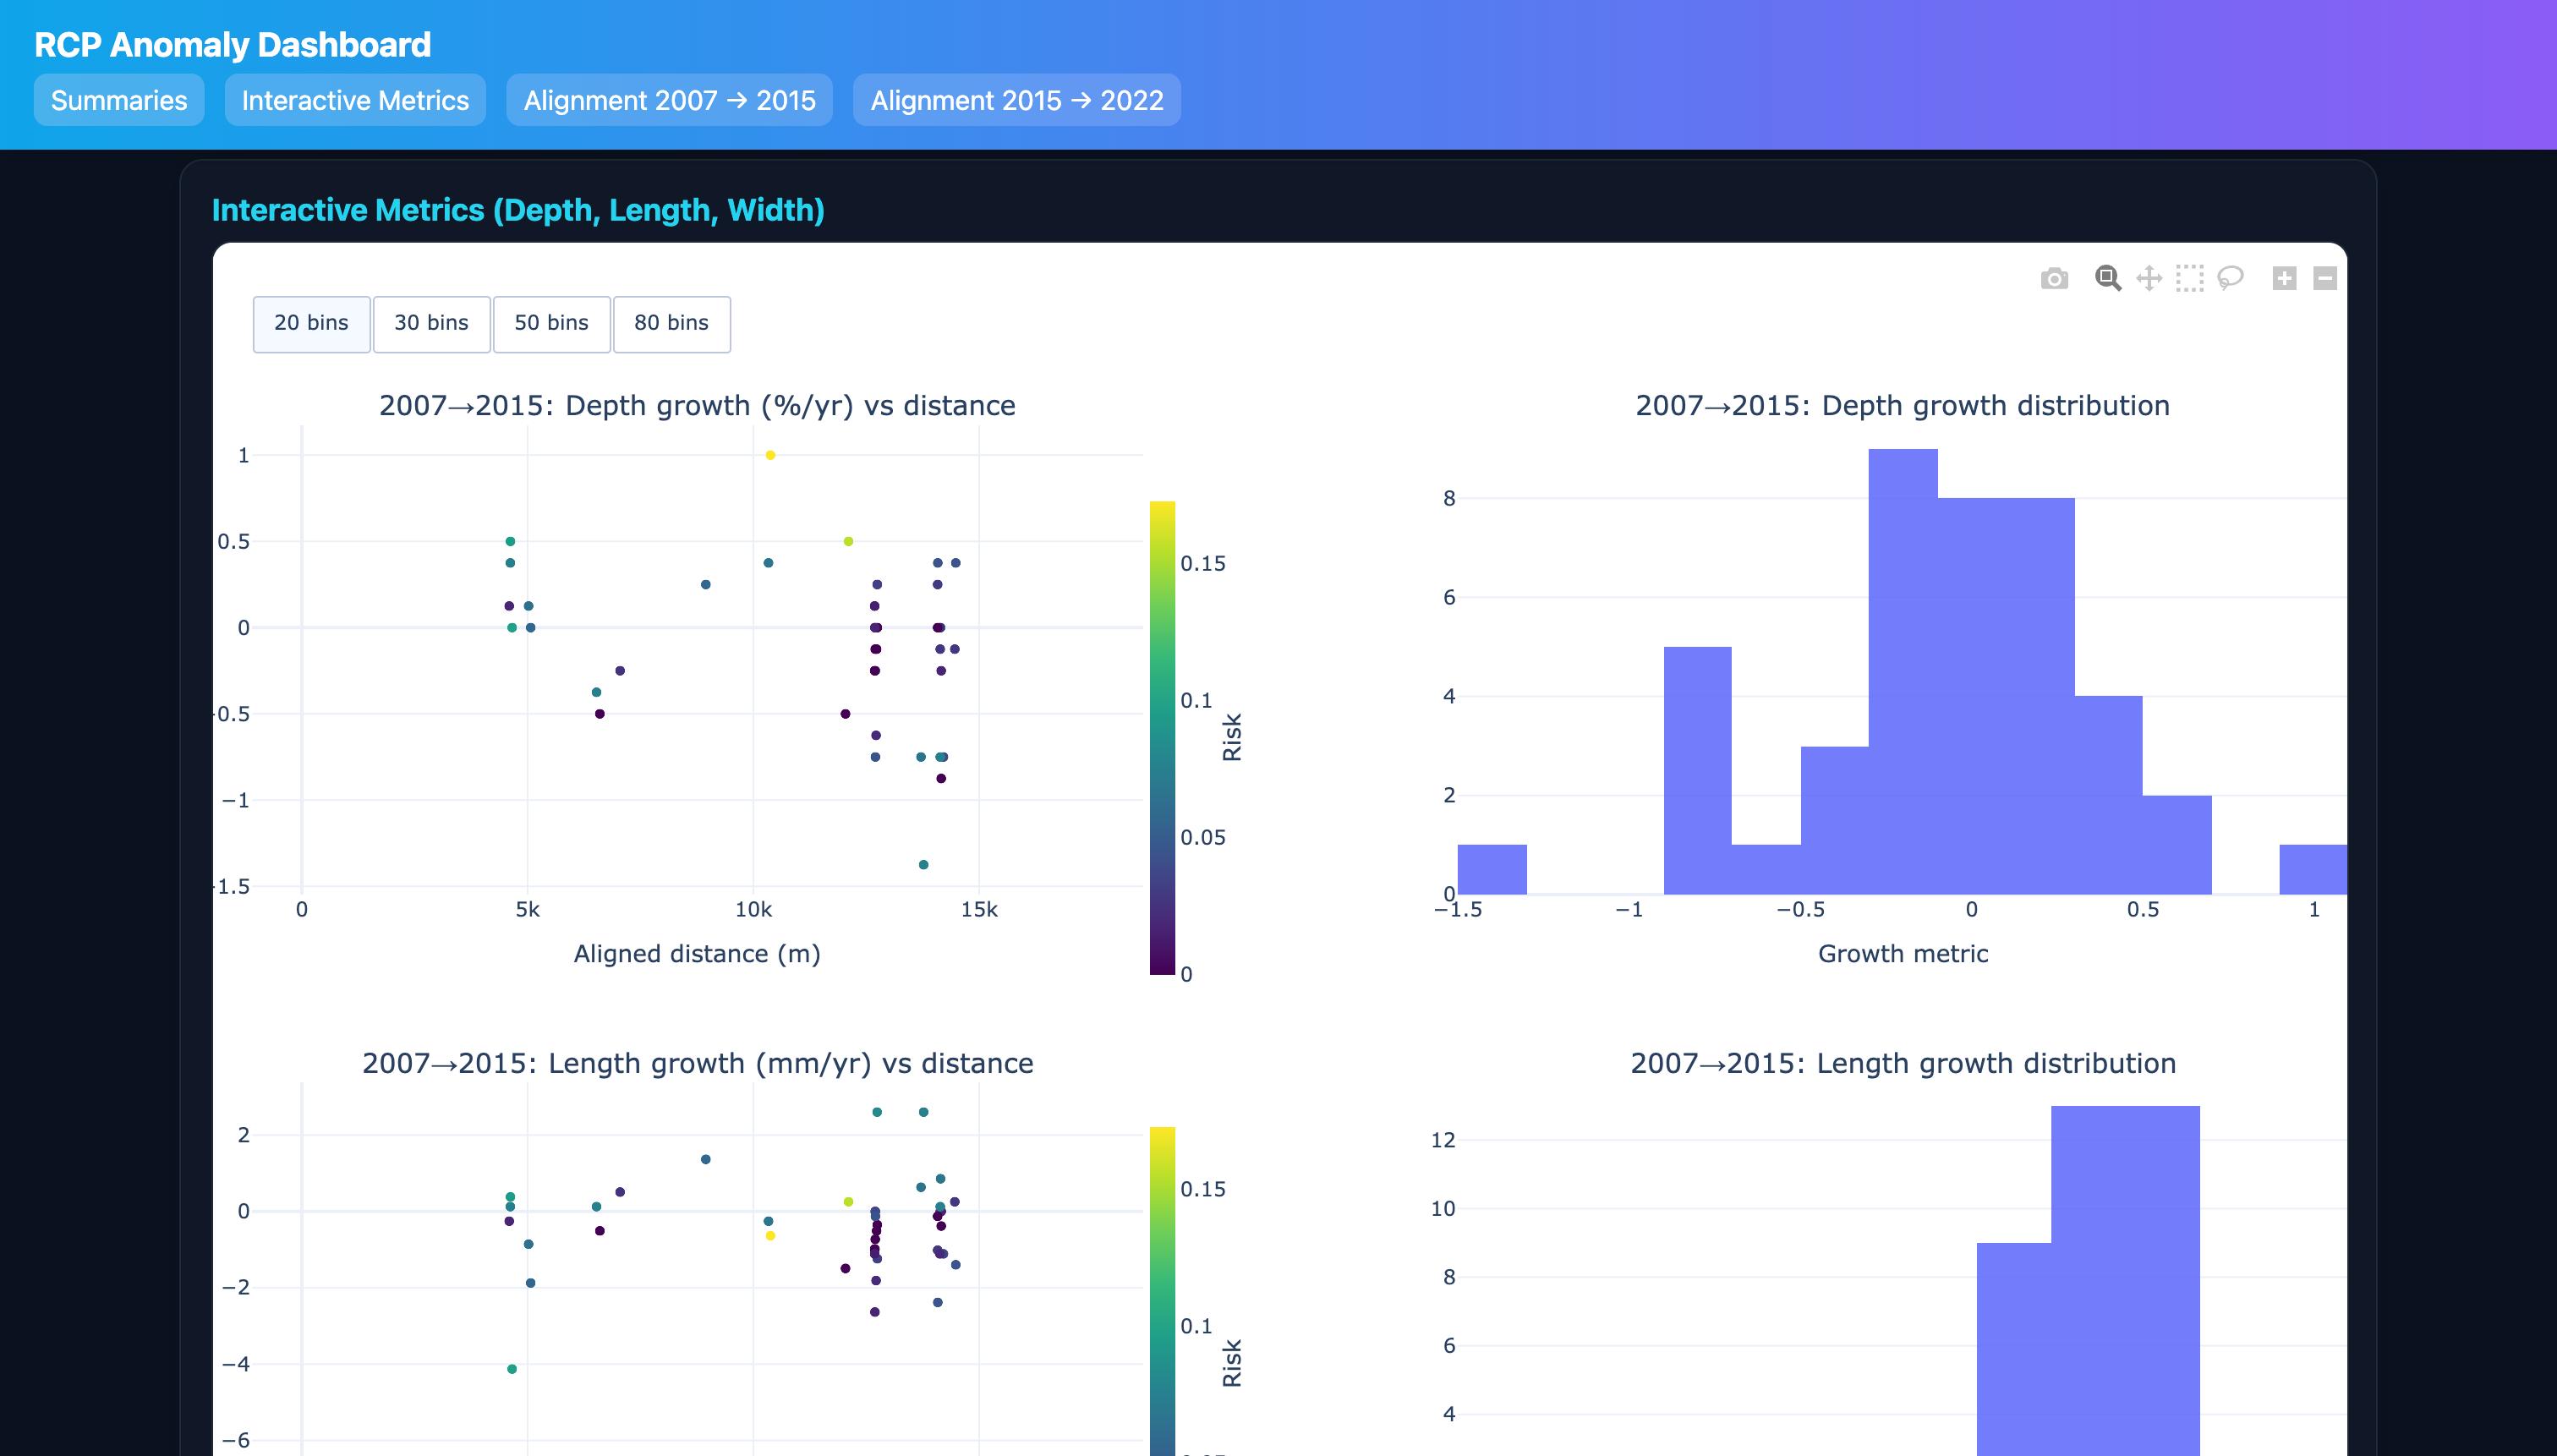
- Computes growth metrics (depth, length, width), normalized by time between inspections.
- Flags new defects, missing defects, and uncertain matches for review.
- Delivers an interactive, single‑page dashboard (no iframes) and an iframe version for stakeholder sharing.
How we built it
The end‑to‑end workflow is orchestrated in ili_eda.ipynb and produces web dashboards and a presentation.
Data preparation and alignment
- Standardize units and feature types; normalize clock positions and handle missing fields.
- Use anchors (girth welds, valves, fittings) to correct drift and map distances to a common axis.
- Linear drift correction (conceptual): $$x_2^{*} = a\,x_2 + b$$ Parameters $(a,b)$ are estimated to minimize anchor residuals. For segments needing more flexibility, piecewise or non‑linear transforms can be applied.
Anomaly matching and confidence
- For each defect in Run 2, search candidate defects in Run 1 within a distance window; compare corrected distance, clock, type compatibility, and size.
- Example similarity score (conceptual): $$S = w_d \exp!\left(-\tfrac{|x_1 - x_2^{*}|}{\tau_d}\right) \;+ w_c \cos(\Delta\theta) \;+ w_s \exp!\left(-\tfrac{\lVert s_1 - s_2 \rVert}{\tau_s}\right)$$
- Assign best matches; flag uncertain/new/missing. Confidence bands are thresholded (e.g., High: $c\ge0.8$, Med: $c\ge0.5$, Low otherwise).
Growth analytics
- For matched defects, compute growth normalized by elapsed time $\Delta t$: $$g_{\text{depth}} = \frac{d_2 - d_1}{\Delta t},\quad g_{\text{length}} = \frac{\ell_2 - \ell_1}{\Delta t},\quad g_{\text{width}} = \frac{w_2 - w_1}{\Delta t}$$
- Highlight fastest‑growing anomalies for prioritization.
Interactive dashboards and outputs
- Interactive metrics (depth, length, width) with web‑side histogram bin toggles (20/30/50/80).
- Separate color scales per scatter; neat, aligned layout.
- Alignment UI shows full matched pairs (no sampling), confidence filters, and show/hide unmatched.
- Outputs:
- Inline single‑page dashboard:
outputs/dashboard_all_in_one.html - Iframe consolidated dashboard:
outputs/dashboard_all_in_one.html - Alignment pages:
outputs/ili_alignment_2007_to_2015.html,outputs/ili_alignment_2015_to_2022.html - Winter‑themed deck:
outputs/presentation_company_overview_winter_v2.pptx
- Inline single‑page dashboard:
Challenges we ran into
- Cross‑run drift and inconsistent reference reporting required robust alignment and careful anchor selection.
- Varying column names and missing fields caused runtime issues; we added resilient column selection and defaults (e.g., confidence fallback).
- Inline embedding initially failed due to notebook scope and a confidence mapping bug—fixed with local helper definition, safe Series mapping, and robust distance column heuristics.
- Iframe path visibility concerns were avoided by shipping a self‑contained single‑page dashboard.
Accomplishments that we're proud of
- Full matched‑pair alignment visualizations with confidence filters and unmatched toggles.
- A polished, single‑page interactive dashboard that stakeholders can use without setup.
- Clear, AI‑style summaries embedded into the experience to accelerate understanding.
- A winter‑themed executive deck suitable for company demos.
What we learned
- Alignment across inspections is as much data hygiene as math—unit/format normalization matters.
- Modular separation (alignment → matching → growth → UI) keeps the system understandable and testable.
- Small UI details (bin toggles, per‑plot color bars, tidy layout) dramatically improve analyst speed.
- Build for resilience: default confidence bands, flexible column selection, and a self‑contained inline page prevent demo‑time surprises.
What's next for RCP Anomaly Detection
- Validation dataset (as mentioned) will let us strengthen the pipeline and benchmark accuracy.
- Today’s approach is largely rule‑based due to limited data; with past trends and labels, we’ll evolve to an ML matching pipeline (learned similarity + confidence estimation).
- Add unmatched counts in subtitles; consider tabbed layouts and richer filtering.
- Publish internally with SSO and automate refresh with each new ILI run.
- Scale to multiple segments and add health scoring for risk‑based prioritization.
Built with
- Languages & Libraries: Python 3.13, Pandas, Plotly (graph_objects/express), python‑pptx
- Environment & Tools: Jupyter Notebook (
ili_eda.ipynb), VS Code, virtualenv on macOS - UI/Controls: Web‑side Plotly buttons (bin toggles), confidence/unmatched filters
- Optional AI: OpenAI summaries (with local fallback)
- Data: CSVs per run (final results, matches/new/missing/aligned)
Try it locally (optional)
# Open the single-file dashboard
open /Users/satvikaakati/Desktop/Hack/outputs/dashboard_all_in_one_inline.html

# Open the winter-themed presentation
open /Users/satvikaakati/Desktop/Hack/outputs/presentation_company_overview_winter_v2.pptx
Built With
- confidence/unmatched-filters-??-?optional-ai:-openai-summaries-(with-local-fallback)-??-?data:-csvs-per-run-(final-results
- pandas
- plotly-(graph-objects/express)
- python
- python?pptx-??-?environment-&-tools:-jupyter-notebook-(??ili-eda.ipynb??)
- virtualenv-on-macos-??-?ui/controls:-web?side-plotly-buttons-(bin-toggles)
- vs-code

Log in or sign up for Devpost to join the conversation.