-
-
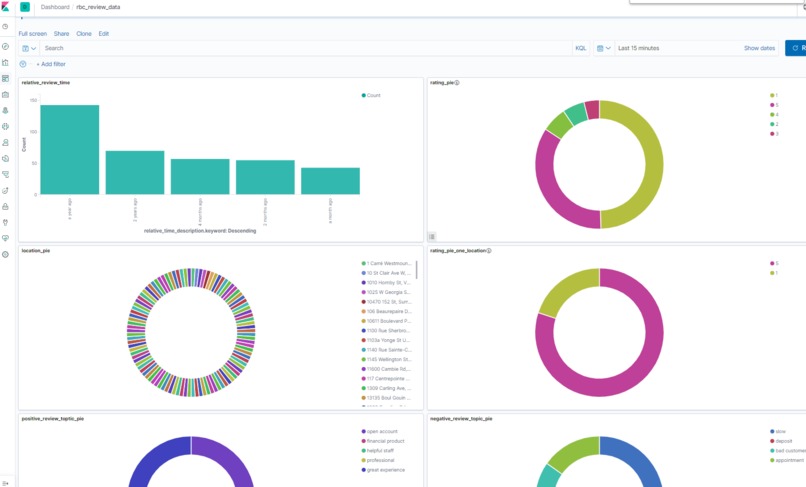
dash board look like this

Inspiration
- price
- learning is fun ## What it does The project is a dashboard build using kibana, the data visualization on the dashboard is to will help RBC employee to better understand the customer reviews and then to improve themself. ## How I built it
- data collection using google place API. My limitation on data collection is that because I do not have a business google account, I can only get 5 reviews from one RBC branch location. To collect more data, data from various location is collected
- put collected raw data into elasticsearch, this is to save the data for future use, so we don't need to recollected every time using it.
- process the raw data by removing non-text data. removing stop word, removing words that shows too frequently or too rare.
- build a LDA machine learning model using python gensim to group the data into different topic. This is to analysis the reason that customer give a good review or bad review in the later steps
- put the processed data into different index in elasticsearch for visualization purpose
- create a data visualization dashboard of the processed data
Challenges I ran into
The main challenge I run into is data collection. In the beginning I wanted to used twitter API, but I have to apply to have a developer account of twitter in order to use that. Then I switched to google API, I realized that I can only have 5 reviews from one location because I don't have a business account. The data would be more useful If I can get all reviews from branch.
Accomplishments that I'm proud of
The dashboard works and shows useful/interesting data! I checked some of the topic grouped data and it make scene.
What I learned
I have leaned the concept of NLP before but never used it. This give me the opportunity to try LDA model and using NLP to classify data.
What's next for rbc_google_reviews_data_analysis
testing and collect more data
Built With
- api
- bigdata
- elasticsearch
- kibana
- machine-learning
- natural-language-processing
- python

Log in or sign up for Devpost to join the conversation.