Authors: Syrine Ben Driss Juan Carlier Felipe Aguilar Fiorella Diaz Jimenez IDEs: PyCharm/VS Code Programming Languages: Python (version 3.10)/ React.js Hardware: MacBook Pro core i5/ HP core i5 Dependencies: Pyautogui / Matplotlib / Numpy
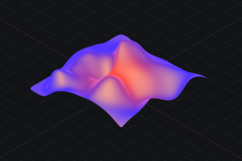
This application is designed to help patients diagnosed with Parkinson's with their computer navigation. Parkinson's disease is a neurodegenerative disorder that affects the dopamine-producing neurons in the brain. This leads to symptoms such as tremors, rigidity, slow movement, and difficulty with balance and coordination. The software aims to collect the mouse movement as its primary data by graphing them using Pyautogui's method "position()" to keep track of the activity of the cursor. Later, it graphed with the help of Matplotlib and Numpy, and then the Gaussian filter ran its inspection to reduce the data noise from the graph using the following steps: Obtain the mouse movement data (position or velocity) by tracking the mouse pointer. Apply Gaussian smoothing to the mouse movement data by convolving the data with a Gaussian kernel. This can be achieved by using a 1-dimensional or 2-dimensional Gaussian filter. The Gaussian filter acts as a low-pass filter, suppressing high-frequency noise and retaining low-frequency information. The size of the Gaussian kernel determines the extent of smoothing—a more considerable kernel size results in more robust smoothing and vice-versa. Repeat the process until the desired level of smoothing is achieved. The smoothed mouse movement data can be used to determine the position or velocity of the mouse more accurately. They can be used to eliminate or reduce the effects of shaking movements.
All of these data will be stored in the database, and we will be retrieved them using a machine learning algorithm to detect the patient's motions and figure out what app to open without waiting for the mouse control. Using the Graph Convolutional Network (GCN) architecture uses graph convolution operation for graph data analysis. The basic GCN architecture consists of the following steps: Input layer: The node features and graph structure are inputted into the GCN. Graph Convolutional layer: In this layer, a graph convolution operation is applied to the node features. This operation involves aggregating information from the node's neighbors and transforming the node's attributes. Non-linear activation function: The result of the graph convolution operation is transformed by a non-linear activation function, such as ReLU. Dropout layer: To prevent overfitting, a dropout layer can be added to the architecture. Output layer: The final output of the GCN is obtained by passing the transformed node features through a fully connected layer. Loss function and optimization: A loss function, such as cross-entropy loss, is used to evaluate the performance of the GCN. Optimization techniques, such as stochastic gradient descent, minimize the loss function and improve the GCN's performance.
And finally, the patient will be able to edit the AI's results to maintain the integrity of the software.
Note
The code in "https://github.com/felipeaguilarch/RapidSalud" is the base code we created and the one used for the Paint Demo during the presentation. All of the descriptions above are what can be accomplished if we get the investment and more time.

Log in or sign up for Devpost to join the conversation.