Inspiration
We wanted to make health data visible and actionable. Many people struggle to track symptoms over time or communicate them accurately to doctors. We asked ourselves: “What if you could literally see your health on your body?”
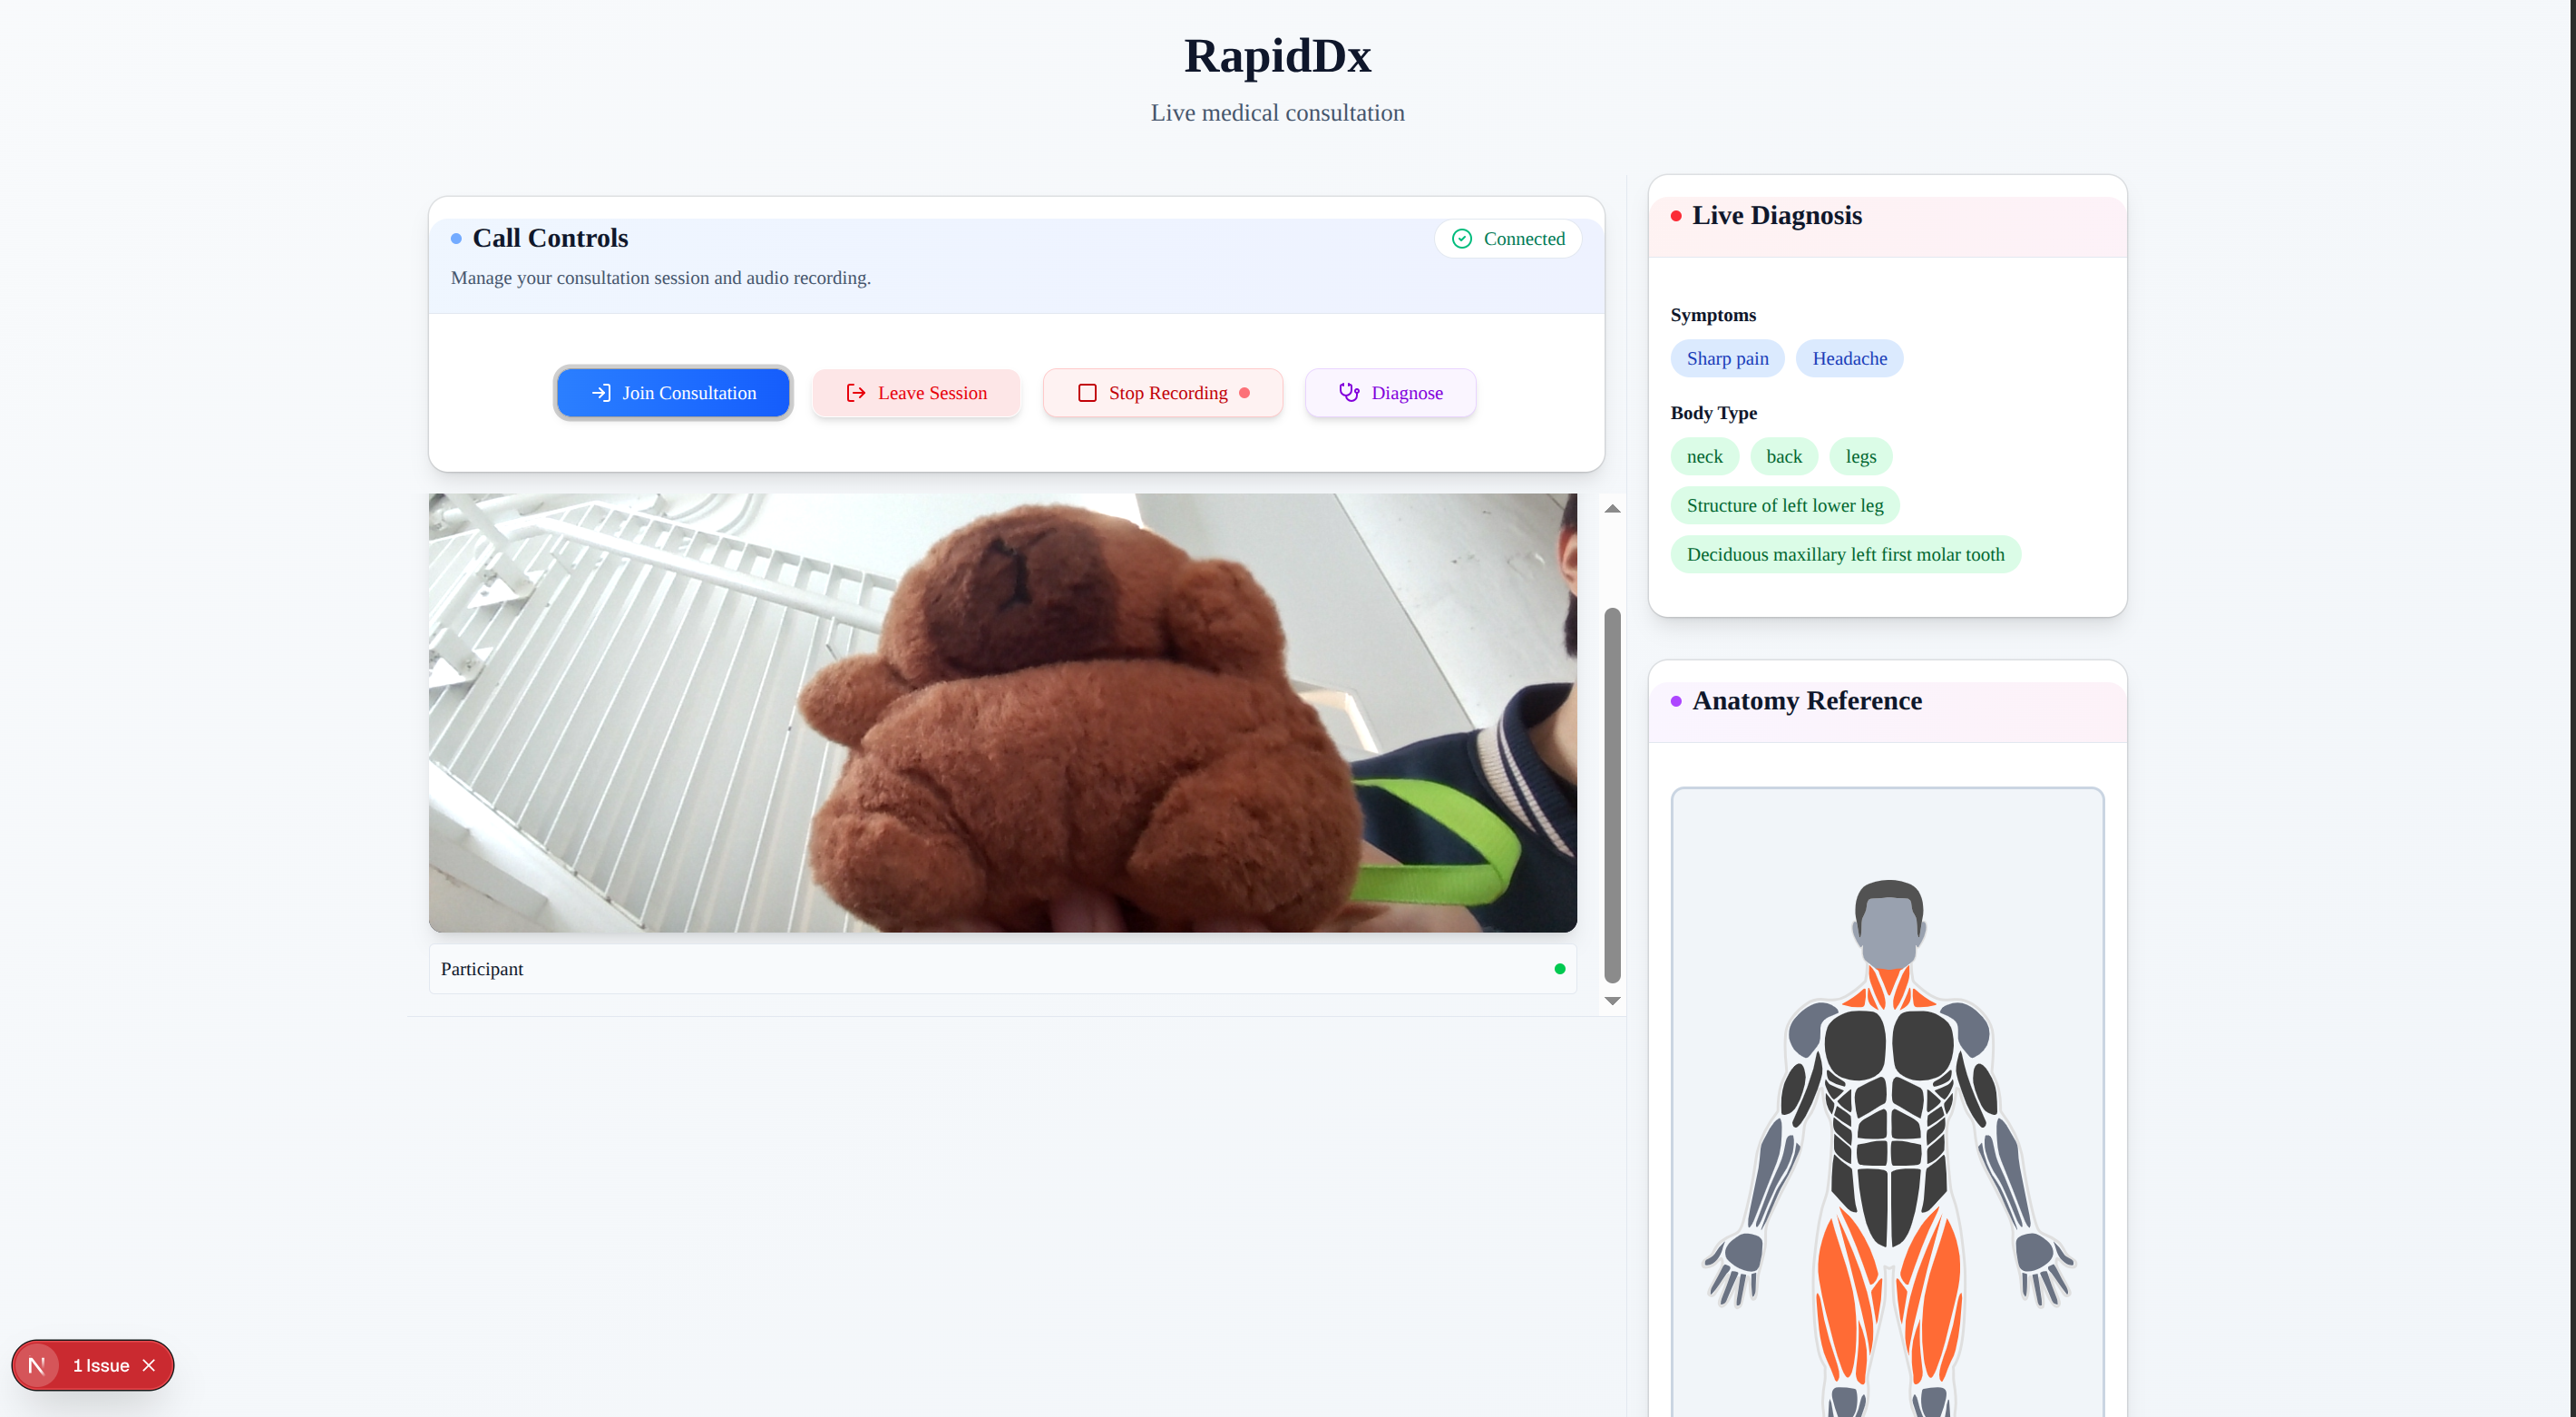
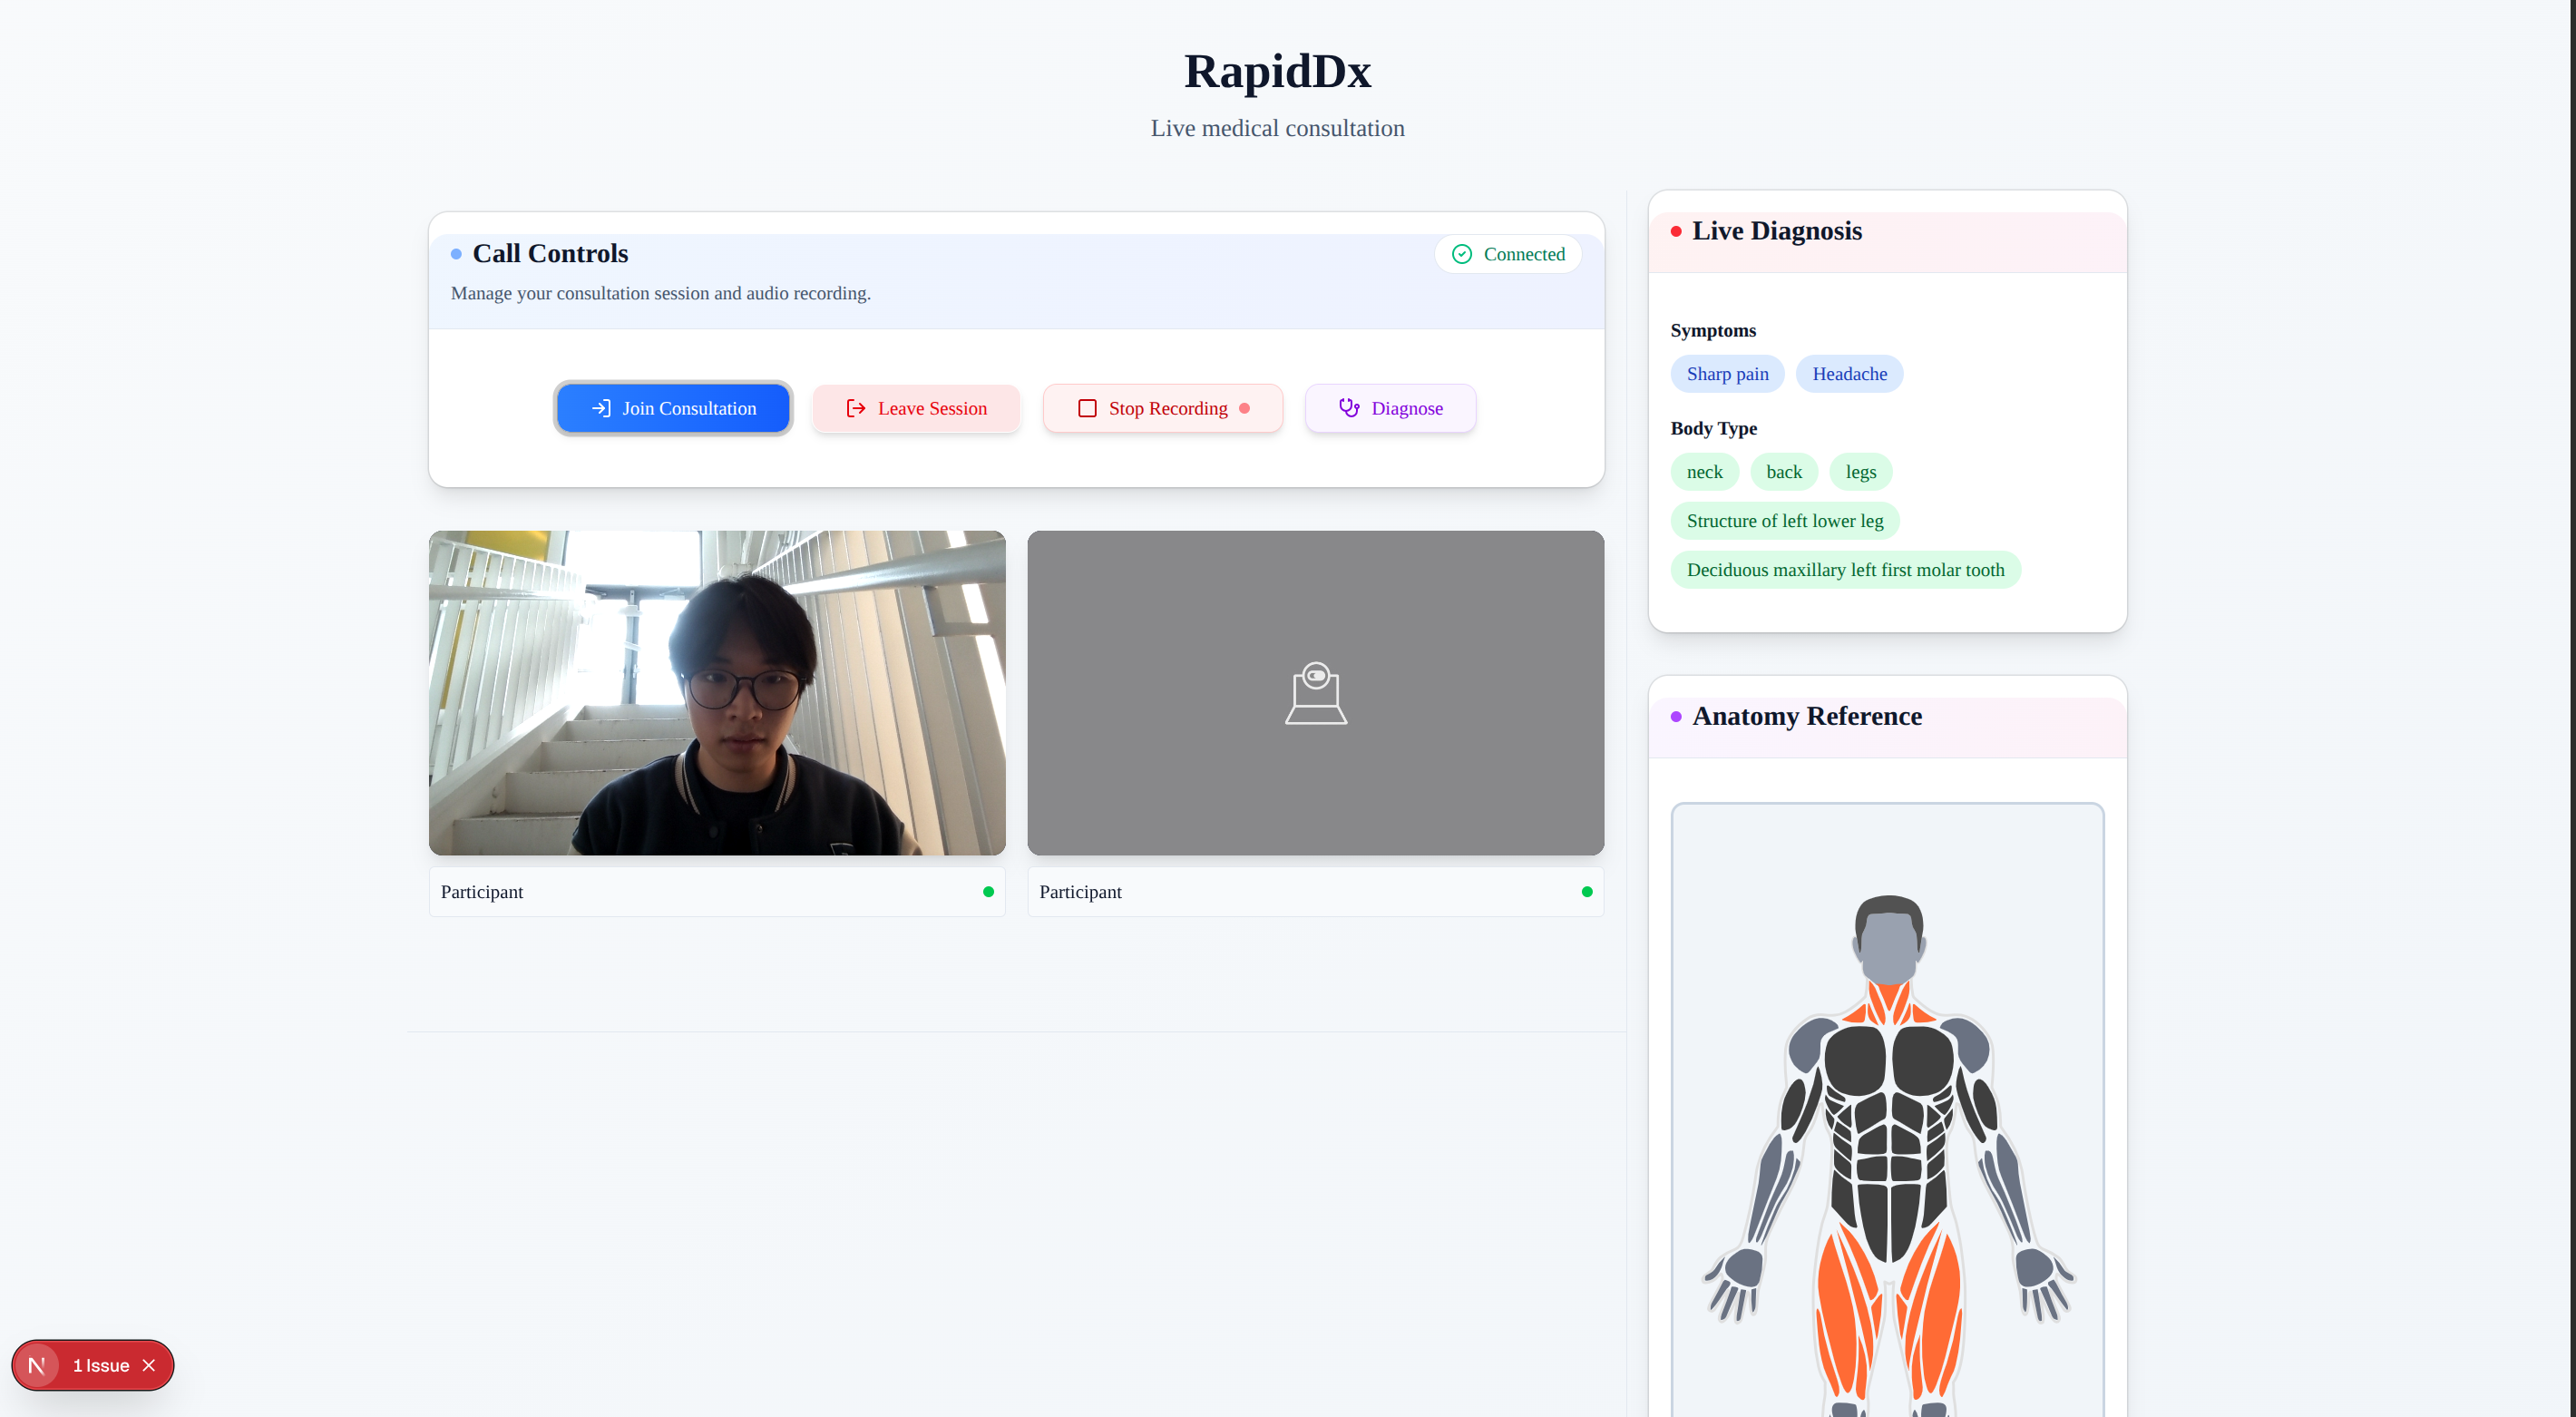
What it does
RapidDx lets users:
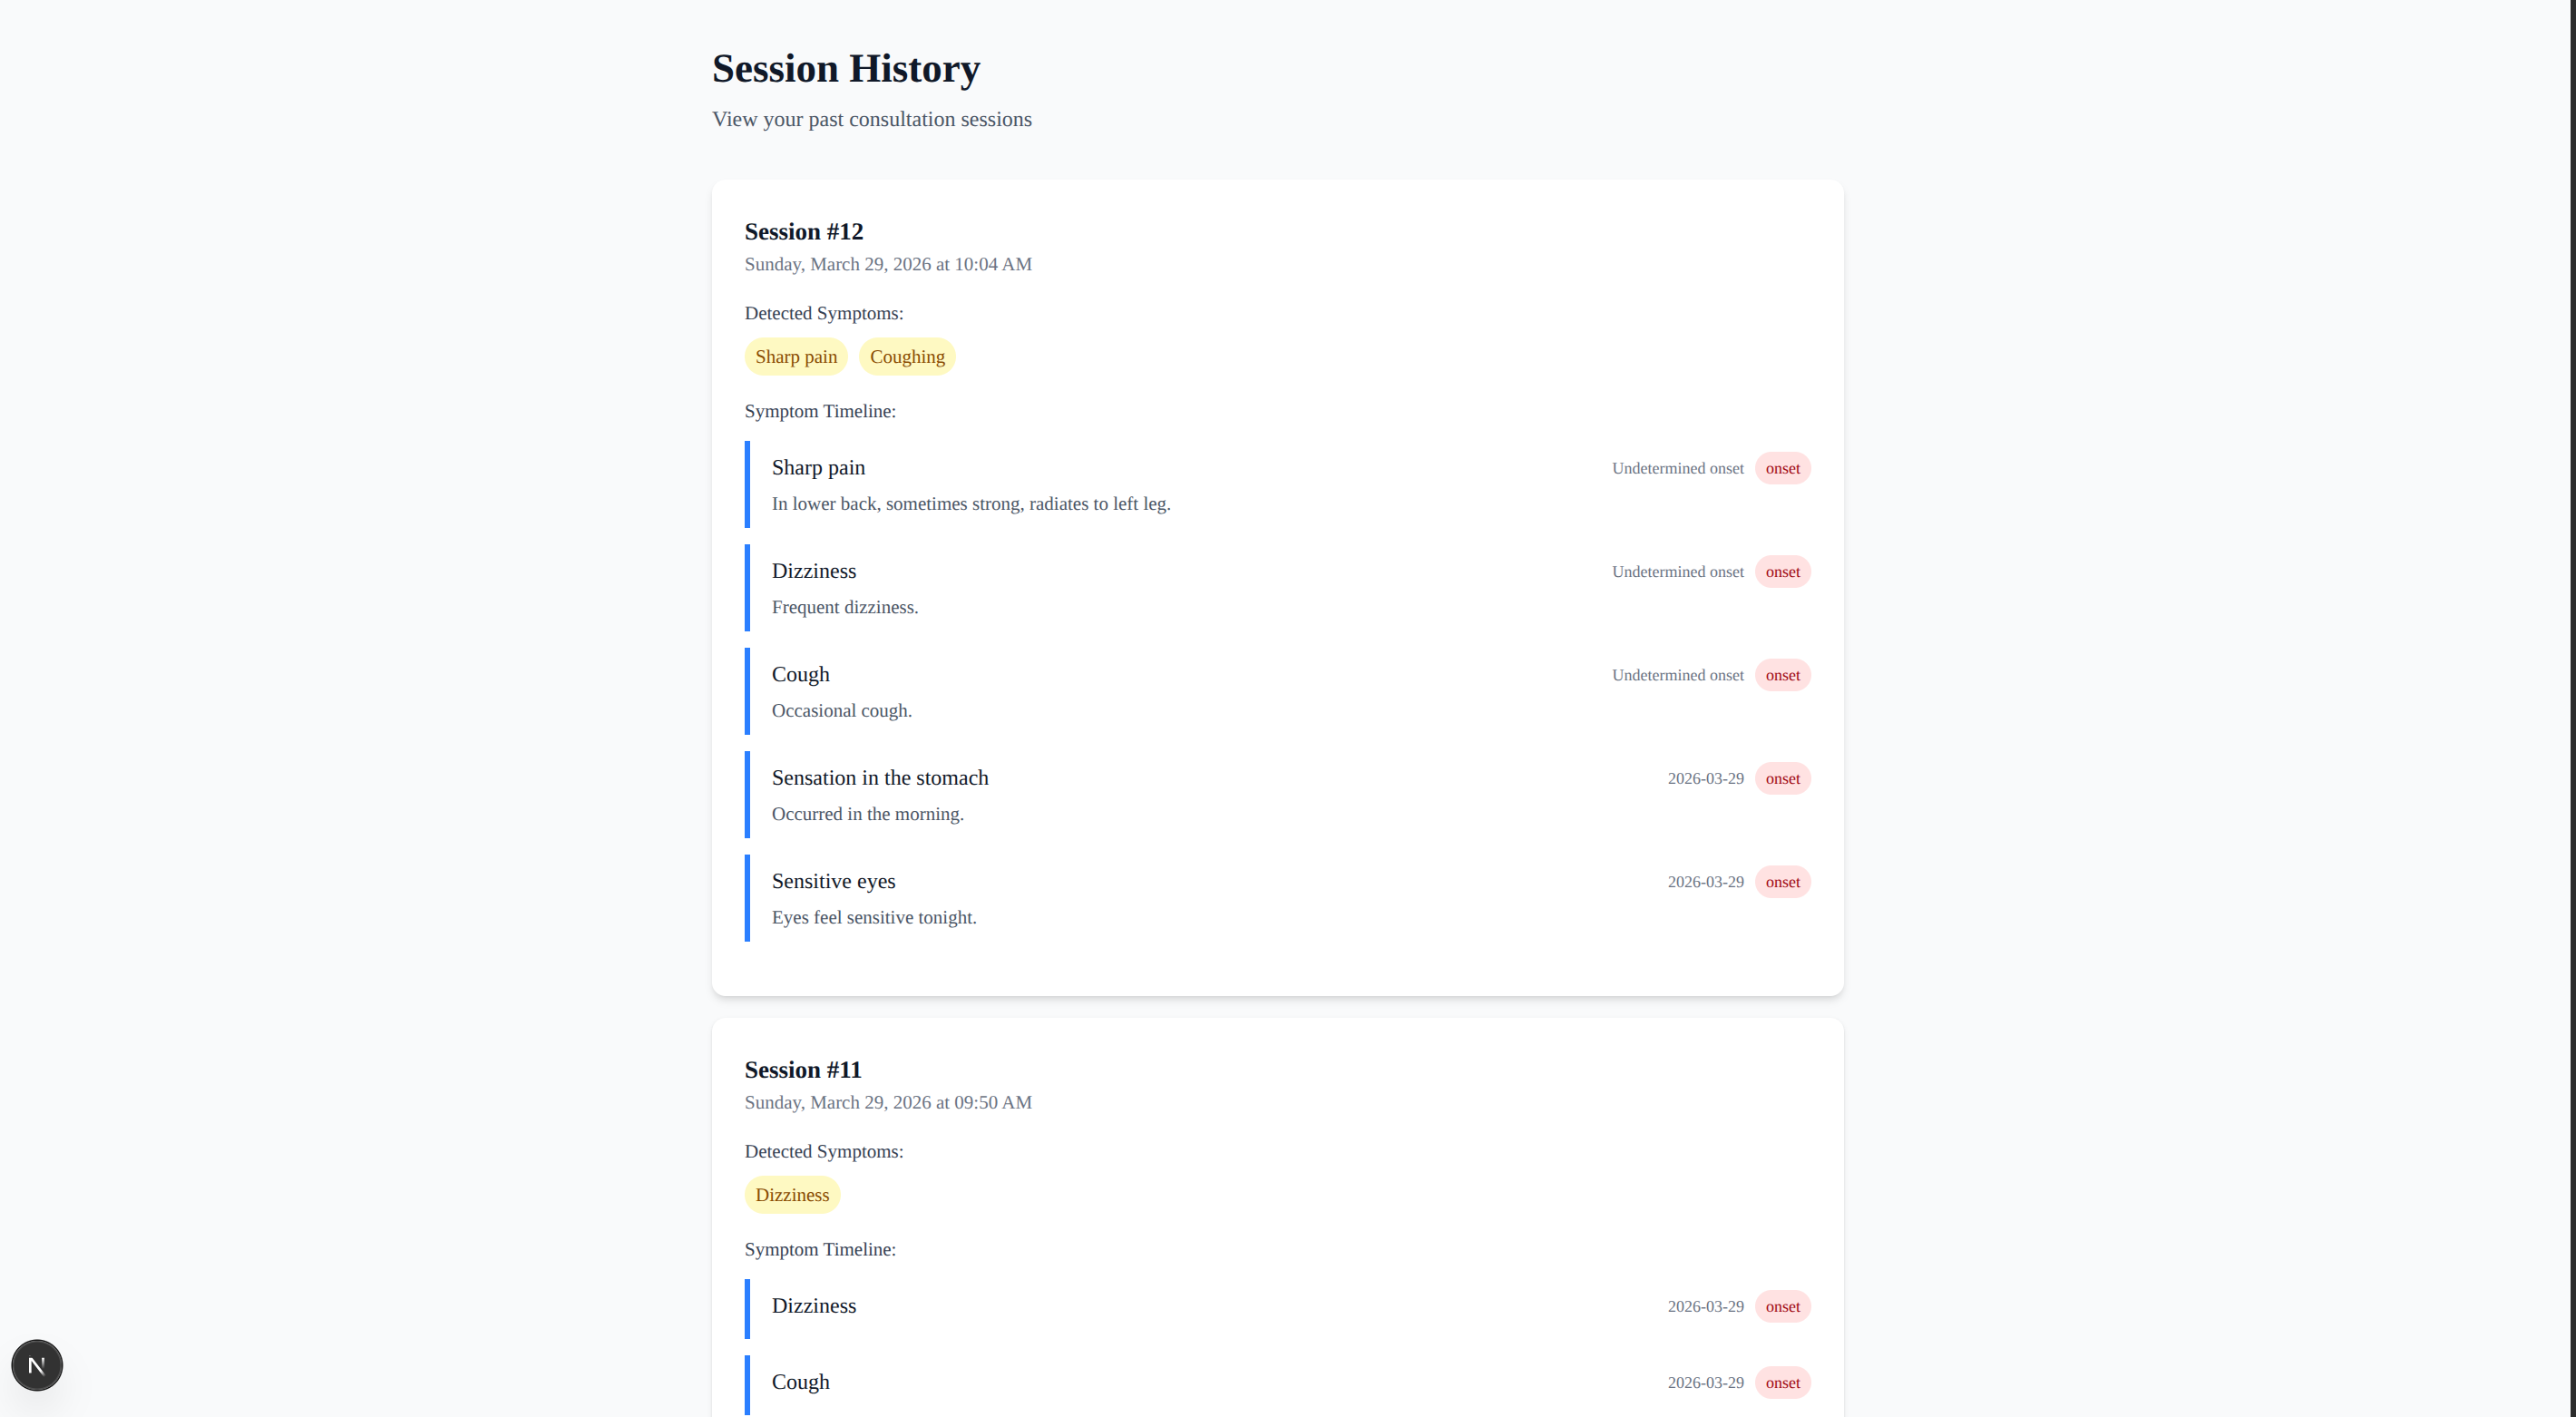
Log symptoms in real time. Map symptoms to specific body parts with an interactive anatomy visualization. Track a live timeline of health events. Get insights and patterns to help users understand their health better.
How we built it
- Frontend: Next.js
- Backend: Flask
- AI: SciSpacy, AI Medical Diagnosis API, Gemini API
- Visualization: 2D anatomy model
Challenges we ran into
- The registration and vetting process for the Infermedica API required several business days, which exceeded our development timeline.
- Implementing a fully interactive 3D anatomical model required complex coordinate mapping and significant development time that was not feasible within the current sprint.
Accomplishments that we're proud of
- Technical Integration: Despite the API constraints, we successfully architected a robust alternative using SciSpacy for medical entity extraction and the AI Medical Diagnosis API for diagnostic reasoning.
What we learned
- [ScispaCy]
- [AI Medical Diagnosis API]
- [Supabase]
What's next for RapidDx
Get acquired my mychart from epic
Built With
- gemini
- python
- supabase
- typescript

Log in or sign up for Devpost to join the conversation.