-

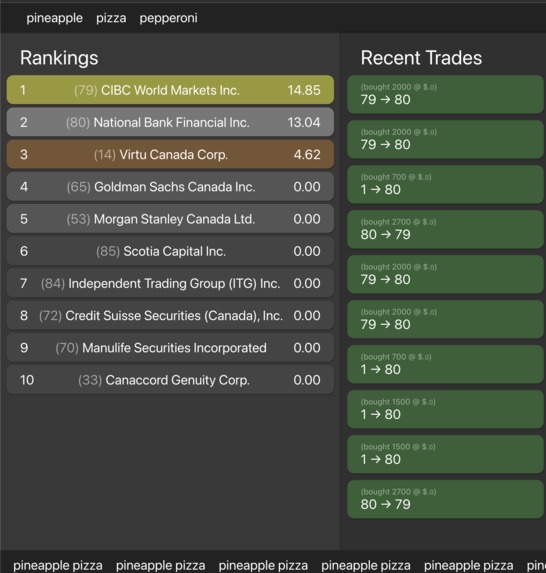
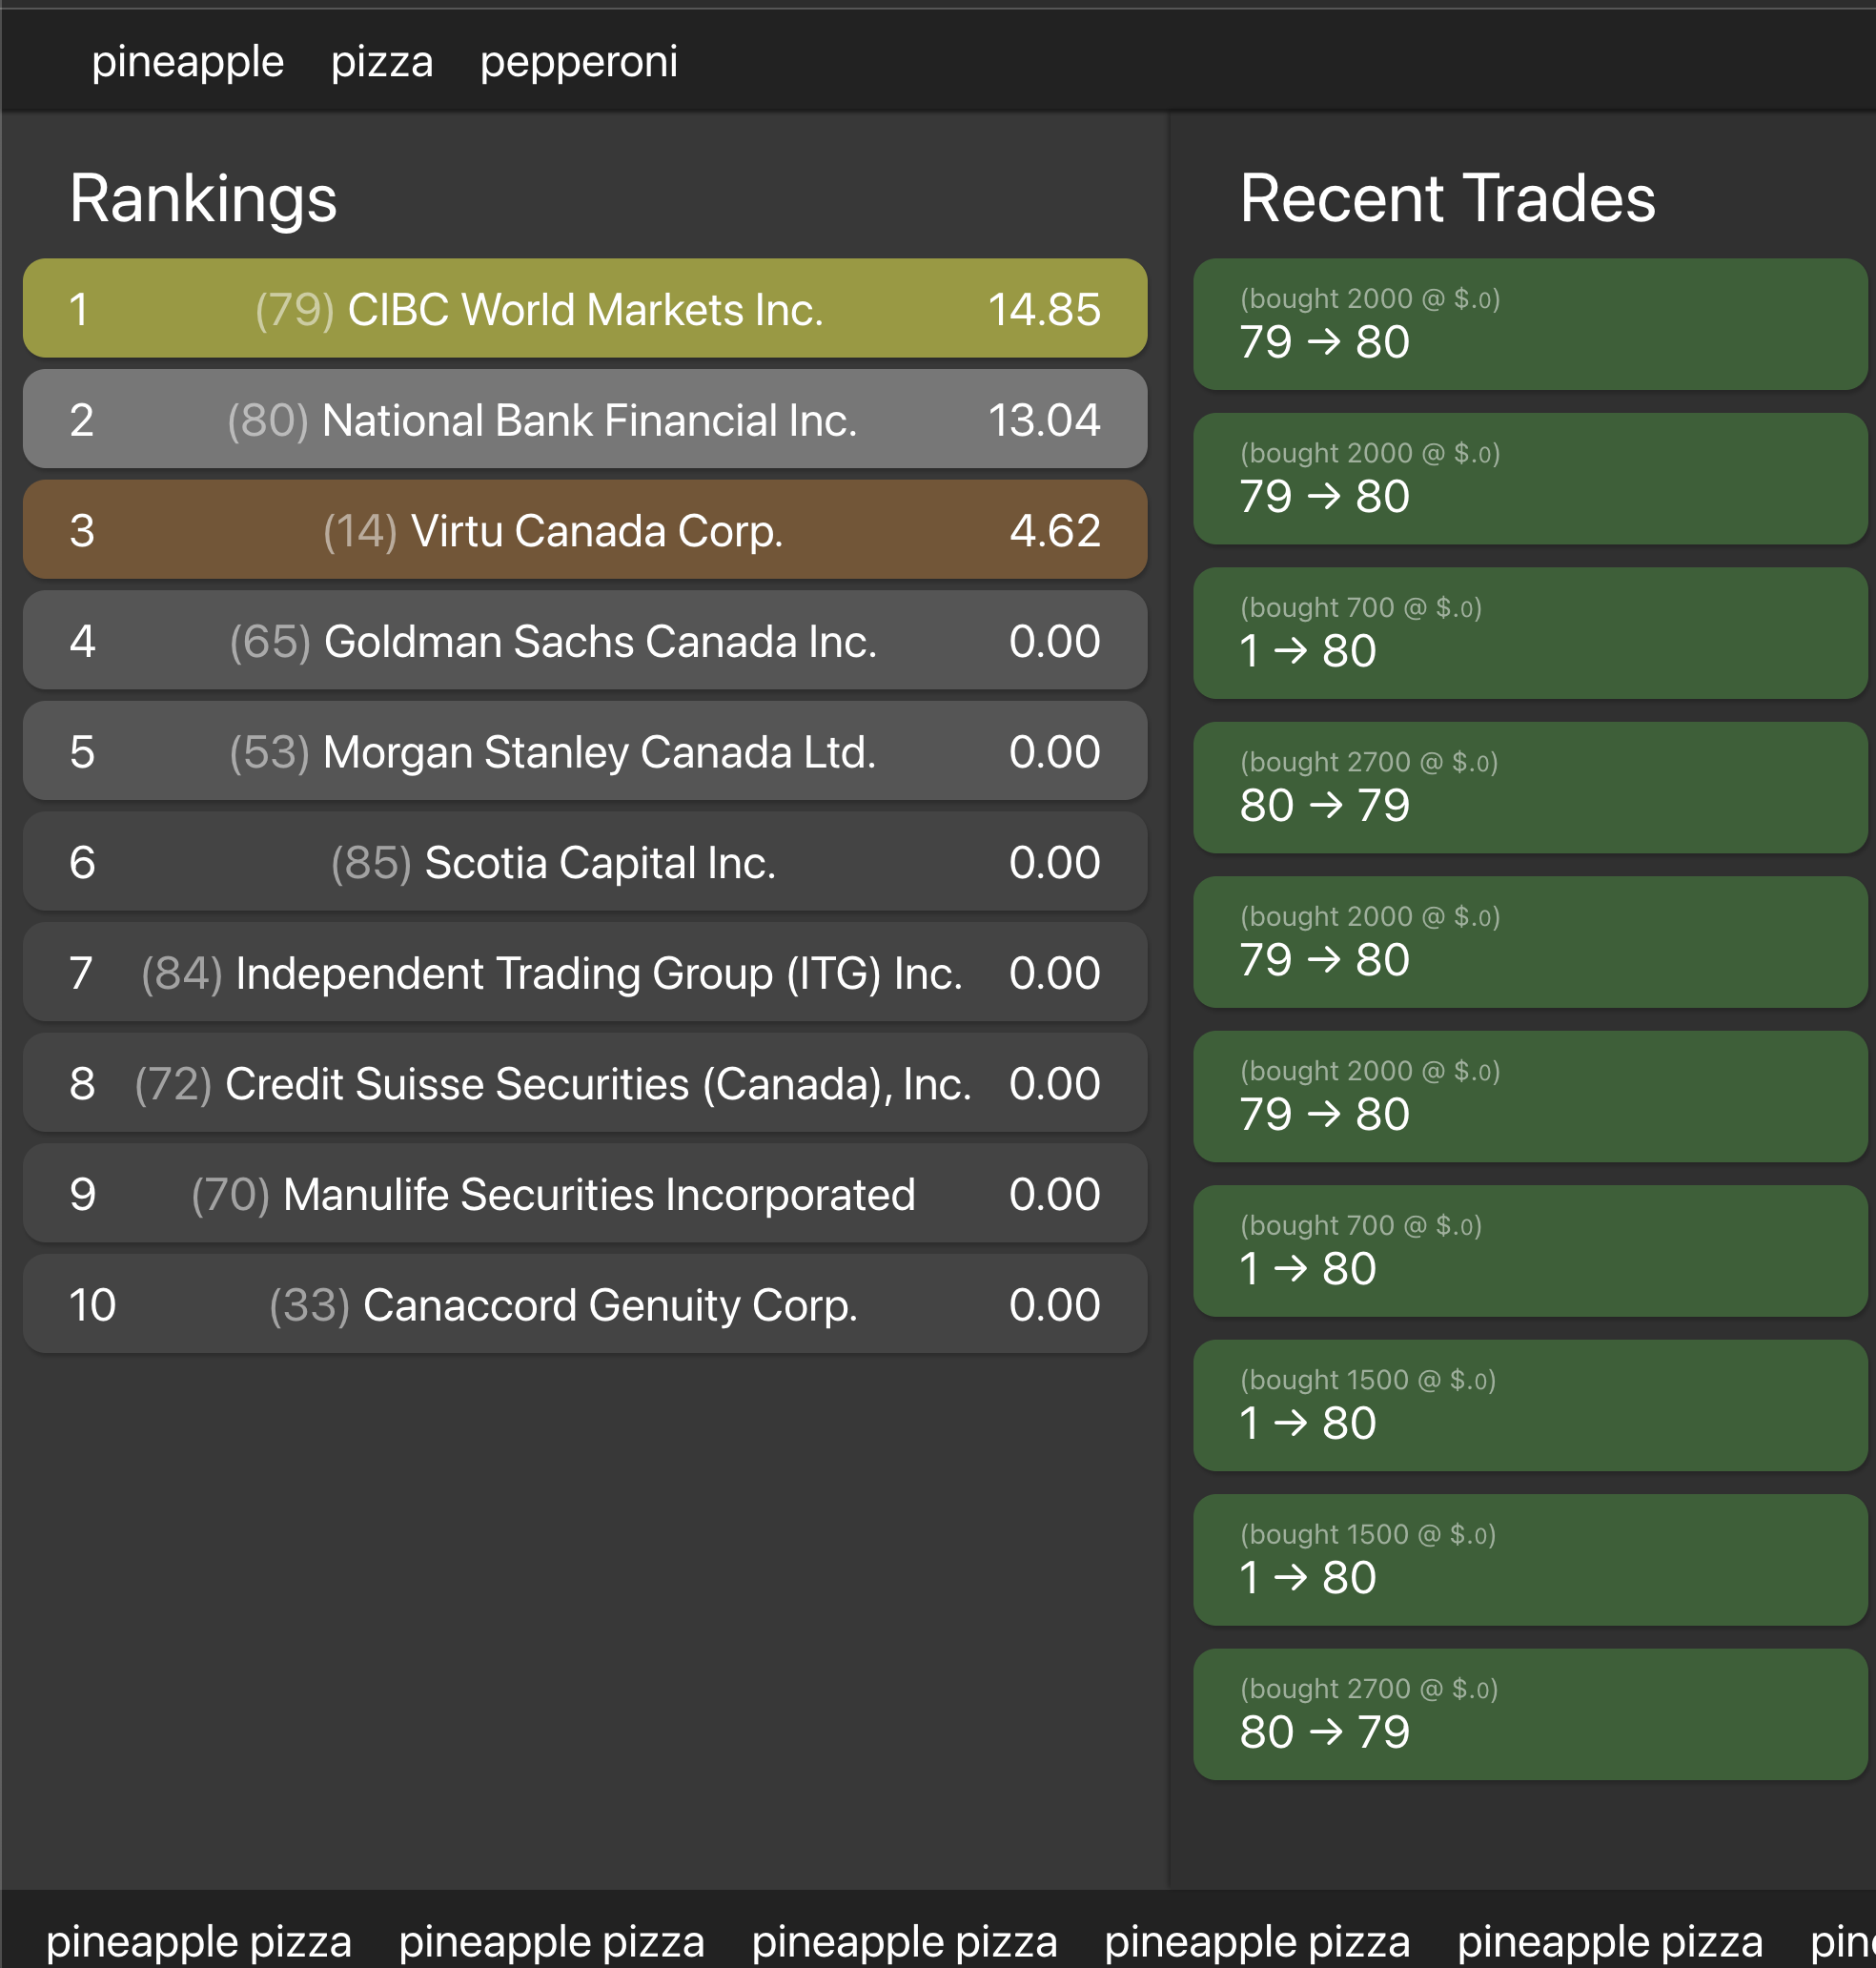
screenshot of the frontend with placeholder data
-
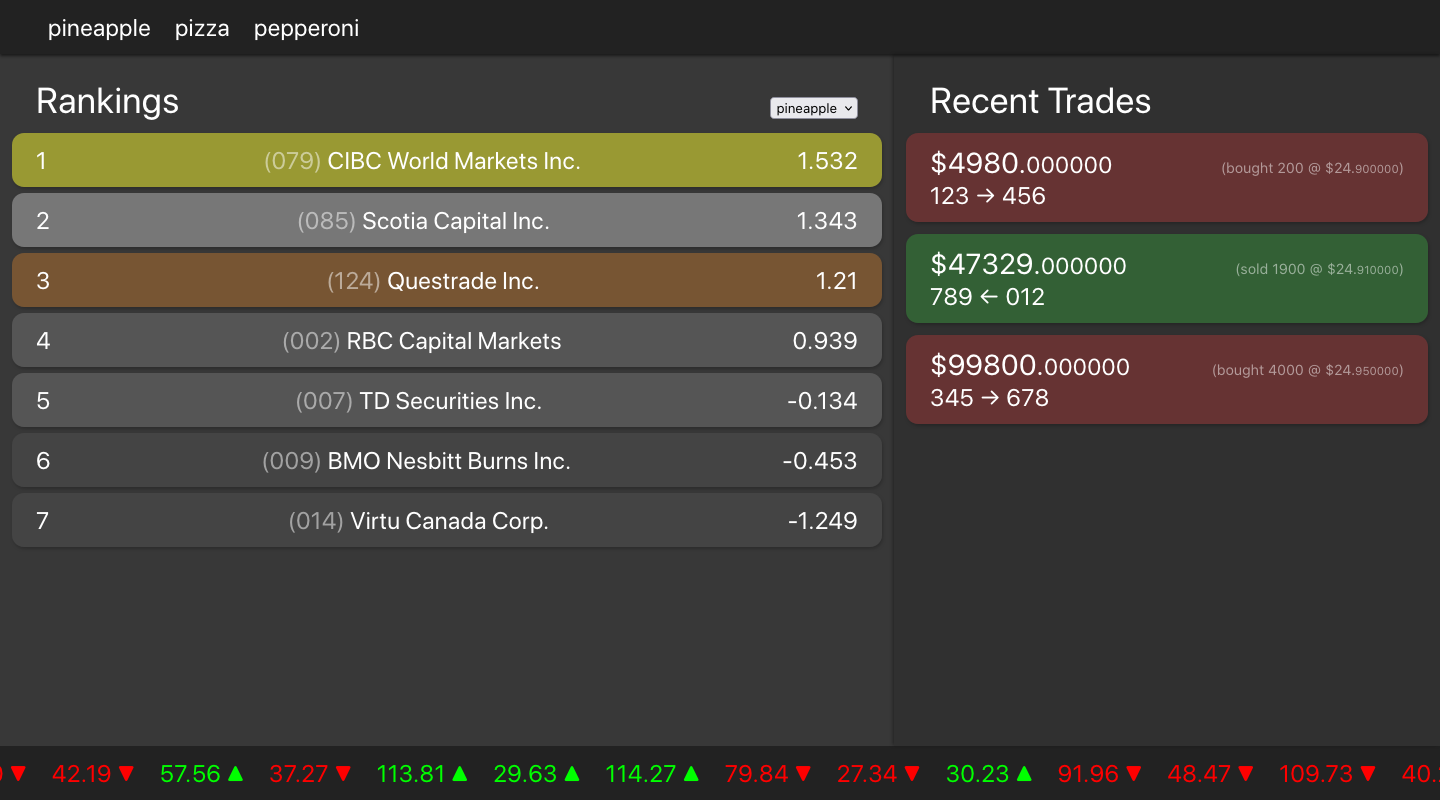
screenshot of the frontend with real data
-
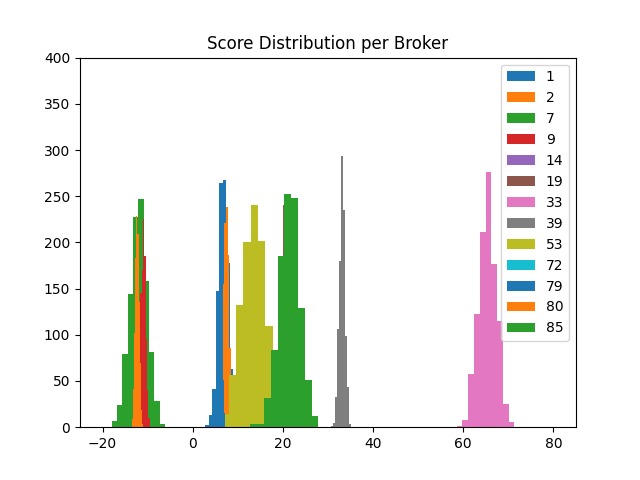
Broker Ratings visualized
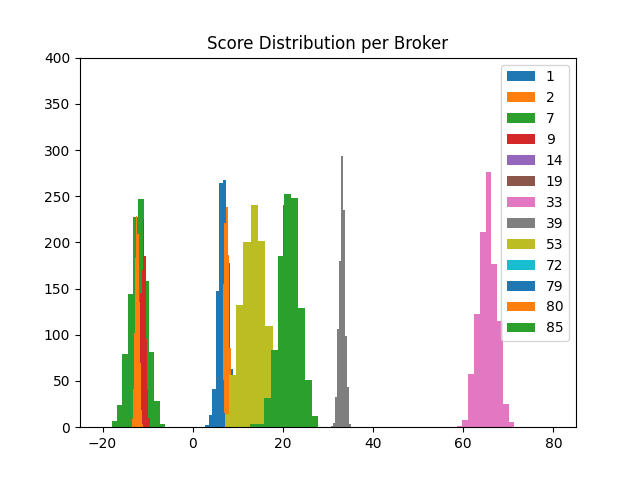
Inspiration
This project idea came to us in a dream! Our dedication to maths led us to implement statistical methods to enhance data analysis.
What it does
This project assigns a score to each participating broker based on a set of criteria (contra broker count, notionals and a personalized transaction score among others). We use the z score to standardize each evaluating criterion. We are also able to build confidence intervals, using bootstrap computing methods, to evaluate the performance of high trading brokers.
We wrote a full-stack Mongo, React, Flask app. We have a front end that fetches the Mongo database to get the calculated score. The backend creates a mock live data situation by fetching data with respect to the time stamps. The broker scores are then calculated and updated in the frontend end. The front end is also responsible for showing the recent trades and the quantities of those.
How we built it
With our brains, sweat and creativity! The building block of our project is a 3.14m snake (pi-thon, python lol).
Challenges we ran into
Having no previous knowledge of finances and stock trading, our greatest challenge was interpreting the data before being able to analyze it. Luckily, through hard work and perseverance, long hours of sleep-deprived conversations and combining the brain power of our group, we came up with realistic criteria and a way to assign scores to the brokers!
Accomplishments that we're proud of
We successfully analyzed the provided data set and applied theoretical statistics theory to a real-life situation. Math is everywhere!
What we learned
Learning about financial terminology and navigating through insane amounts of data :)
What's next for Ranking BS (Brokers' stocks)
We are hoping to optimize the algorithm to analyze real-time data. This would allow the visualization of the performance of the brokers with respect to time.

Log in or sign up for Devpost to join the conversation.