-
-
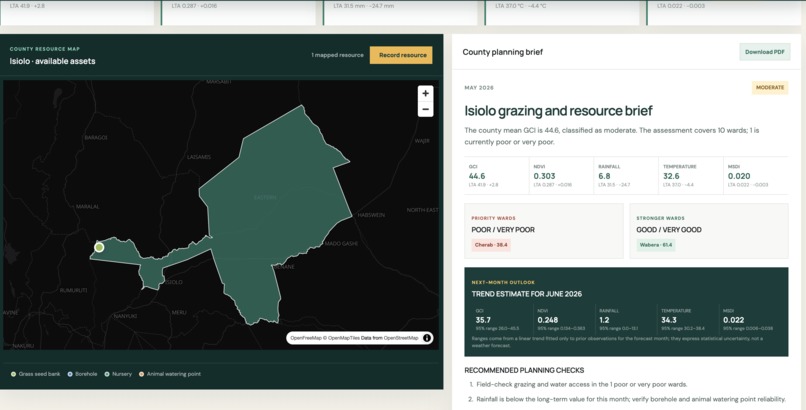
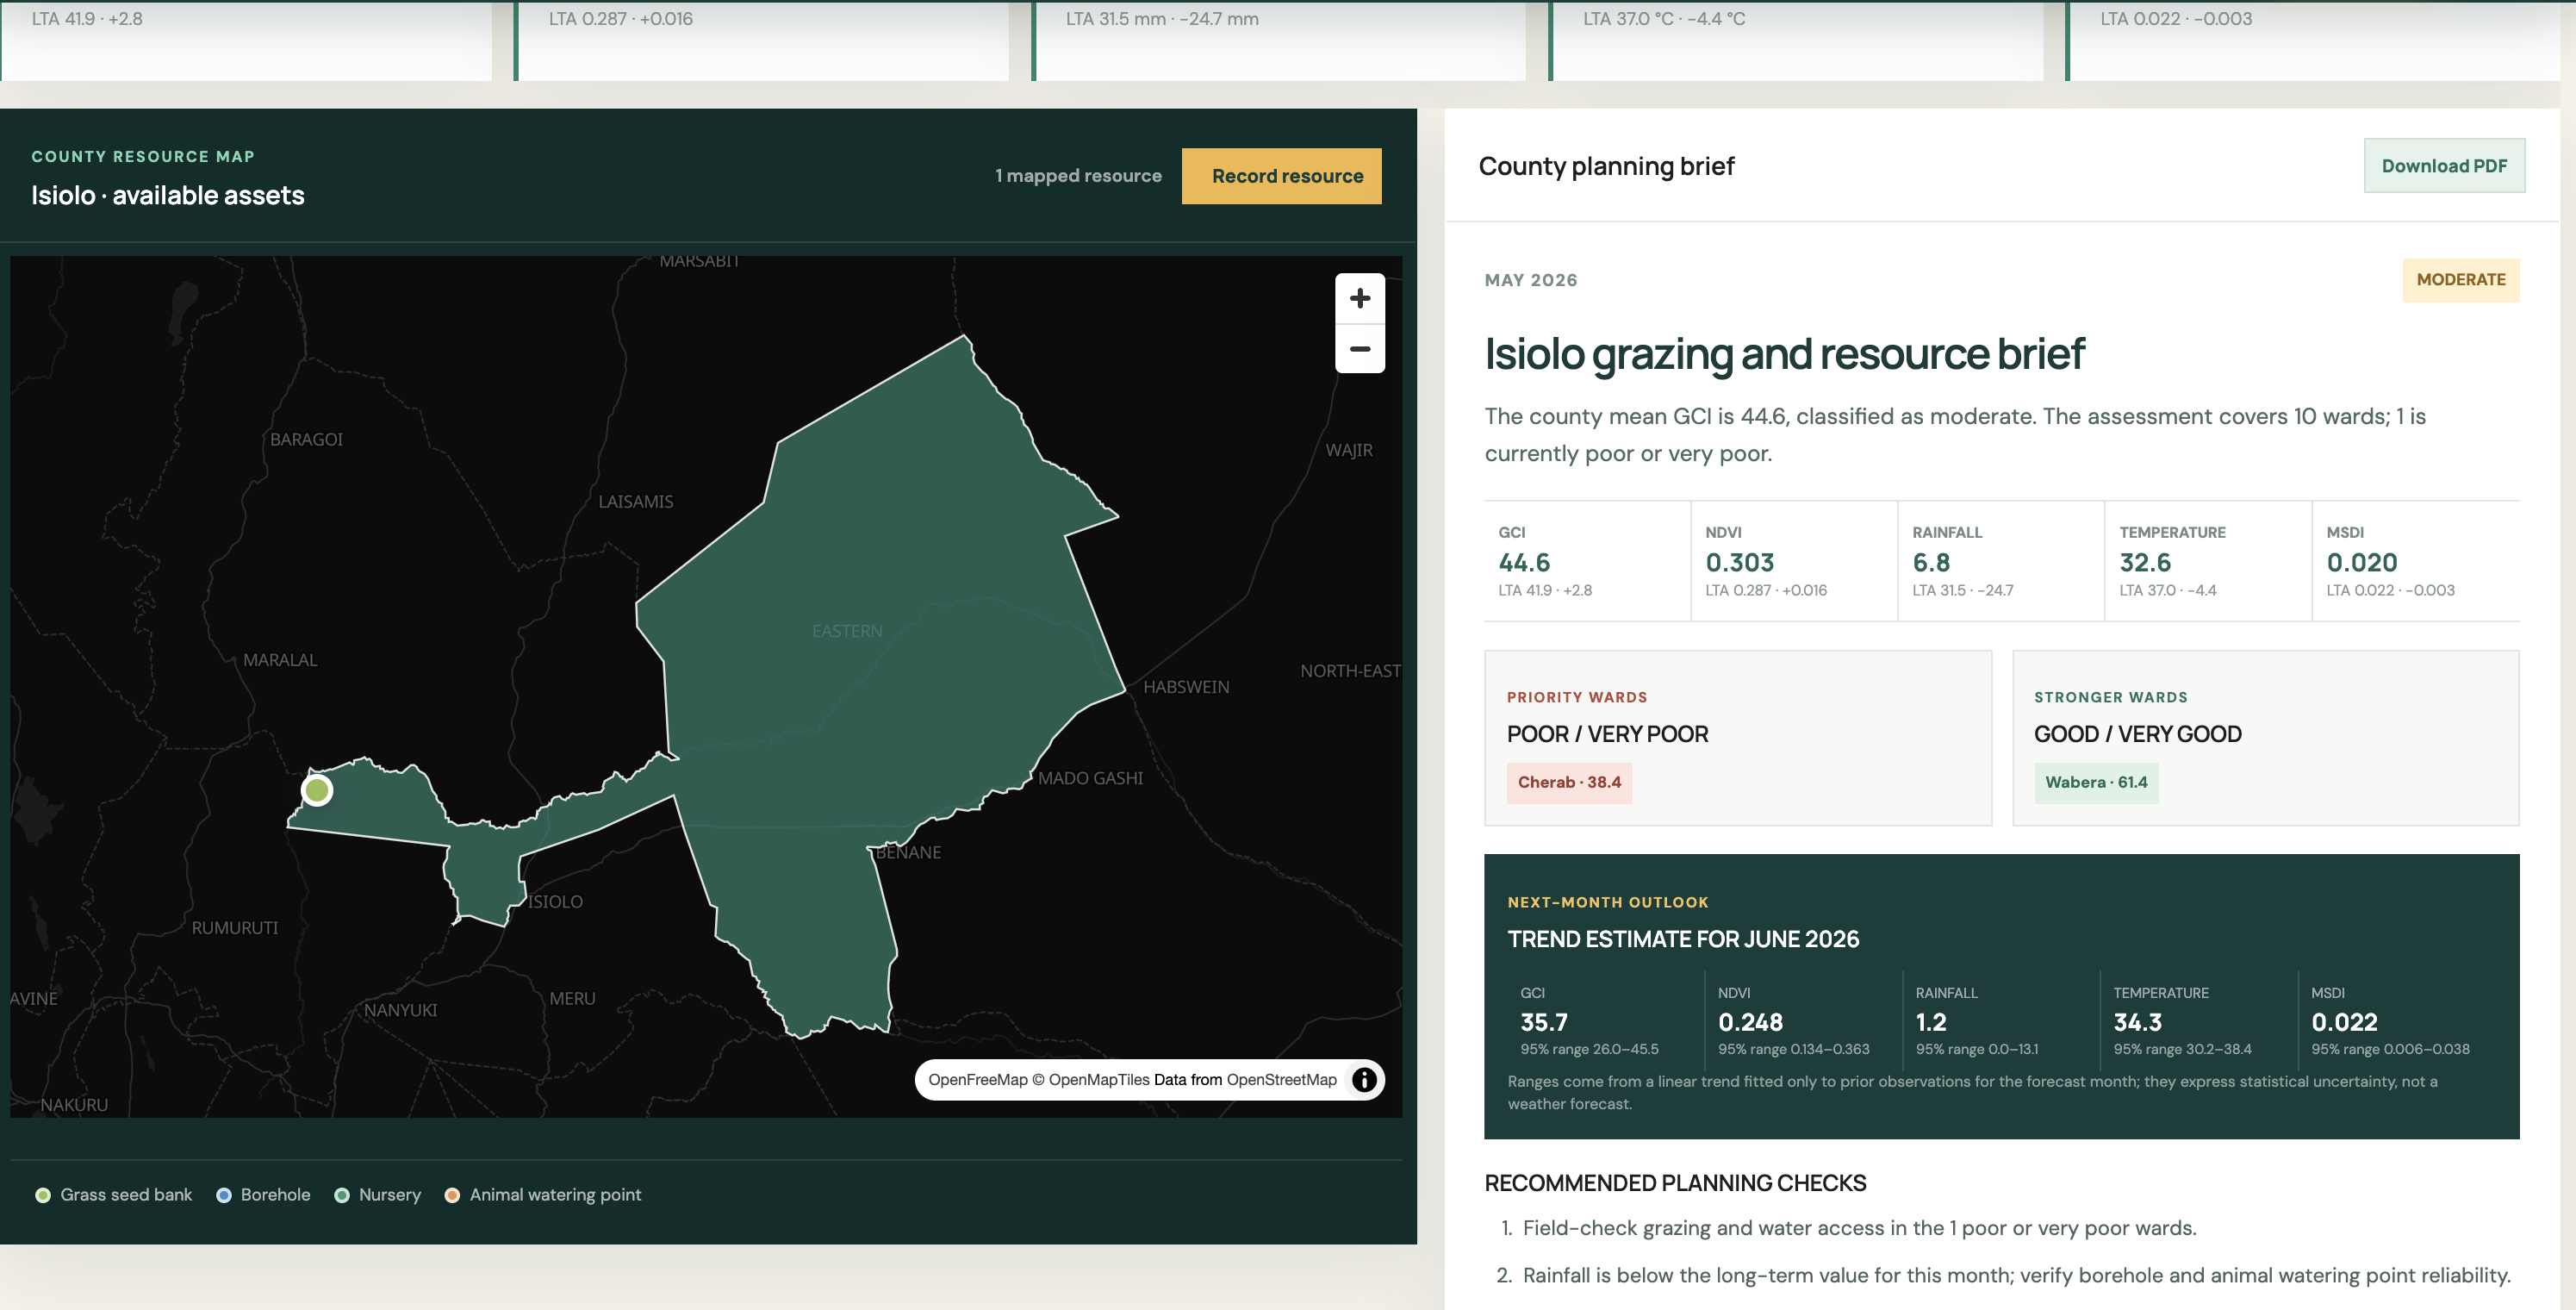
County Planning and Crowd sourcing page to help with quick summaries and collecting locations of rangeland resources
-
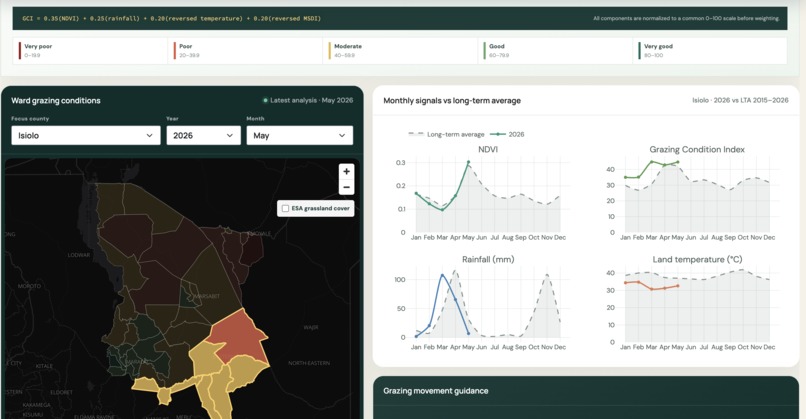
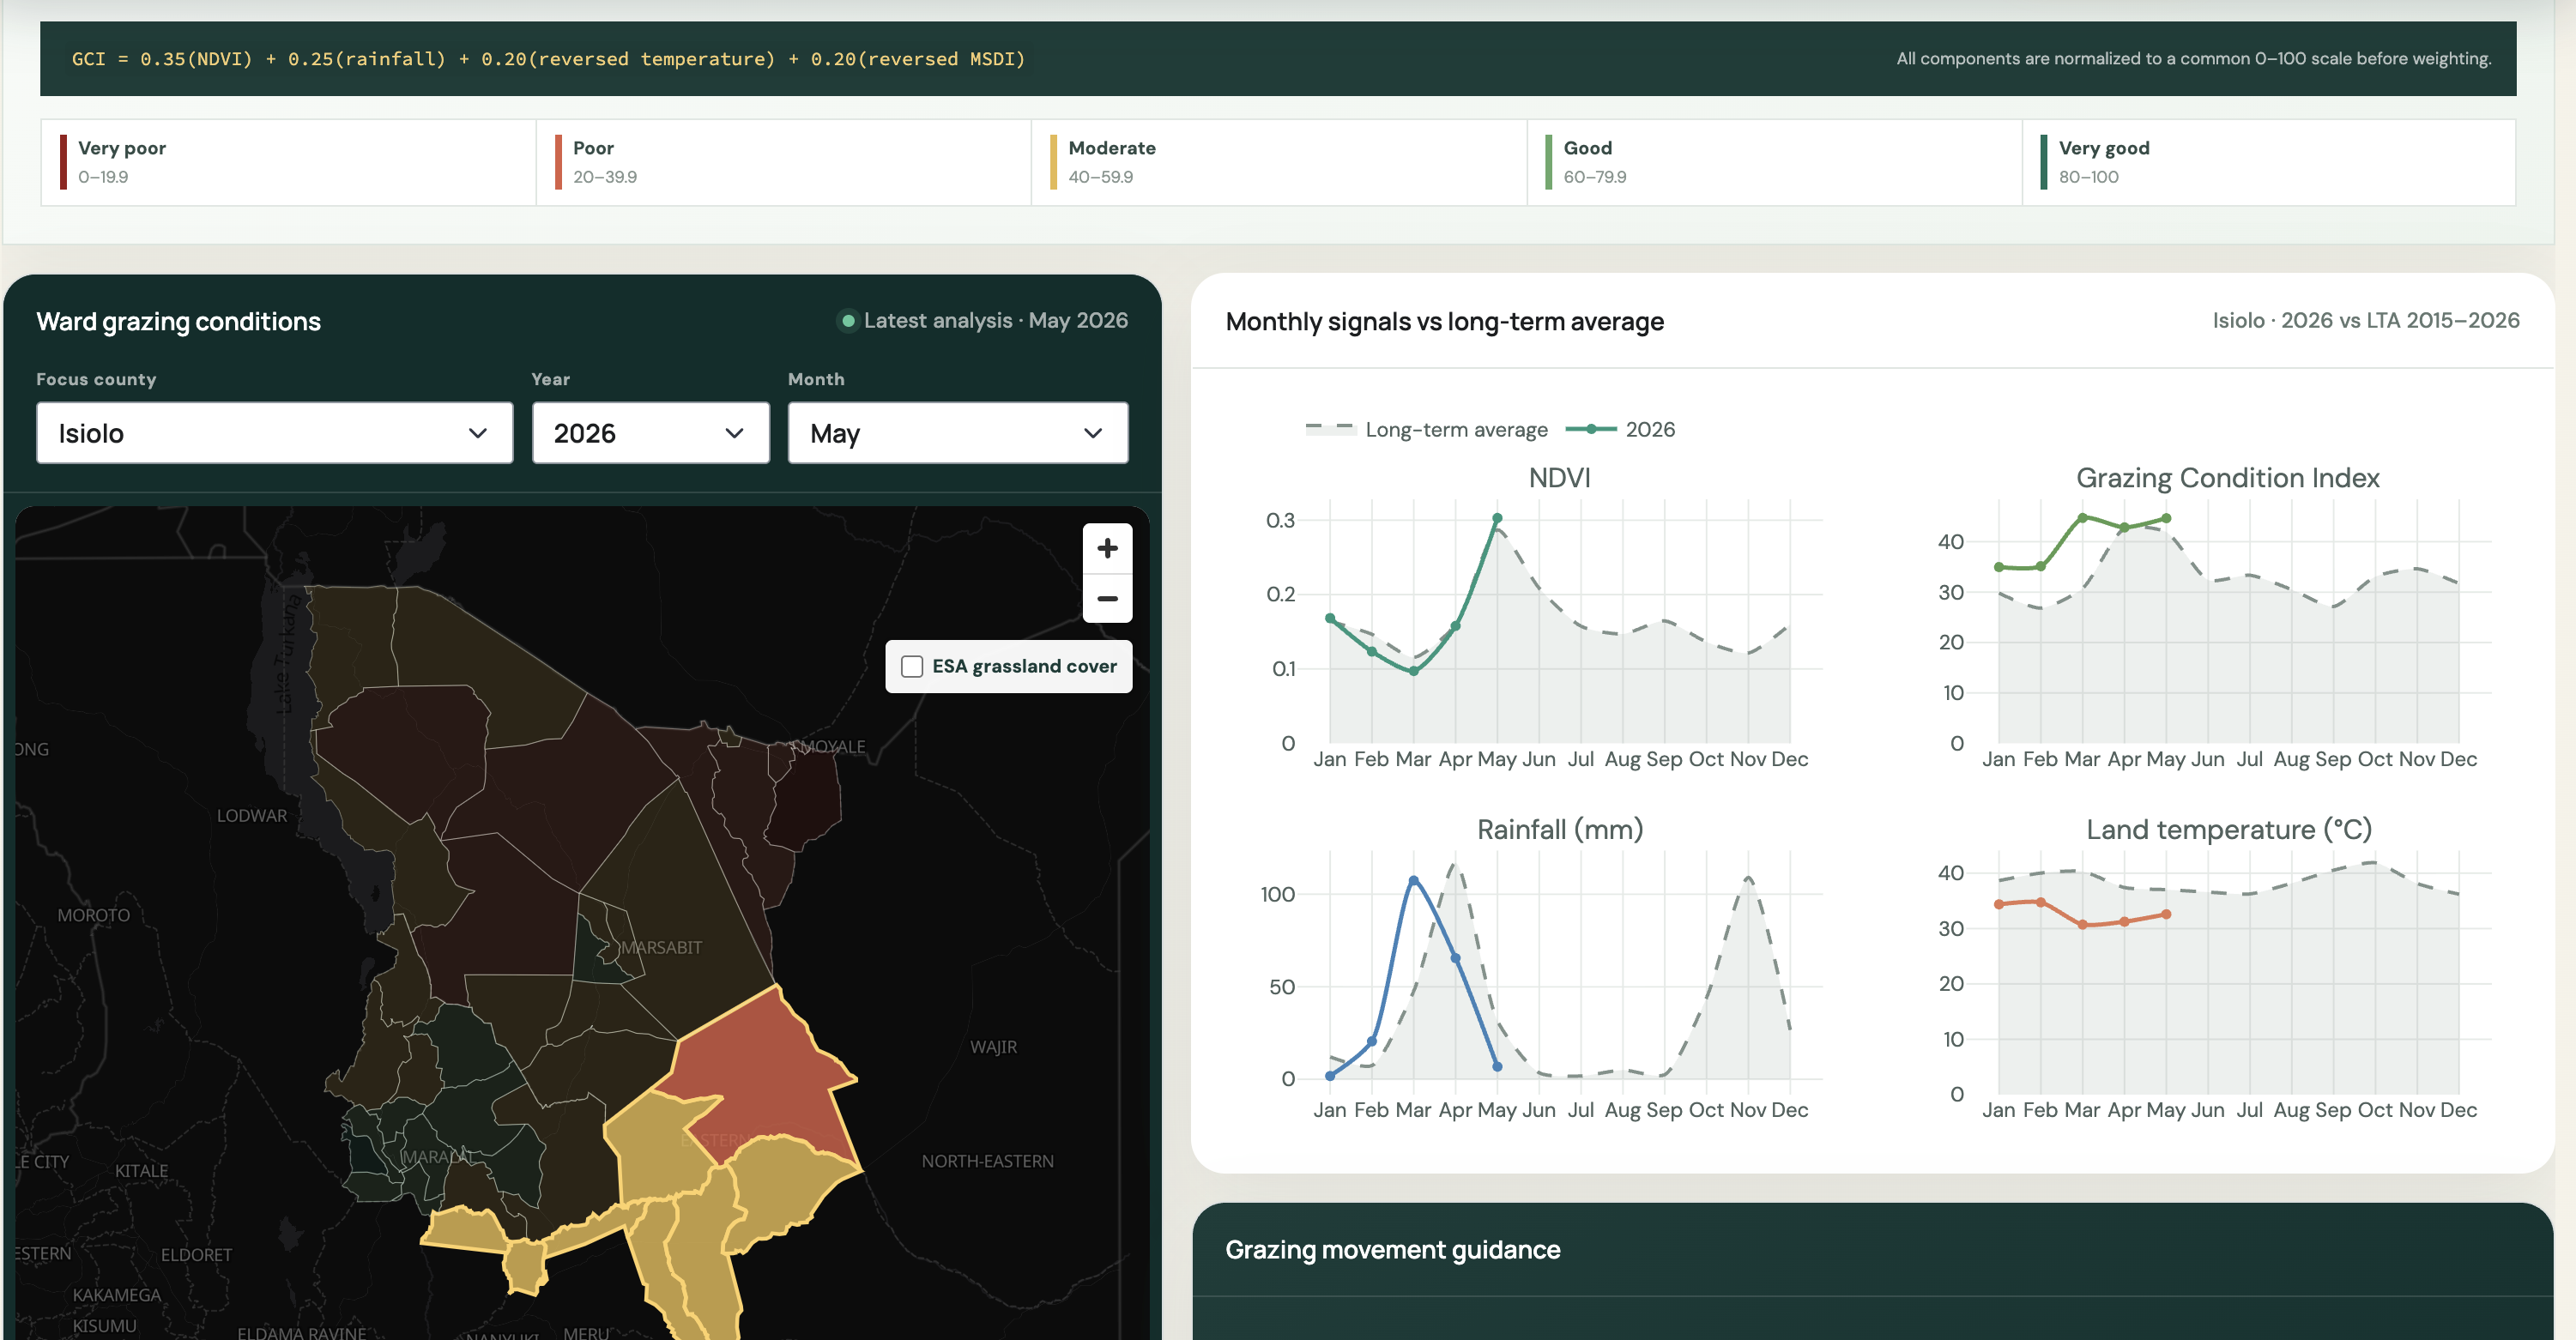
Grassland monitoring dashboard showing the map and graphs of current county condition.
-
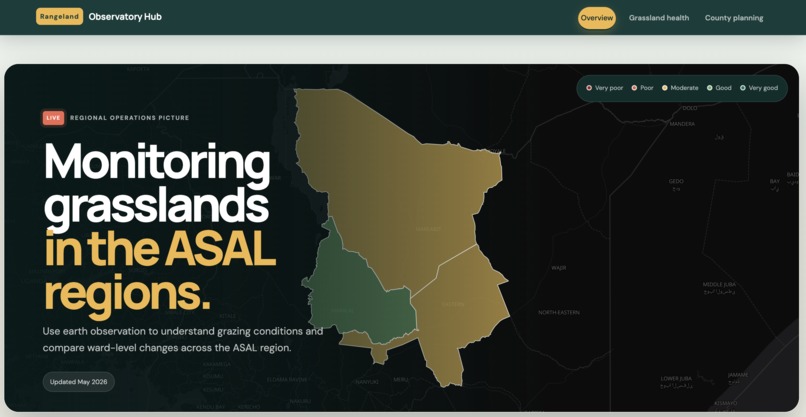
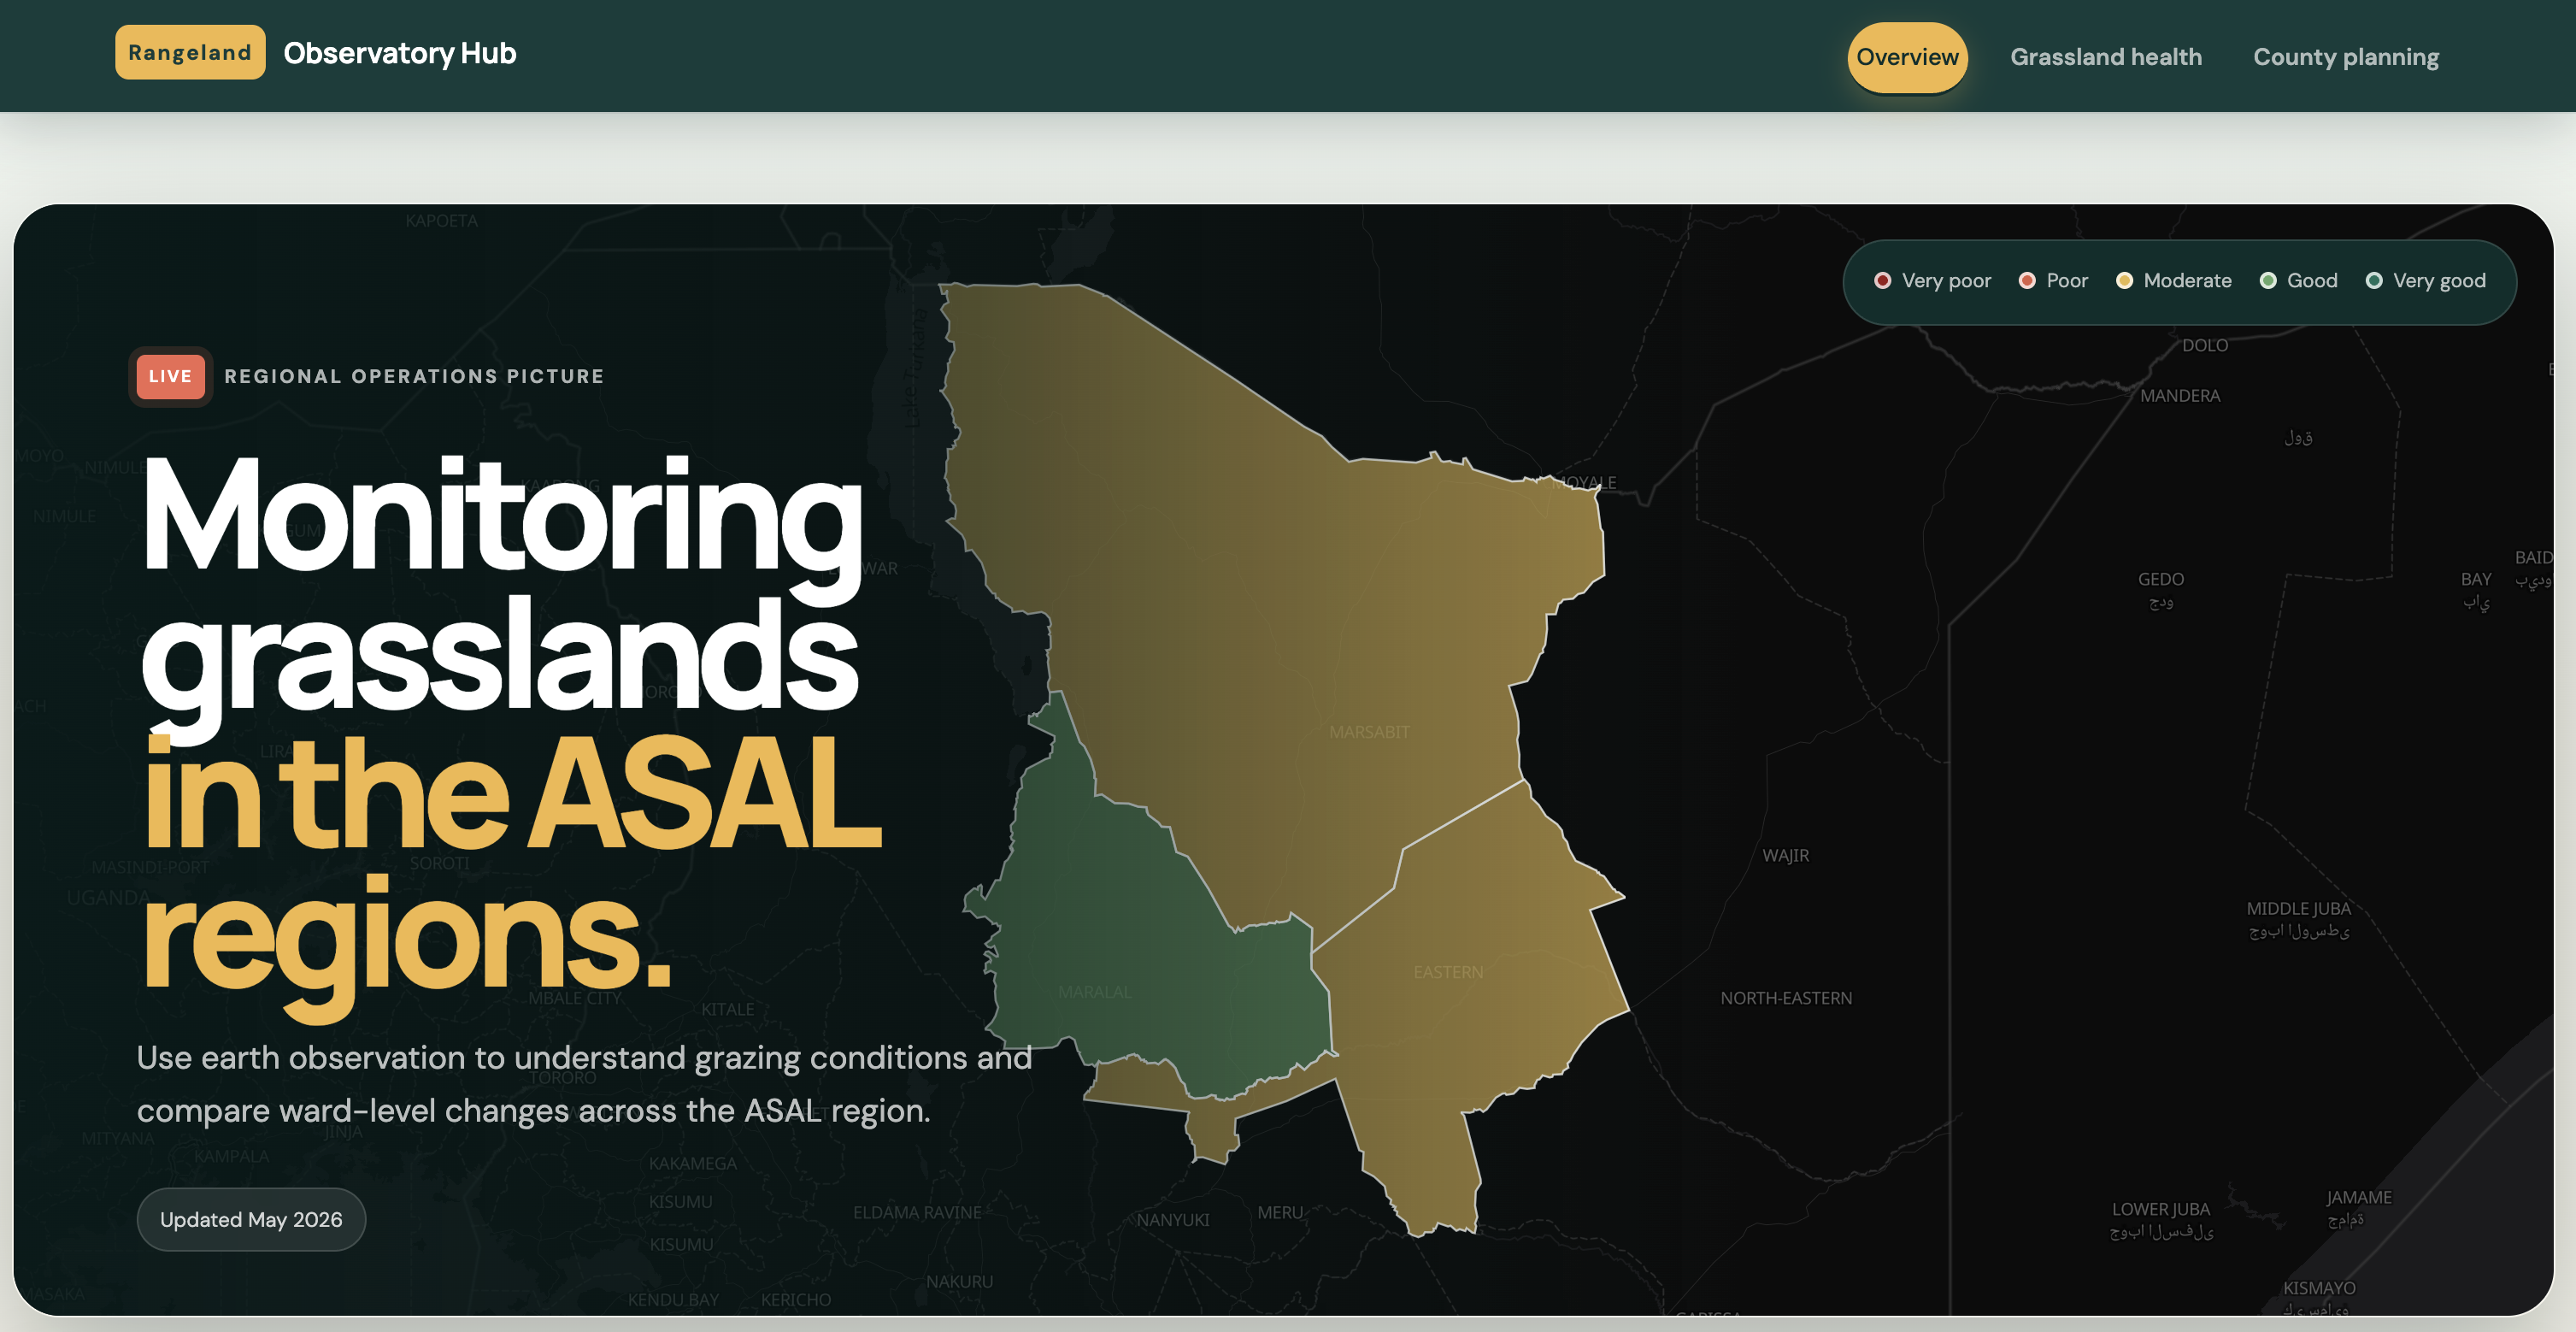
Dashboard landing page showing the focus counties, Marsabit, Samburu and Isiolo
Inspiration
2026 is the International Year of Rangelands and Pastoralists. When we consider that a large proportion of Africa consists of rangelands, it becomes increasingly important to develop tools that can monitor the condition and health of these ecosystems.
This inspired me to develop the Rangeland Observatory Hub, a dashboard that monitors the health of grassland ecosystems by presenting the Grazing Condition Index across Kenya’s arid and semi-arid lands (ASALs).
The tool aims to make satellite-derived information easier to understand and use for rangeland management, grazing planning, early warning, and decision-making.
What It Does
The dashboard has two main components:
1. Grassland Monitoring
The grassland-monitoring component shows changes in grazing conditions across wards in the selected counties.
Users can:
- View the current grazing condition of different wards.
- Examine grazing-condition trends over time.
- Compare wards and counties.
- Identify areas with good, moderate, poor, or very poor grazing conditions.
- Generate maps, charts, and downloadable reports based on their current selections.
This component helps highlight areas that may be experiencing vegetation stress, declining pasture conditions, or possible rangeland degradation.
2. Crowdsourcing Rangeland Resources
The crowdsourcing component allows users to record rangeland resources and provide their locations using either:
- Geocoding, by searching for a place; or
- Their current device location.
The collected information can help build a database of important rangeland resources, such as water points, grazing areas, livestock facilities, and other resources used by pastoral communities.
In the future, this database could support rangeland planning, resource mapping, field validation, and the development of training datasets for rangeland monitoring models.
How We Built It
The first step involved acquiring and processing satellite and climate data. Google Earth Engine scripts were developed to calculate environmental indicators associated with grazing conditions.
The main data sources were:
- Landsat imagery for calculating the Moving Standard Deviation Index (MSDI).
- MODIS NDVI for monitoring vegetation greenness and changes in pasture conditions.
- MODIS Land Surface Temperature (LST) for assessing temperature related vegetation stress.
- CHIRPS rainfall data for analysing rainfall amounts
These indicators were combined to produce the Grazing Condition Index.
The next step involved designing the dashboard interface and determining how the maps, graphs, statistics, and reports would be presented. The dashboard was developed using Python and Shiny for Python.
Linear trend models were fitted to the time series data to show whether grazing conditions in each ward was improving, declining, or remaining relatively stable over time.
Challenges We Ran Into
One of the main challenges was the high computational demand of processing the datasets. Performing moving window analysis at a relatively high spatial resolution across all three counties resulted in computation timeouts and memory-limit errors.
The MSDI calculation was particularly demanding because it required analyzing the spatial variation of pixels within a moving 3 x 3 window across a large area and for multiple time periods.
Another challenge was generating dynamic PDF reports. The goal was to produce reports that were not large blocks of text, but instead included:
- Summary statistics
- Grazing-condition classifications
- Selected county and ward information
The reports also needed to automatically adapt to the user’s current dashboard selections.
Accomplishments That We Are Proud Of
One of our biggest accomplishments was using a Grazing Condition Index that incorporates MSDI.
MSDI is a concept that is still being explored for rangeland monitoring. Seeing the index respond as expected to climatic variability was therefore an important achievement.
The resulting trends corresponded with known historical dry and wet years, suggesting that the index can capture meaningful changes in grazing conditions.
We are also proud of developing a single platform that combines:
- Satellite-based rangeland monitoring
- Ward-level comparisons
- Dynamic report generation
- Crowdsourced rangeland resource mapping
What We Learned
Through this project, we learned how MSDI can be used to represent spatial variability and possible disturbances within grazing lands, including disturbances associated with overgrazing and land degradation.
We also learned how different environmental variables including vegetation greenness, rainfall, temperature, and surface variability can be combined to provide a more comprehensive assessment of grazing conditions.
From a technical perspective, we gained experience using Shiny for Python to create an interactive dashboard with:
- Responsive user-interface components
- Interactive maps and charts
- Geocoding functionality
- Current location capture
- Time series analysis
- Dynamic PDF reporting
What’s Next for the Rangeland Observatory Hub
The next step is to find ground based rangeland data to further validate the Grazing Condition Index and assess its performance under different grazing and ecological conditions.
We also plan to explore the integration of weather forecasts so that the platform can move beyond monitoring current conditions and begin forecasting future grazing conditions.
Additional planned improvements include:
- Sending SMS alerts when an area is classified as having poor or very poor grazing conditions.
- Expanding the dashboard to additional ASAL counties.
- Improving the crowdsourced rangeland resource database.
- Incorporating field observations from pastoral communities and county officers.
Built With
- gee
- python
- shiny


Log in or sign up for Devpost to join the conversation.