Inspiration
Starting a new small business is a high-risk endeavor, especially in the restaurant industry, where location can make or break success. We were inspired to create a data-driven tool that removes the guesswork for entrepreneurs, helping them identify 'high-traffic' areas optimized for business growth by analyzing real-world consumer behavior and migration patterns.
What it does
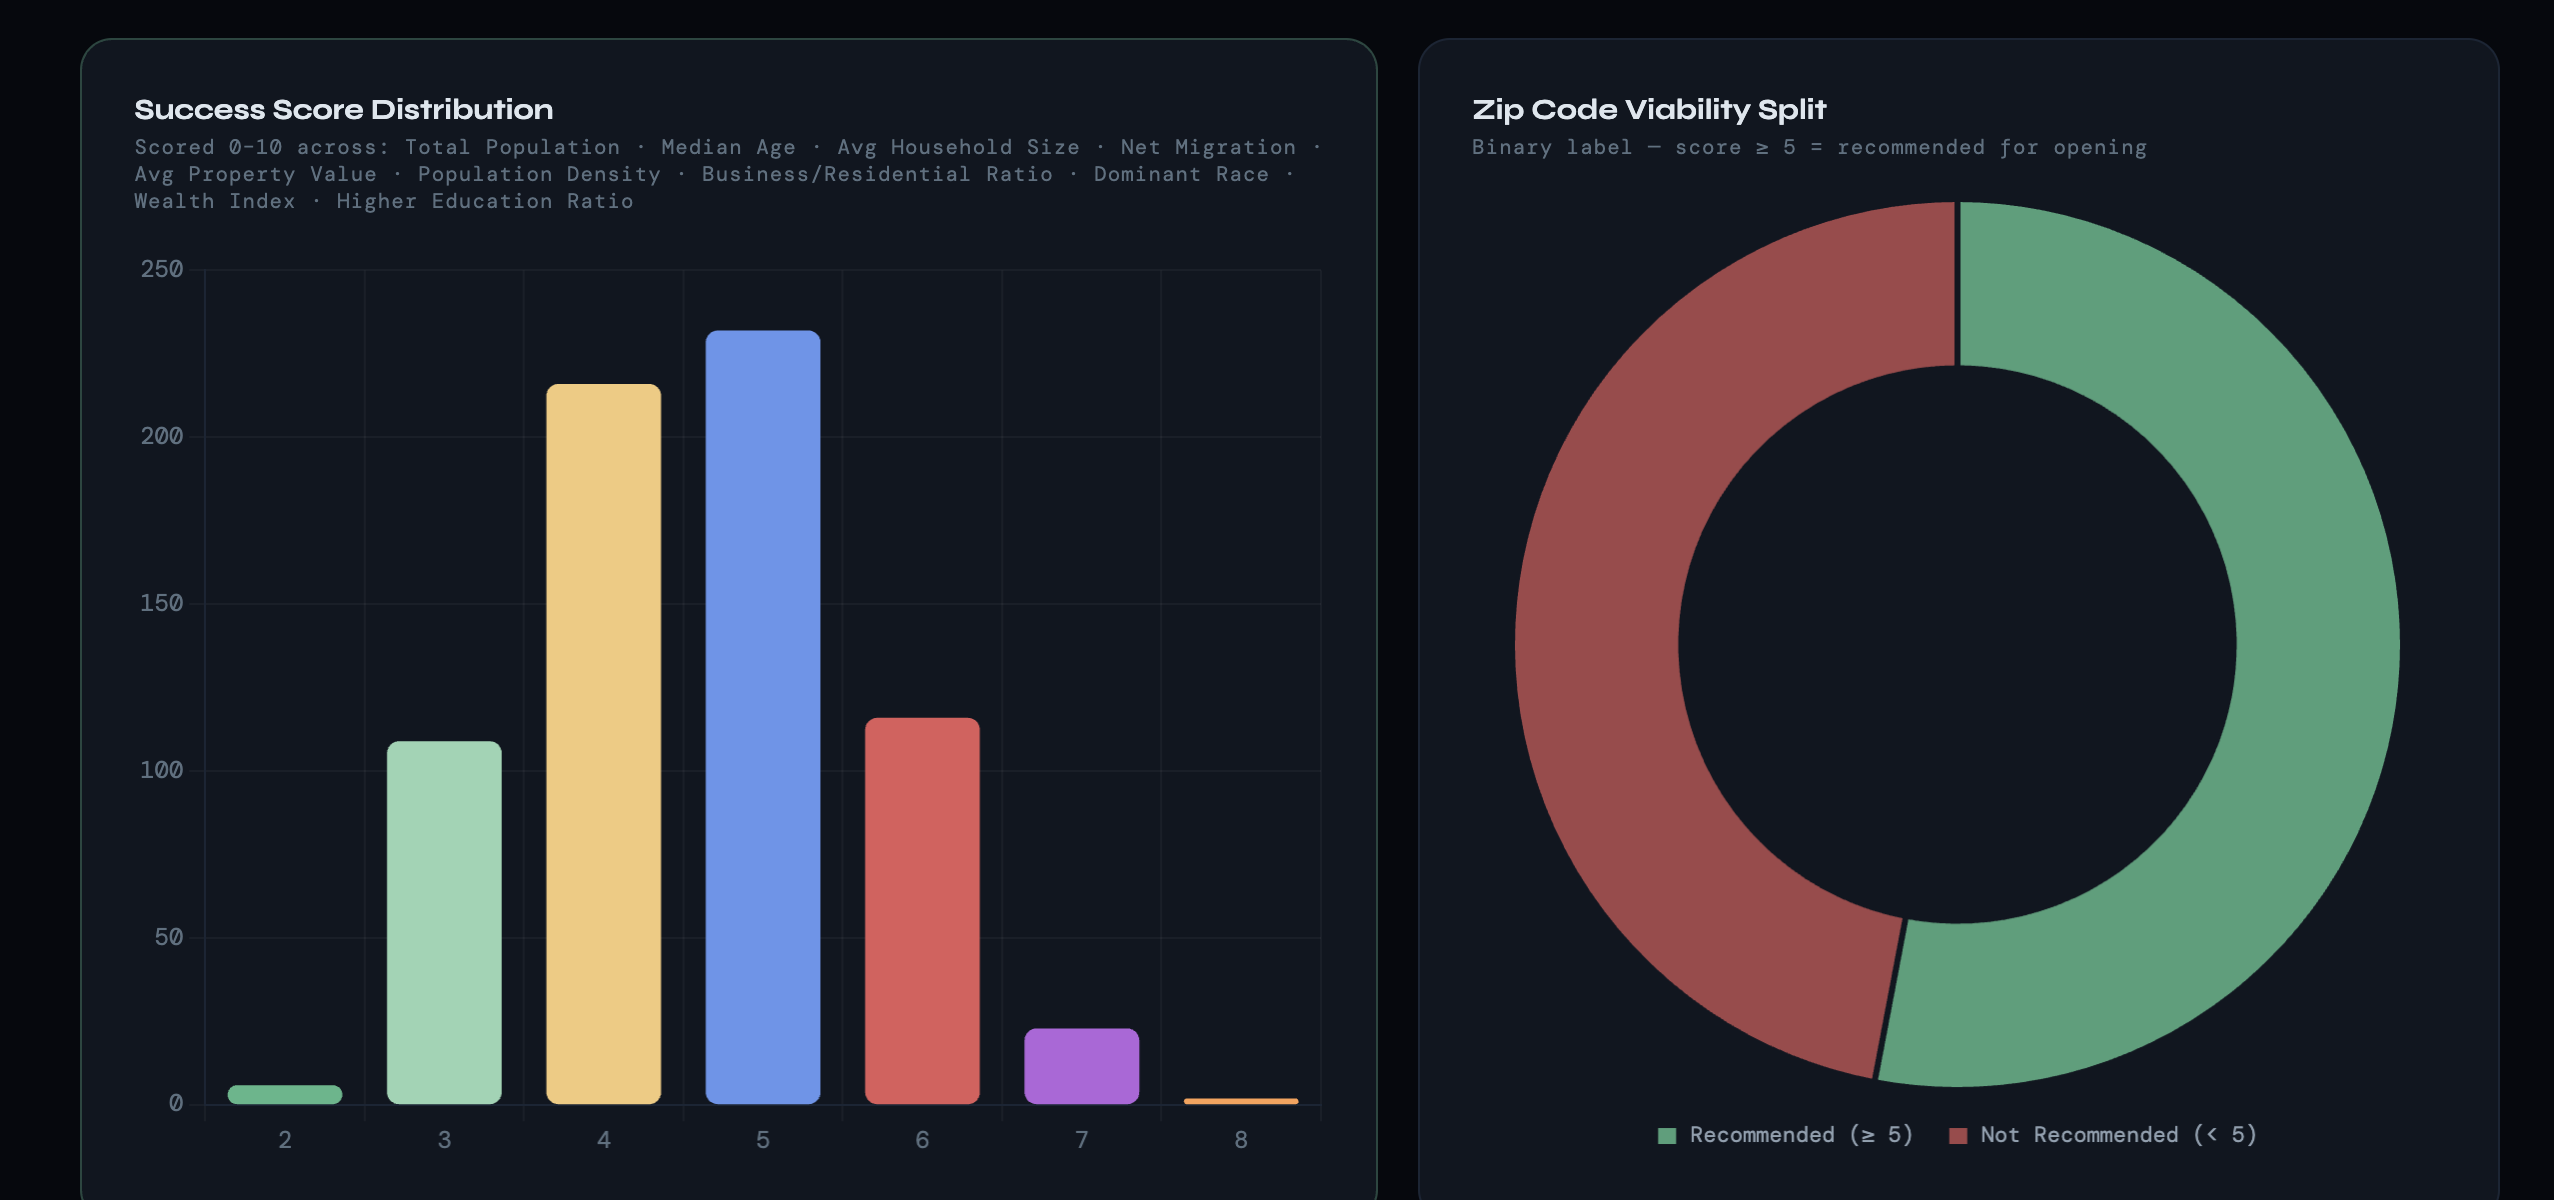
Our model predicts a 'Success Score' (on both a 0–10 and 0–100 scale) for specific restaurant locations. By processing ZIP-level demographic data, consumer interests, and population movement, the tool provides a quantitative forecast of how successful a restaurant is likely to be in a given area, allowing owners to compare potential sites before signing a lease.
How we built it
We built a Random Forest Regressor using Python and a variety of data science libraries, including pandas, numpy, and scikit-learn.
Challenges we ran into
One of the biggest hurdles was handling the vast amount of missing data across the datasets. For instance, several columns like StreetPreDirection were entirely empty and had to be dropped, while others required careful imputation to avoid biasing the model. Additionally, finding the right 'Success Score' balance was a challenge; our initial model was slightly conservative, tending to regress toward the mean rather than predicting extreme outliers.
Accomplishments that we're proud of
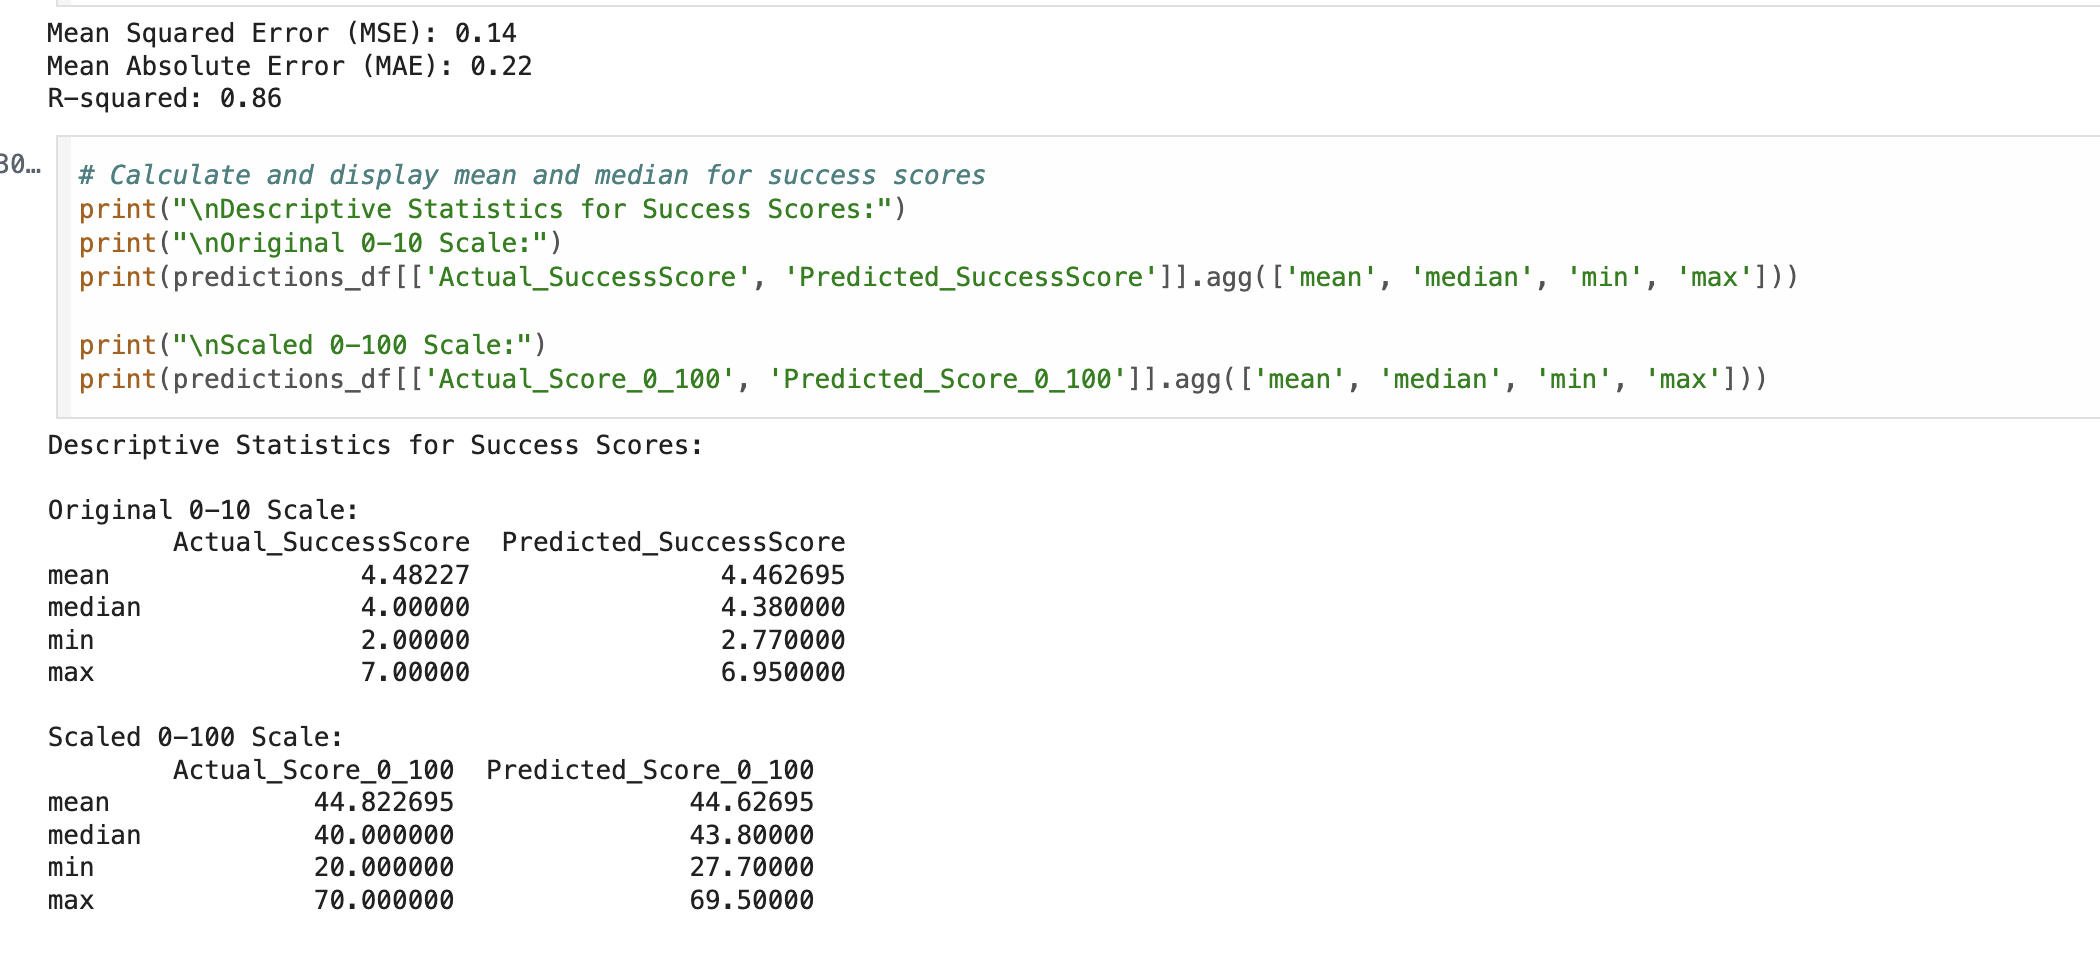
We are proud of the high level of accuracy our model achieved on average. Our Predicted Mean Success Score (4.46) came within 0.02 points of the Actual Mean (4.48). We also successfully engineered a pipeline that can take raw, messy ZIP and consumer data and transform it into a single, actionable success metric for business owners.
What we learned
We learned that population movement (NetMigration) is a powerful indicator of business potential—it isn't just about how many people live in a ZIP code, but whether that population is growing.

Log in or sign up for Devpost to join the conversation.