-
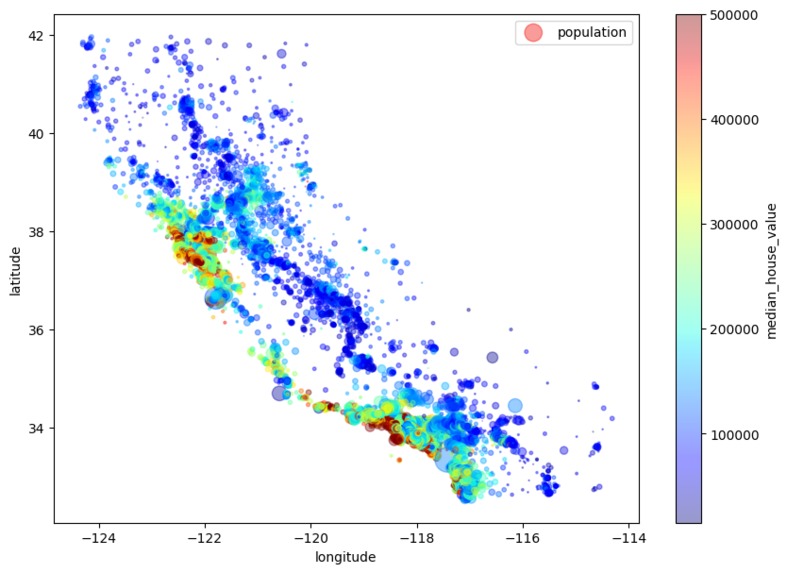
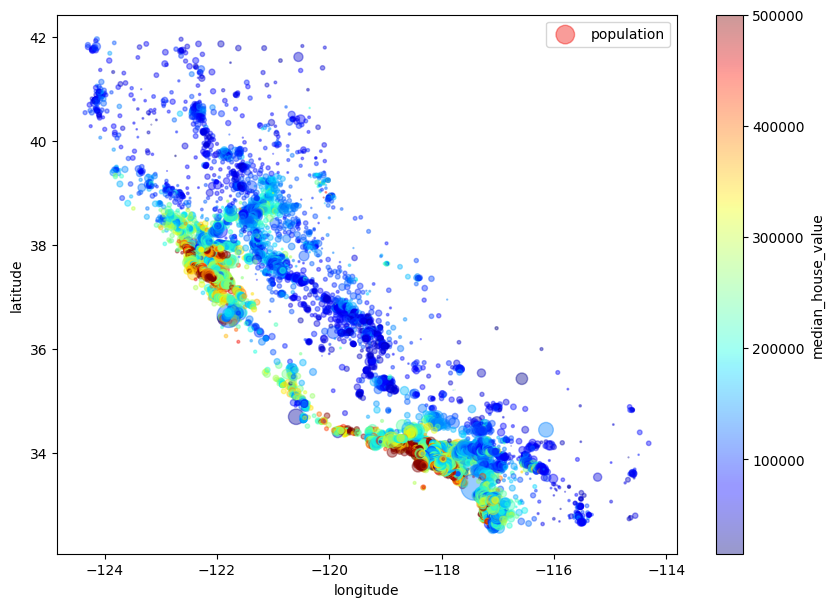
Jet-colored housing prices by location and population
-
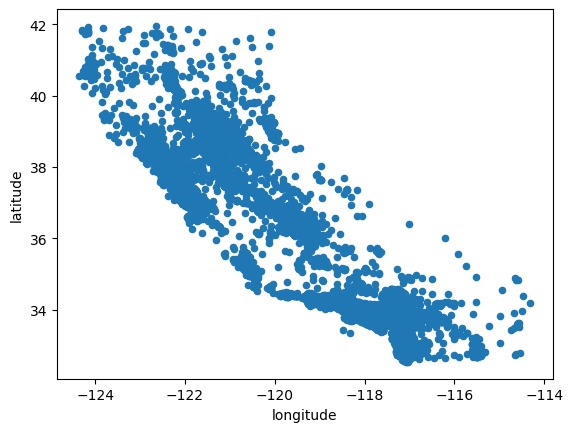
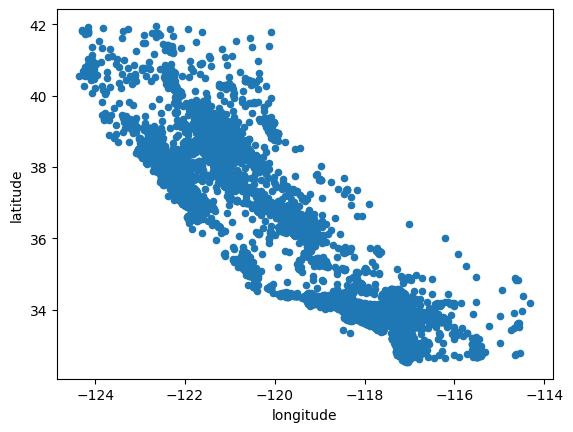
Geographical Plot
-
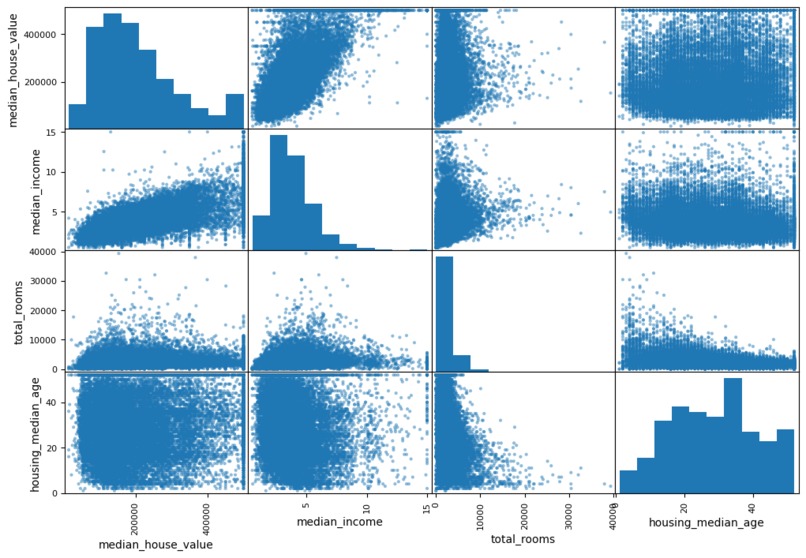
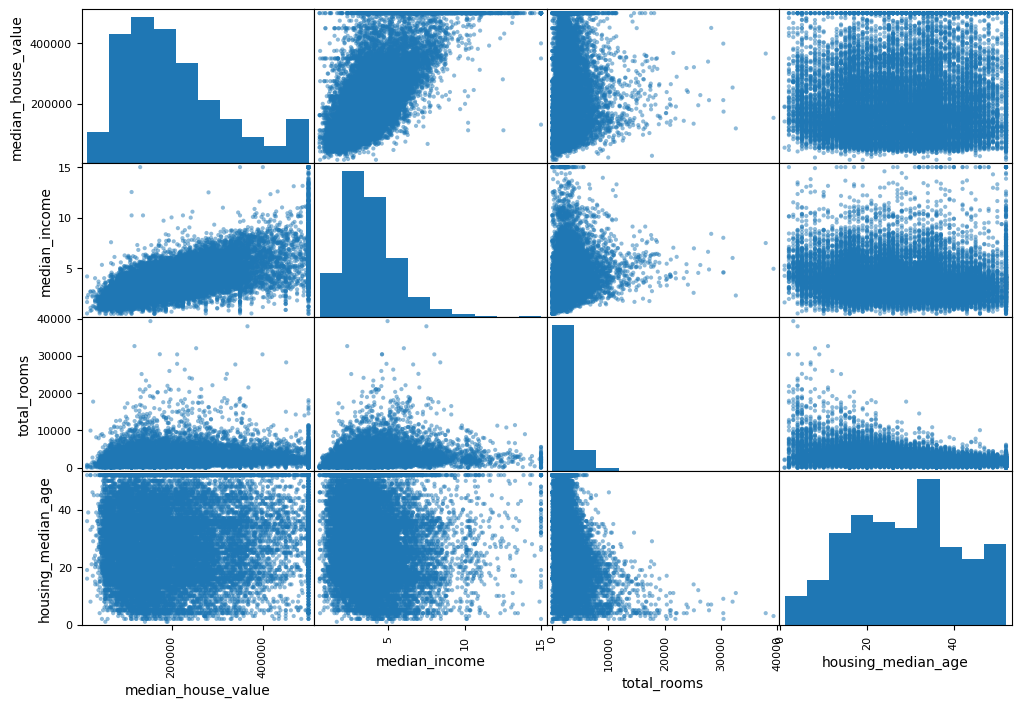
Pairplot: Every numerical feature against every other
-
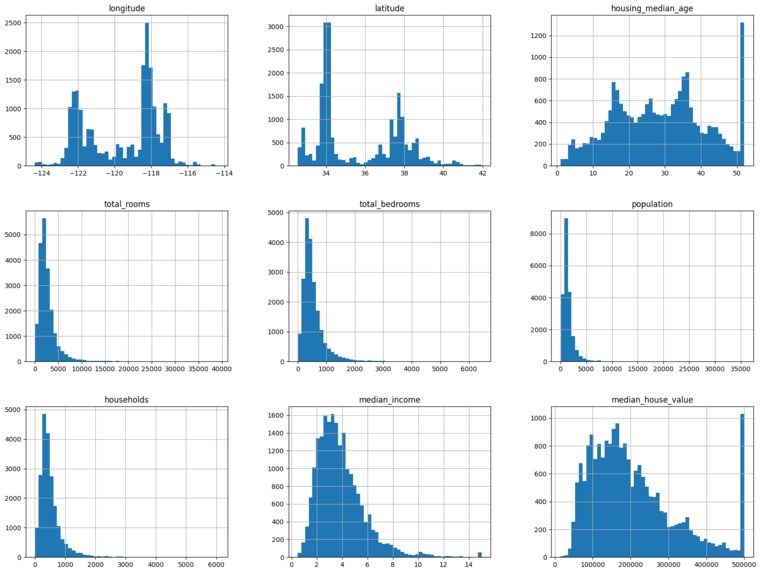
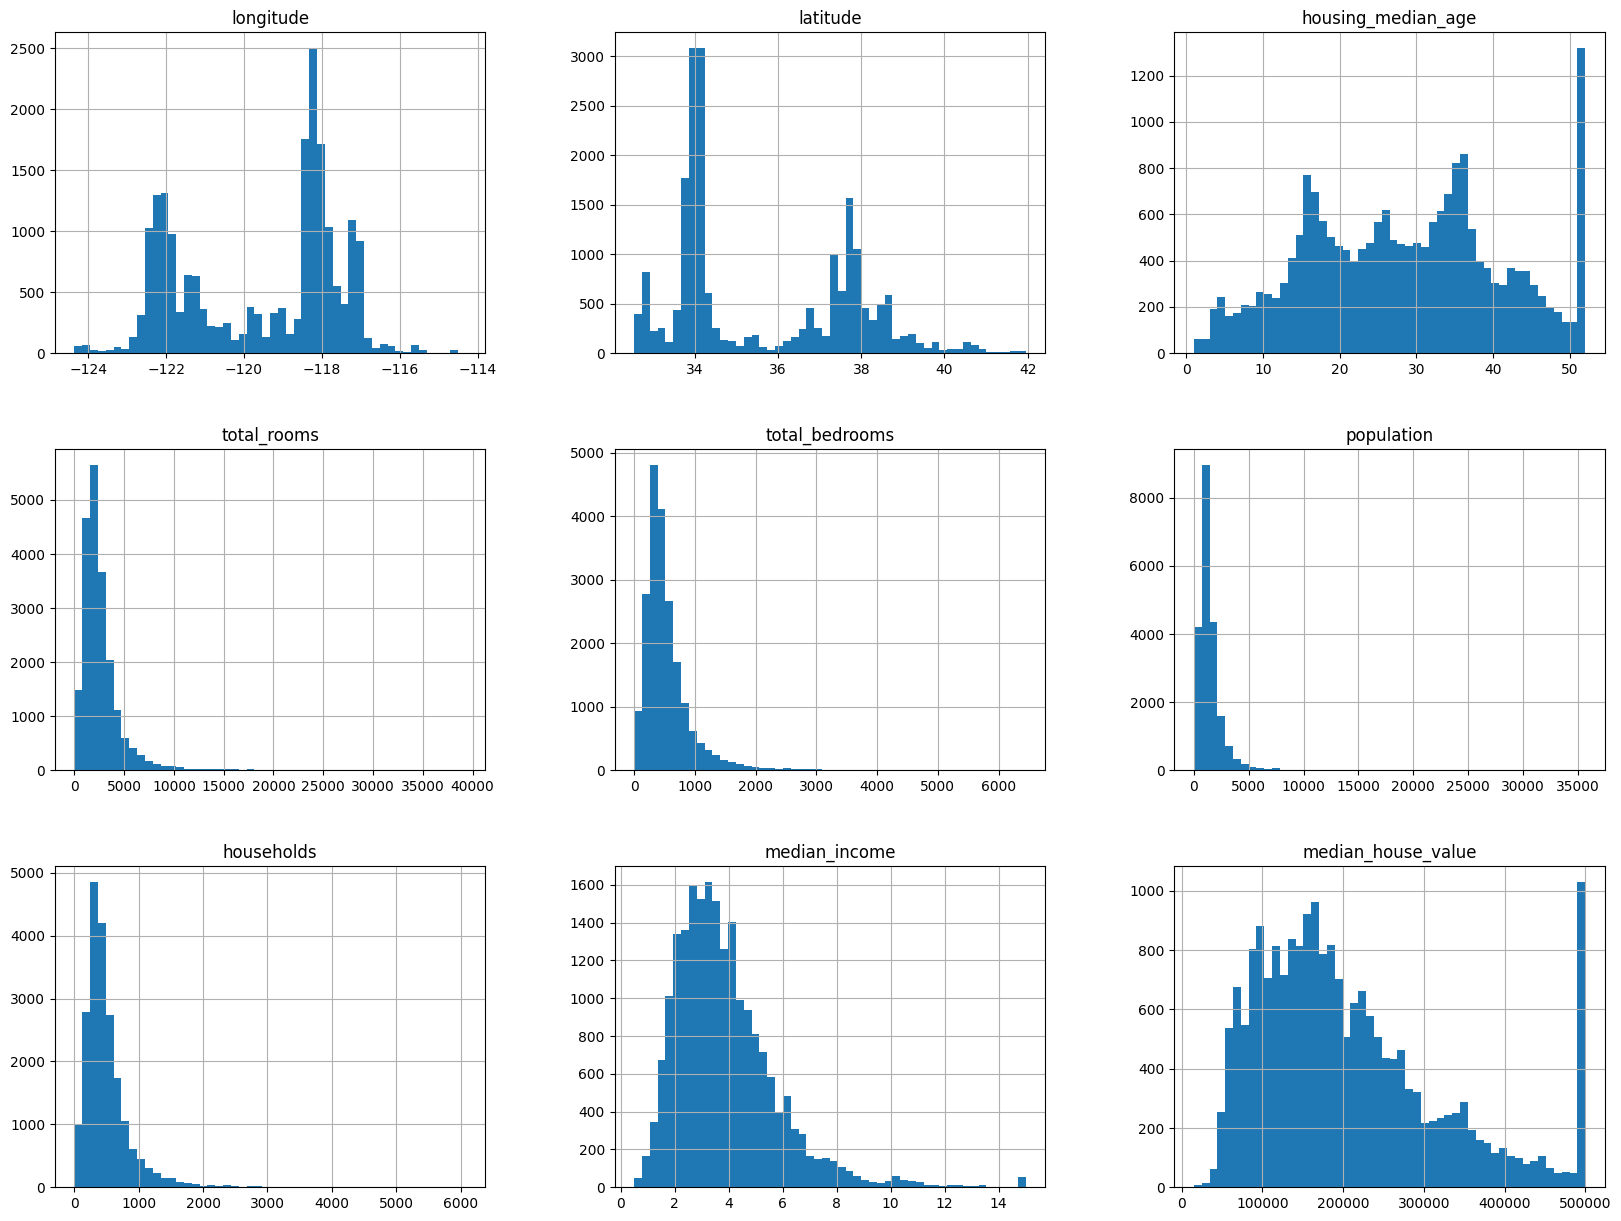
Histograms for each numerical feature
🏠 House Price Prediction API



A Machine Learning API for predicting California housing prices, inspired by Chapter 2 of Hands-On Machine Learning with Scikit-Learn, Keras, and TensorFlow by Aurélien Géron. This project walks through the full pipeline, from data preprocessing to prediction, exposed as a simple API using FastAPI.
📚 Project Overview
This API provides housing price predictions based on longitude, latitude, housing median age, total rooms, total bedrooms, population, households, median income, and ocean proximity. It encapsulates all the steps from the book’s chapter including:
- Data cleaning & transformation
- Custom feature engineering
- Model training using
RandomForestRegressor - Pipeline serialization using
joblib - And finally, exposing predictions via an API
🛠 Tech Stack
- Language: Python 3.12
- Framework: FastAPI
- ML Library: Scikit-learn
- Data Handling: Pandas, NumPy
- Visualization: Matplotlib
- Serialization: Joblib
⚙️ Installation
# Clone the repository
git clone https://github.com/aliiakbarkhan/house-price-prediction-api.git
cd house-price-prediction-api

# Create virtual environment (optional but recommended)
python -m venv venv
source venv/bin/activate  # on Linux/Mac
venv\Scripts\activate     # on Windows

# Install dependencies
pip install -r requirements.txt

# Run the API
uvicorn main:app --reload
🧪 How to Use the API
Once running, the API will be available at:
http://127.0.0.1:8000/docs
📥 Post / Predict
Send a JSON payload like:
{
  "longitude": -122.23,
  "latitude": 37.88,
  "housing_median_age": 41.0,
  "total_rooms": 880.0,
  "total_bedrooms": 129.0,
  "population": 322.0,
  "households": 126.0,
  "median_income": 8.3252,
  "ocean_proximity": "NEAR BAY"
}
📤 Response
{
  "prediction": 452100.0 (which is $4,52,100)
}
📊 Graphs and Visuals
| Plot Description | Image |
|---|---|
| Geographical Plot |  |
| Pairplot: Every numerical feature against every other |  |
| Histograms for each numerical feature |  |
| Jet-colored housing prices by location and population |  |
🧠 Model
- Algorithm Used: Random Forest Regressor.
- Data Source: California Housing Dataset.
- Feature Engineering: Custom transformer CombinedAttributesAdder for feature addition.
- Evaluation Metrics: RMSE (Root Mean Squared Error).
📁 Project Structure
├── datasets                 # Datasets Folder
├── graphs                 # Visual Graphs Folder
├── notebooks                  # Jupyter Notebook Folder
├── main.py                  # FastAPI app file
├── custom_transformers.py  # Building Pipeline file
├── model.pkl               # Trained RandomForest model
├── pipeline.pkl            # Full preprocessing + model pipeline
├── requirements.txt        # Project dependencies
└── README.md               # Project documentation
🧪 Development & Learning Source
This project is inspired by the practical walkthrough in Chapter 2 of Hands-On Machine Learning with Scikit-Learn, Keras, and TensorFlow by Aurélien Géron.
👨💻 Author
- Ali Akbar Khan
- Email: [email protected]
- LinkedIn: aliakbar-khan
➕ Additional Features
- This project goes beyond the textbook by converting the model into a real-world FastAPI-based API.
🔒 License
https://github.com/user-attachments/assets/af7a9530-cbef-4cb4-8f47-7d2a0691824d
Built With
- jupyter-notebook
- python
