-
-
Main
-
CubeRaman
-
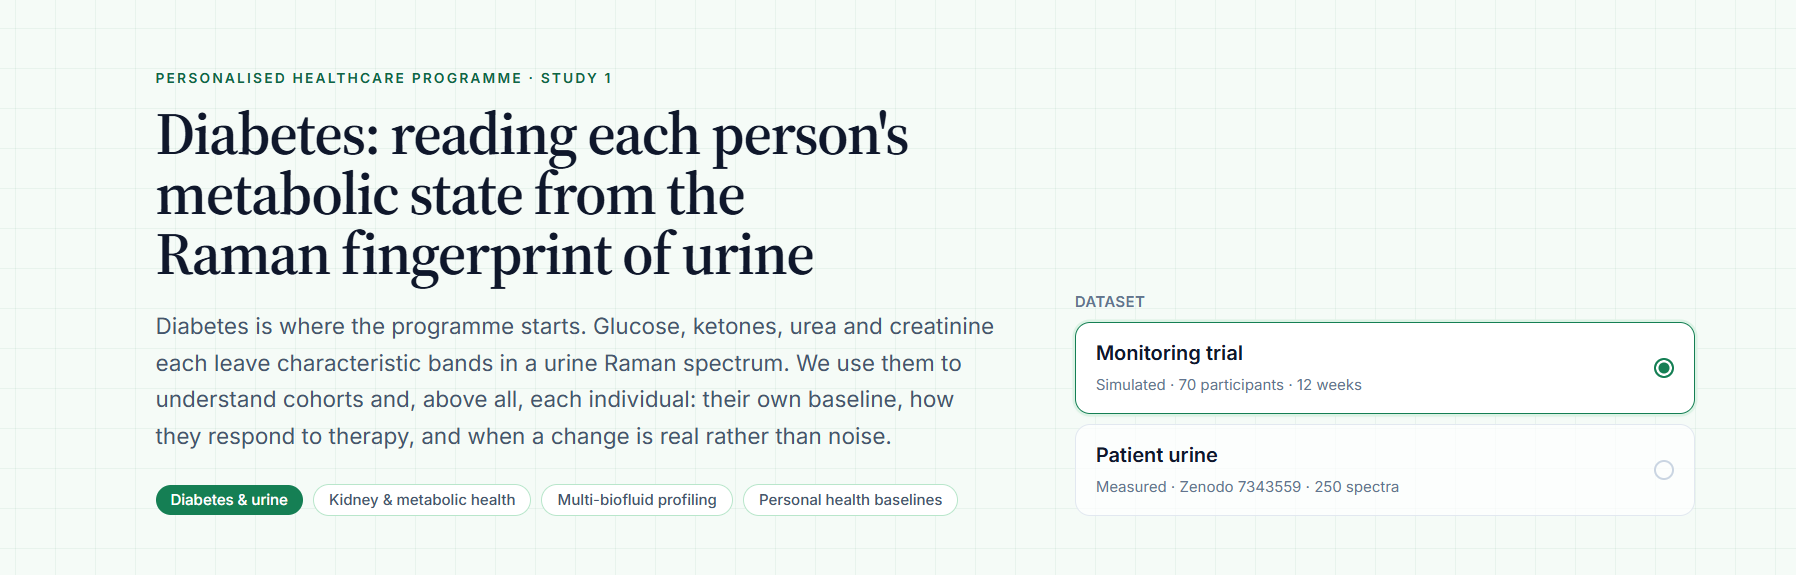
Study: Diabetes
-
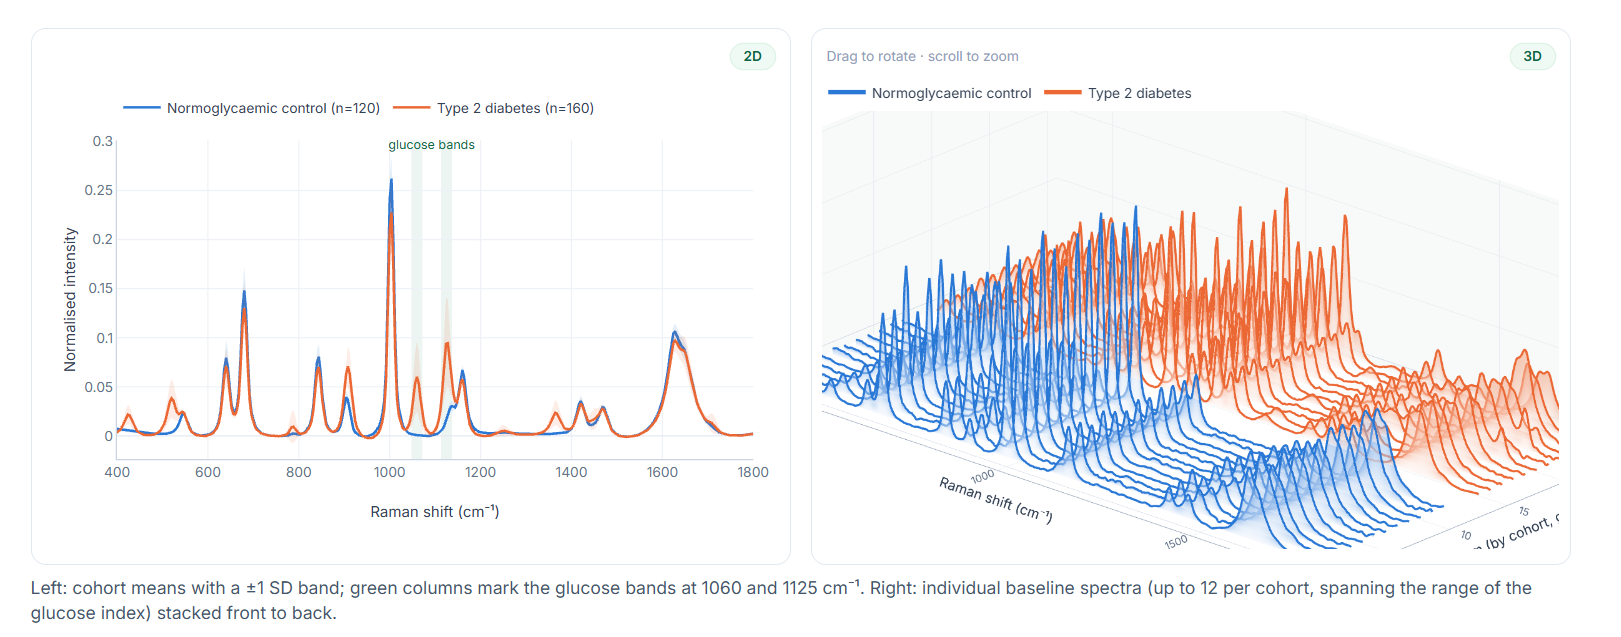
Visual interpretation of the data
-
Analysis
-
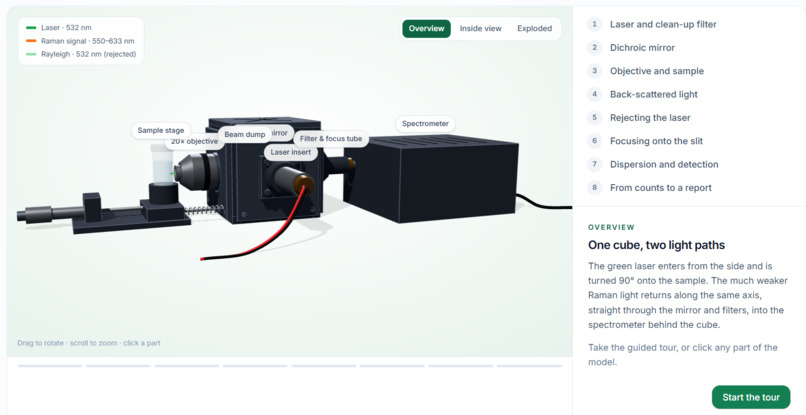
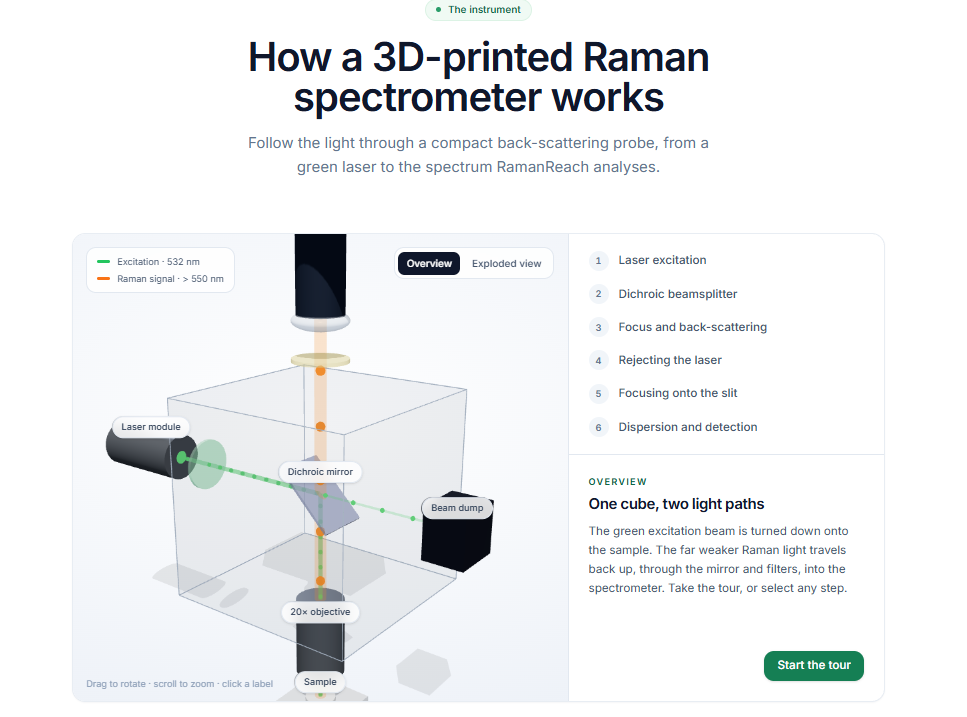
Raman Spectrometer
Inspiration
Scientific data can hold valuable insights, but those insights are often difficult to access without specialized equipment, technical expertise, and experience interpreting complex measurements. Raman spectroscopy offers a way to study molecular composition, yet turning its spectral outputs into reliable, understandable information remains a challenge.
RamanReach was inspired by a simple question: What if understanding complex molecular data did not require every user to be a spectroscopy expert?
I wanted to build a platform that bridges scientific measurement and human understanding. With a long-term interest in AI, mathematics, and healthcare, I began exploring how computational analysis could make molecular spectroscopy more accessible to researchers and, eventually, support validated healthcare applications.
What it does
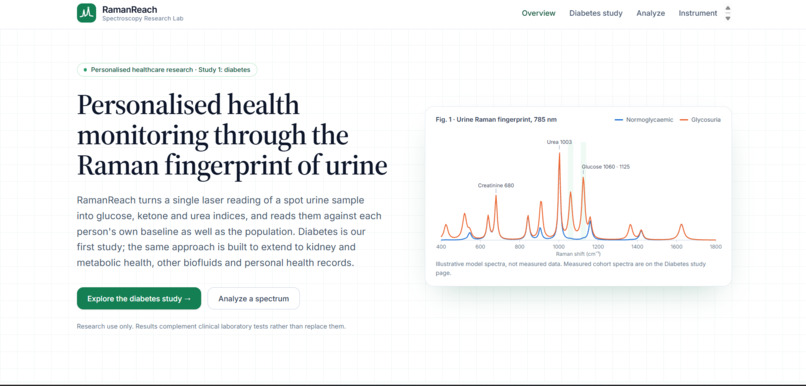
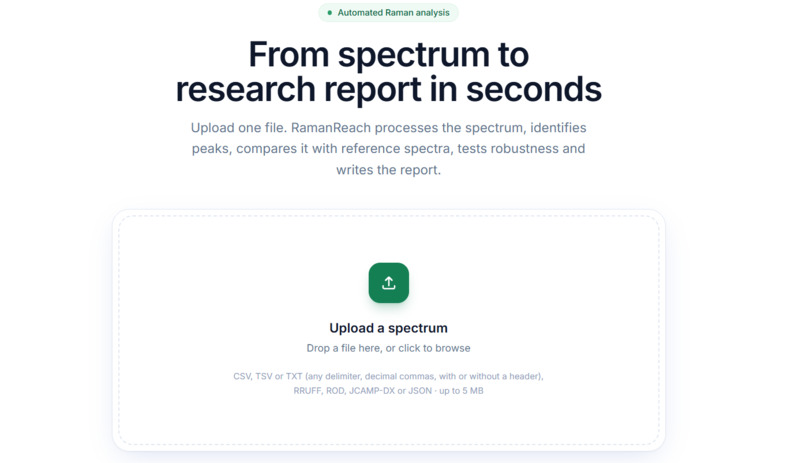
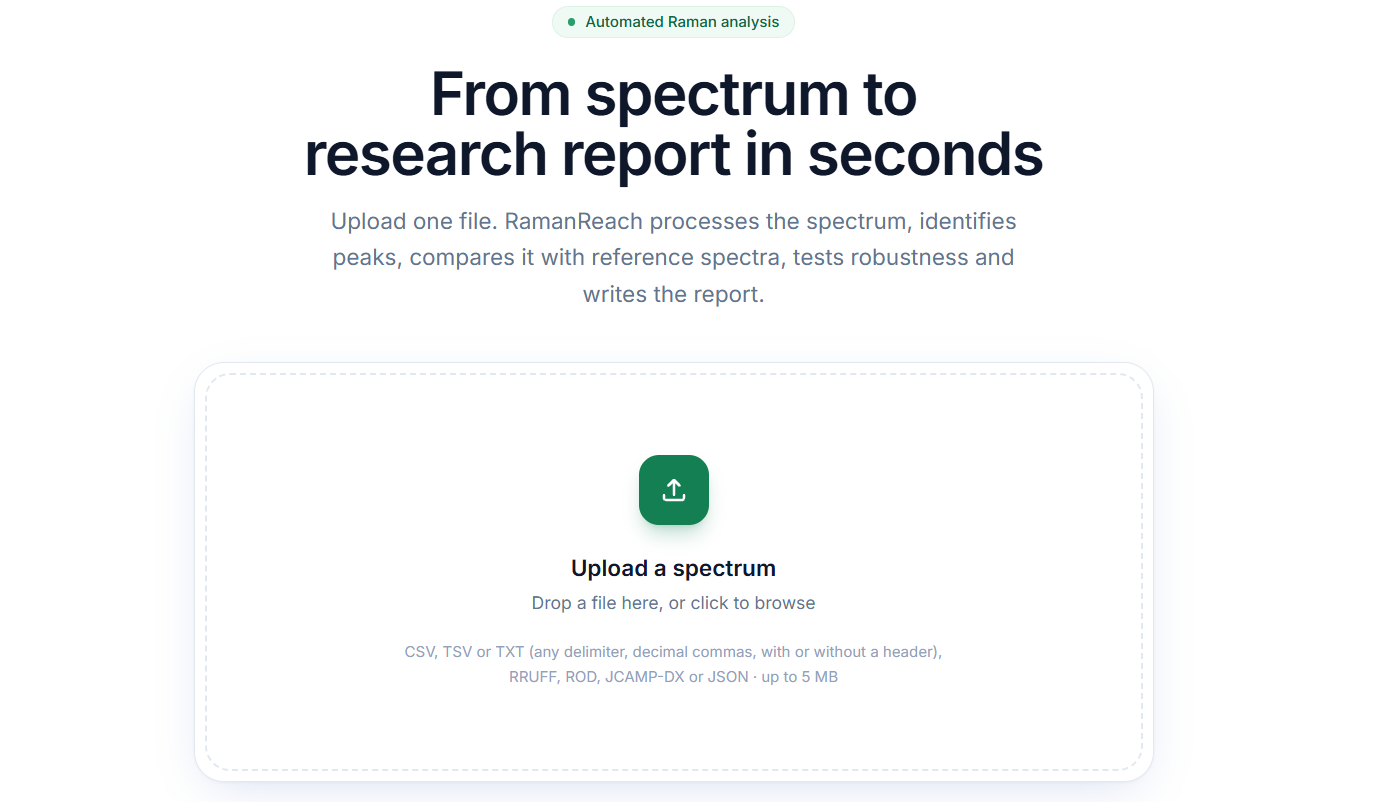
RamanReach is an interactive Raman spectroscopy analysis platform that transforms uploaded spectral data into a structured, understandable report.
It validates input data, processes spectra, detects peaks, compares measurements against available reference spectra, and evaluates data quality. It also incorporates experimental-condition checks, wavenumber sensitivity analysis, PCA, model benchmarking, and spectral translation evaluation when the necessary data are available.
Rather than simply presenting graphs and numerical scores, RamanReach aims to explain what the results indicate, how reliable the analysis may be, and where uncertainty remains.
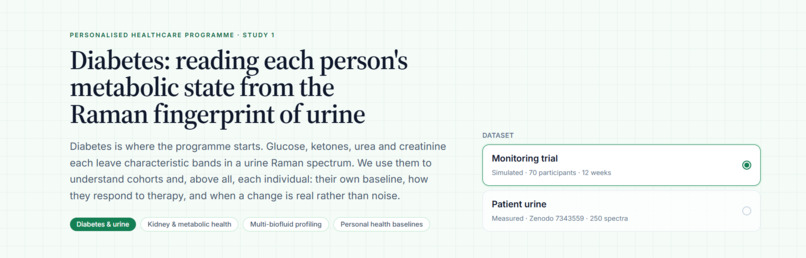
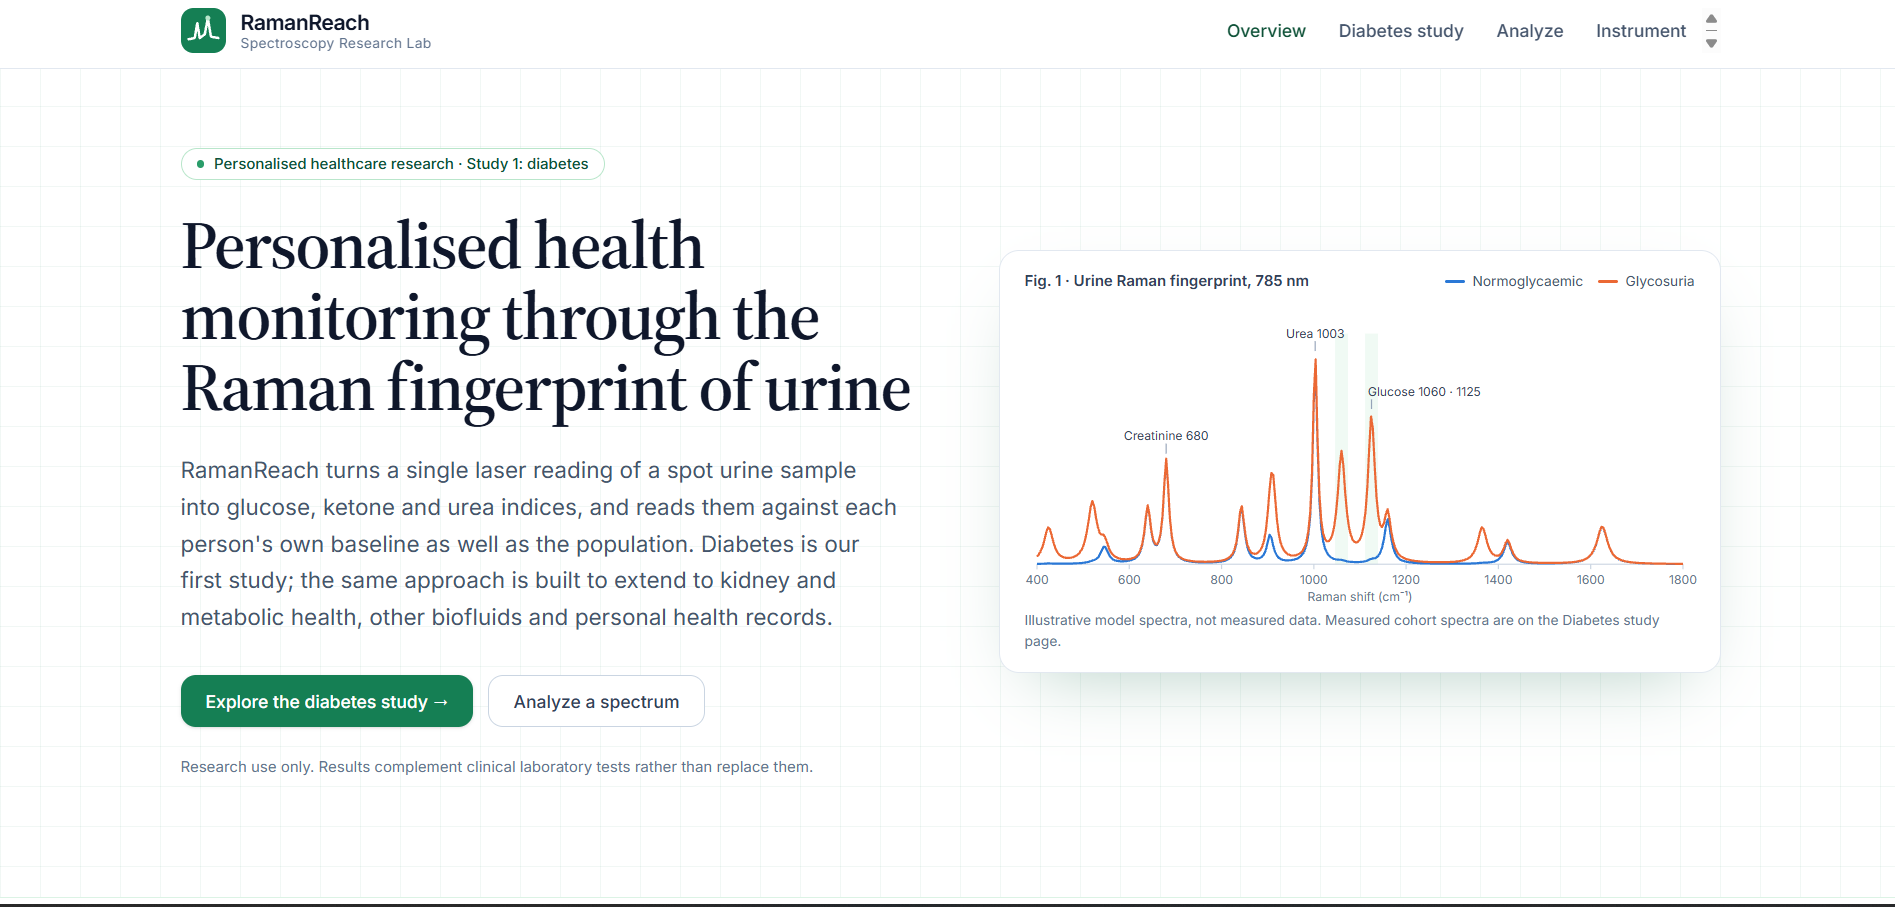
Our long-term vision is to explore how accessible molecular analysis could contribute to personalized healthcare research. RamanReach is not currently a medical diagnostic tool; any healthcare application would require dedicated experimental and clinical validation.
How we built it
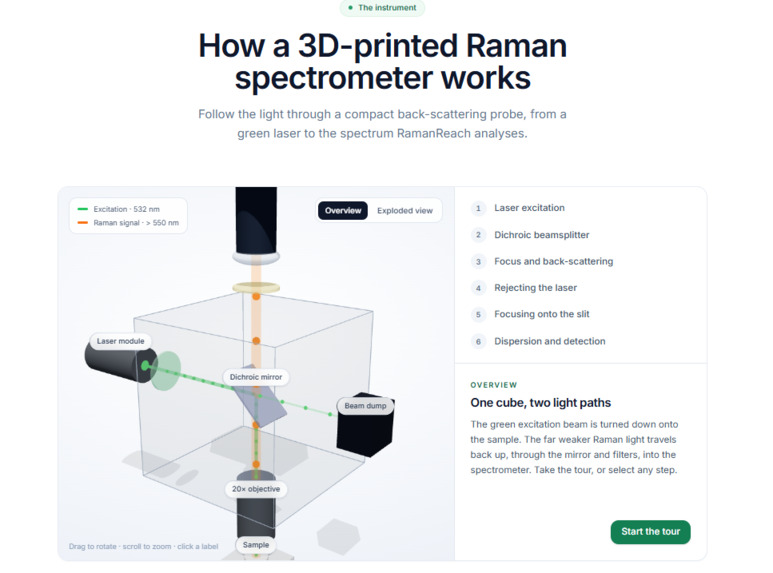
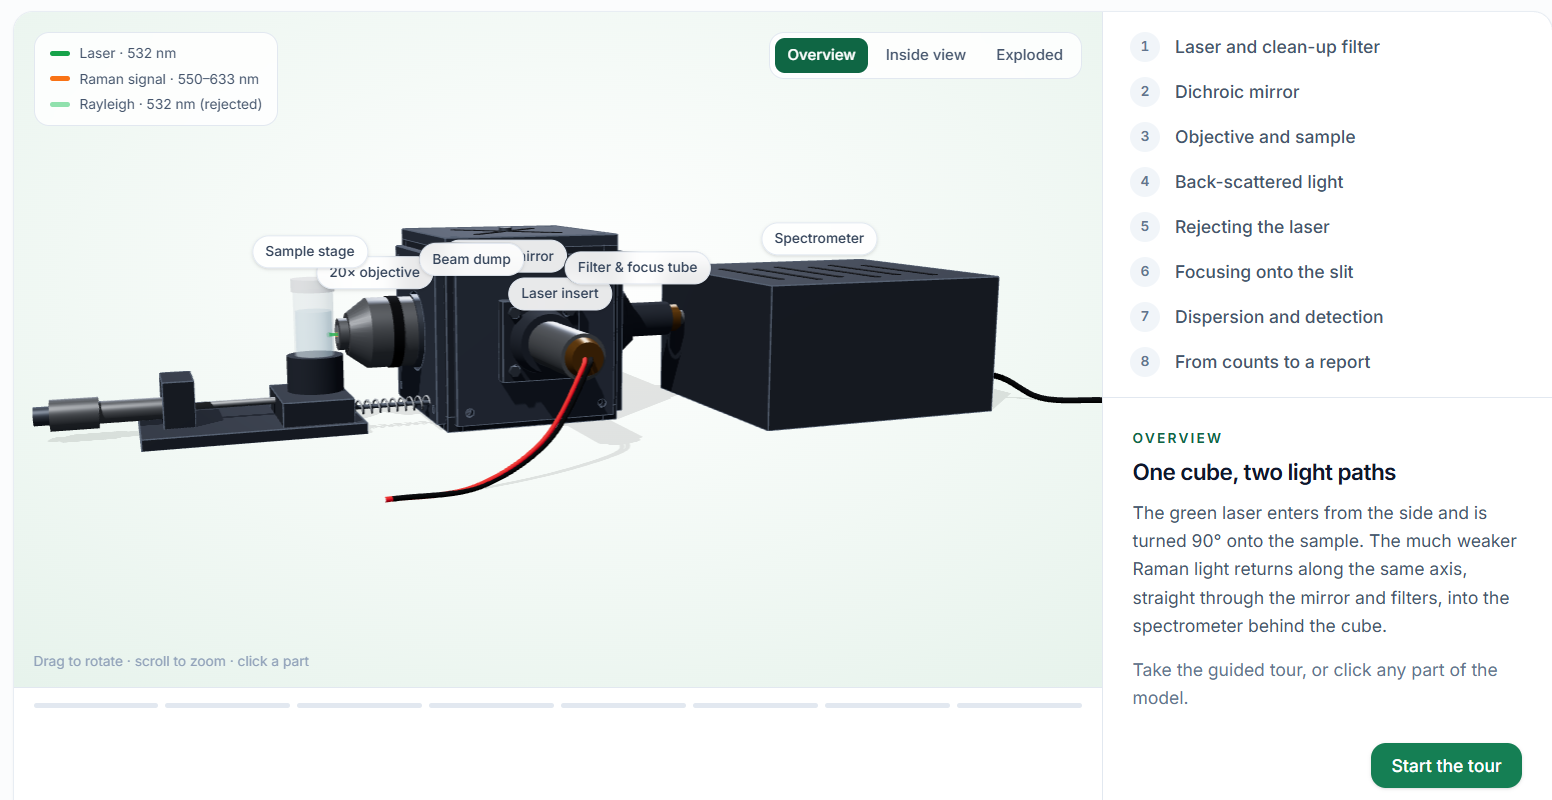
We built RamanReach as a full-stack scientific computing application, combining a modern web interface with a Python-based analysis backend.
- React and TypeScript power the interactive frontend, spectrum visualizations, and unified analysis experience.
- Python and FastAPI handle backend processing and analysis endpoints.
- Scientific signal processing supports baseline correction, smoothing, peak detection, spectral alignment, and reference matching.
- Data analysis and machine learning support PCA, sensitivity experiments, and model-evaluation workflows.
- Automated reporting combines applicable analyses, visualizations, quality warnings, and plain-language explanations in one report.
We also generated synthetic spectra to test different scenarios, including clean signals, noisy measurements, baseline drift, shifted spectral axes, and overlapping peaks. These datasets help us test the software's behavior, while remaining clearly distinguished from real experimental measurements.
Challenges we ran into
One of our biggest challenges was making the analysis scientifically responsible. A high similarity score does not prove a material's identity, and variations in noise, preprocessing, spectral alignment, and experimental conditions can affect the results.
Another challenge was integrating multiple analytical methods into a single workflow. PCA requires multiple spectra, model benchmarking requires appropriately labelled datasets and independent evaluation, and spectral translation generally requires paired source and target measurements. The application must recognize when these requirements are not met instead of generating misleading results.
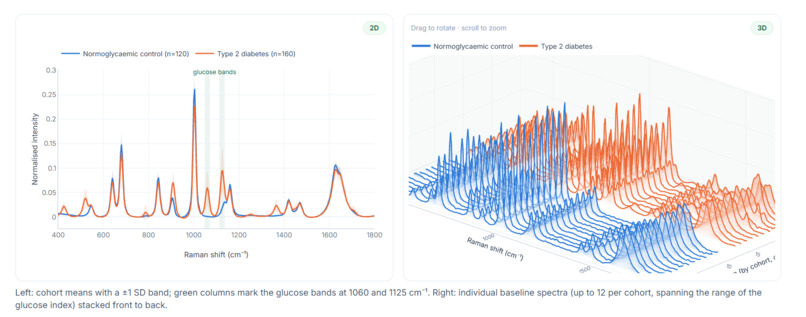
We also focused on making scientific outputs understandable to non-specialists. This meant moving beyond raw metrics toward clear explanations, visual representations, quality indicators, and explicit limitations.
Accomplishments we're proud of
We built a working application that brings multiple spectroscopy analysis capabilities into one workflow and generates a structured report from uploaded spectral data.
We are particularly proud of the emphasis on transparency: the application can identify when additional data are required, distinguish synthetic test data from real measurements, and communicate limitations instead of treating every result as conclusive.
RamanReach represents a foundation we can extend as we integrate real datasets and evaluate the scientific performance of its methods.
What we learned
We learned that scientific AI is not just about building a model or producing a convincing visualization. Data quality, reproducibility, appropriate validation, uncertainty, and understandable communication are equally important.
We also learned to distinguish successful software execution from scientific validity. Synthetic datasets are useful for testing an application, but real measurements and independent validation are essential before making claims about real-world performance.
What's next for RamanReach
Our next steps are to expand support for raw instrument data, integrate well-documented public Raman datasets, improve evaluation on independent real spectra, and strengthen the application's evidence-based explanations.
We also want to investigate a specific, measurable healthcare research application in collaboration with appropriate scientific and clinical partners. That would require standardized sample collection, trusted reference measurements, suitable ethical oversight, and rigorous validation before the results could inform healthcare decisions.
RamanReach is our step toward making complex molecular science more accessible helping people understand not only what scientific data show, but also what they cannot yet prove.
Built With
- data-preprocessing
- data-quality
- data-visualization
- fastapi
- machine-learning
- numpy
- pandas
- peak-detection
- principal-component-analysis-(pca)
- python
- raman-spectroscopy
- react
- rest-api
- scientific-computing
- scientific-research
- scipy
- signal-processing
- spectral-analysis
- typescript
- web


Log in or sign up for Devpost to join the conversation.