-
-
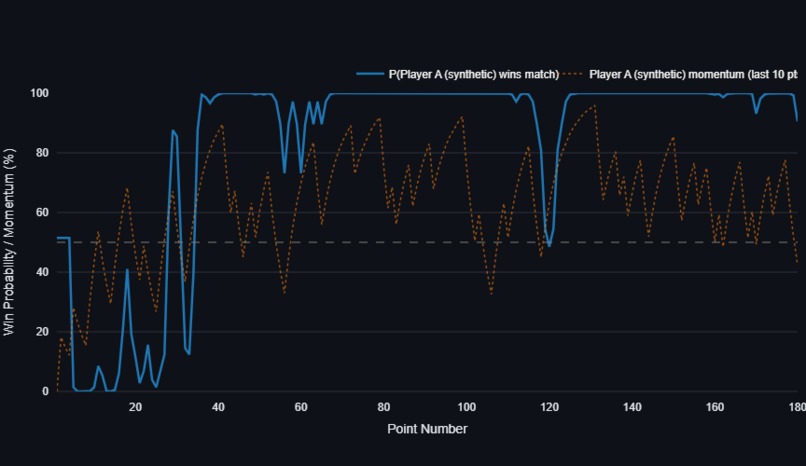
overall view
-
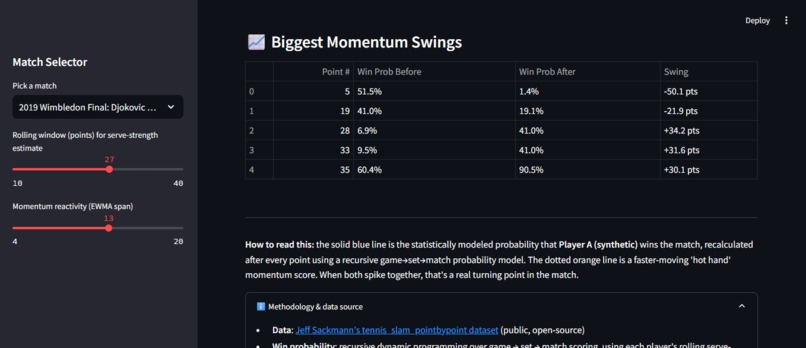
Biggest Momentum Swings
-
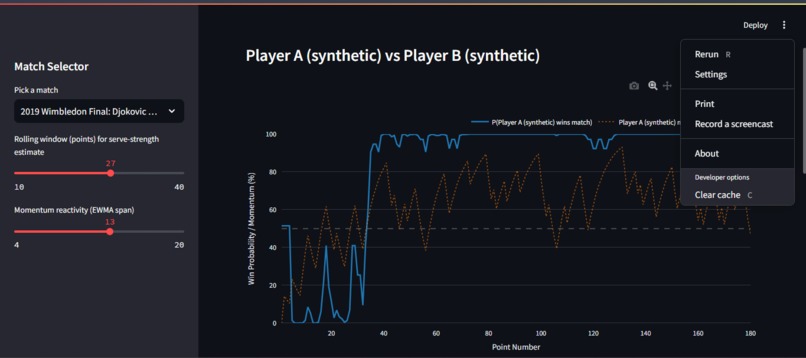
options
-
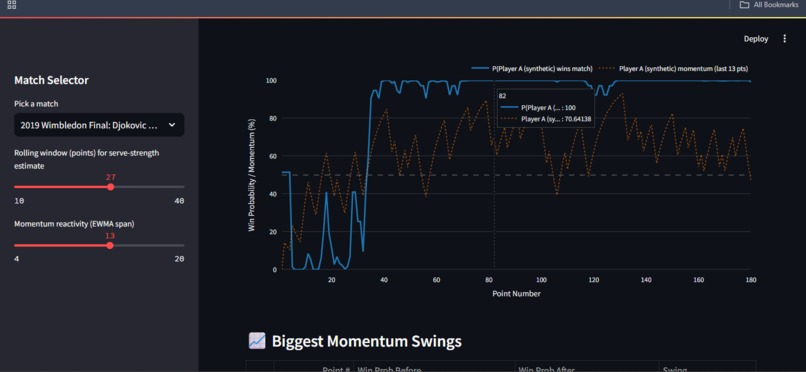
sidebar
-
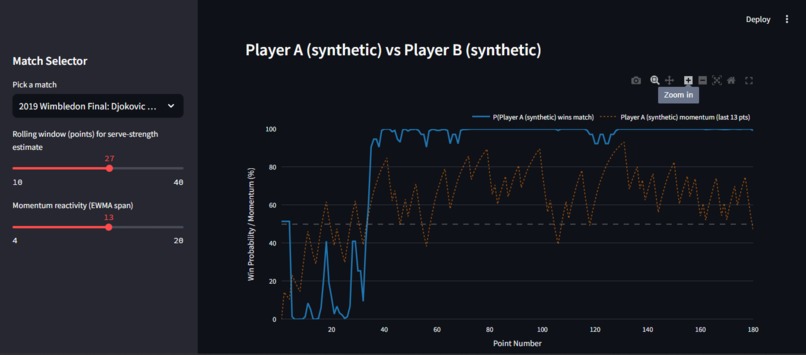
graph
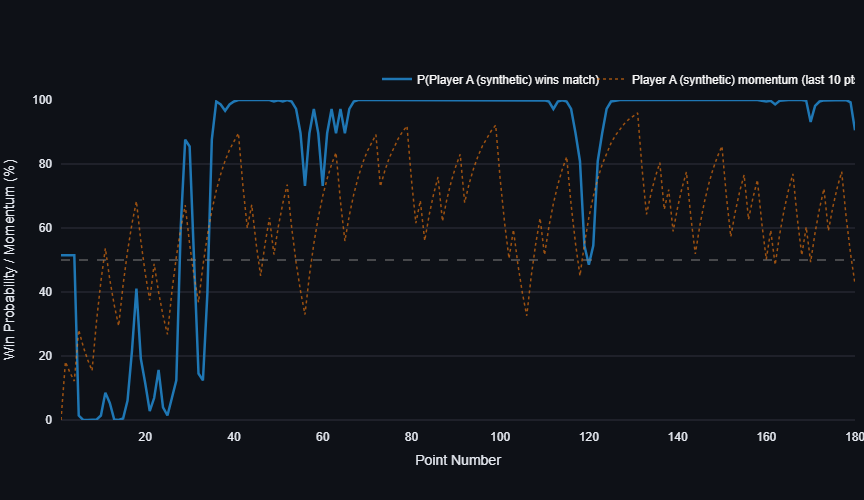
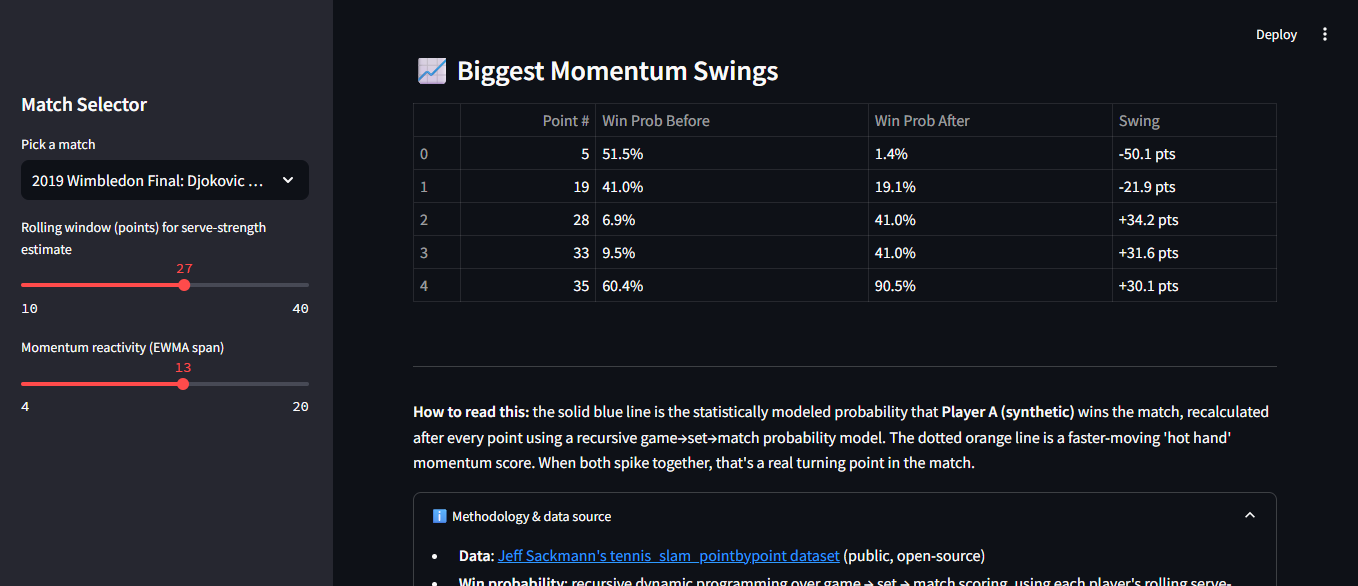
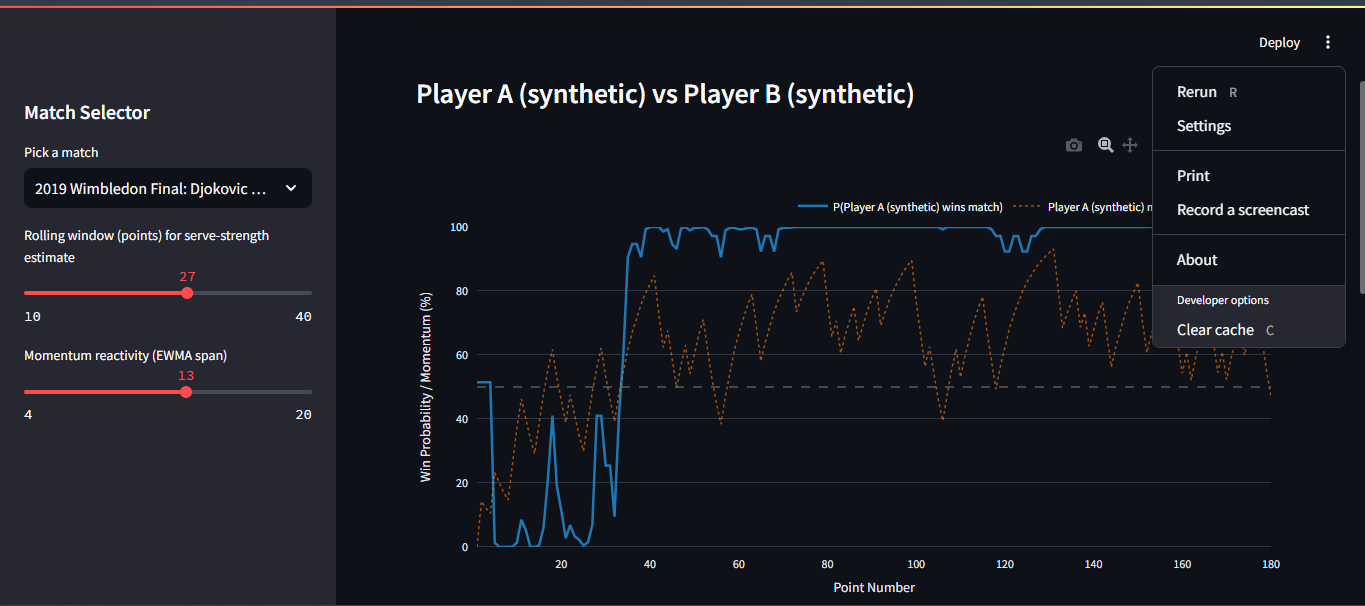
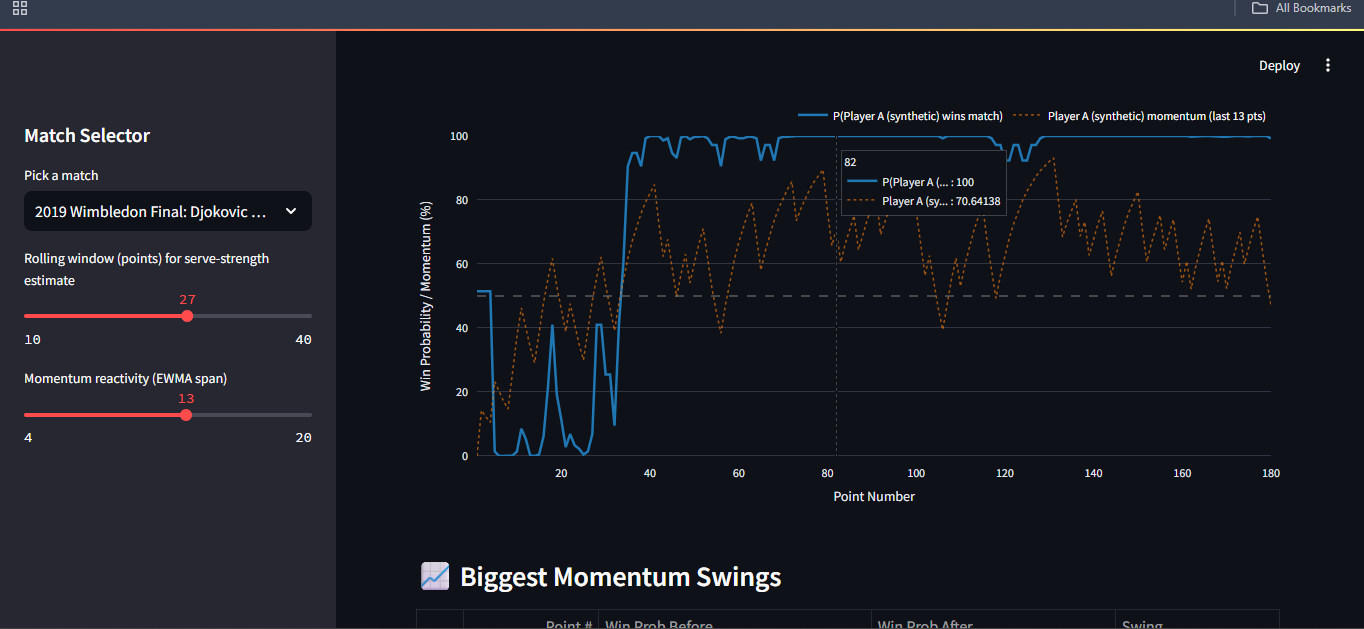
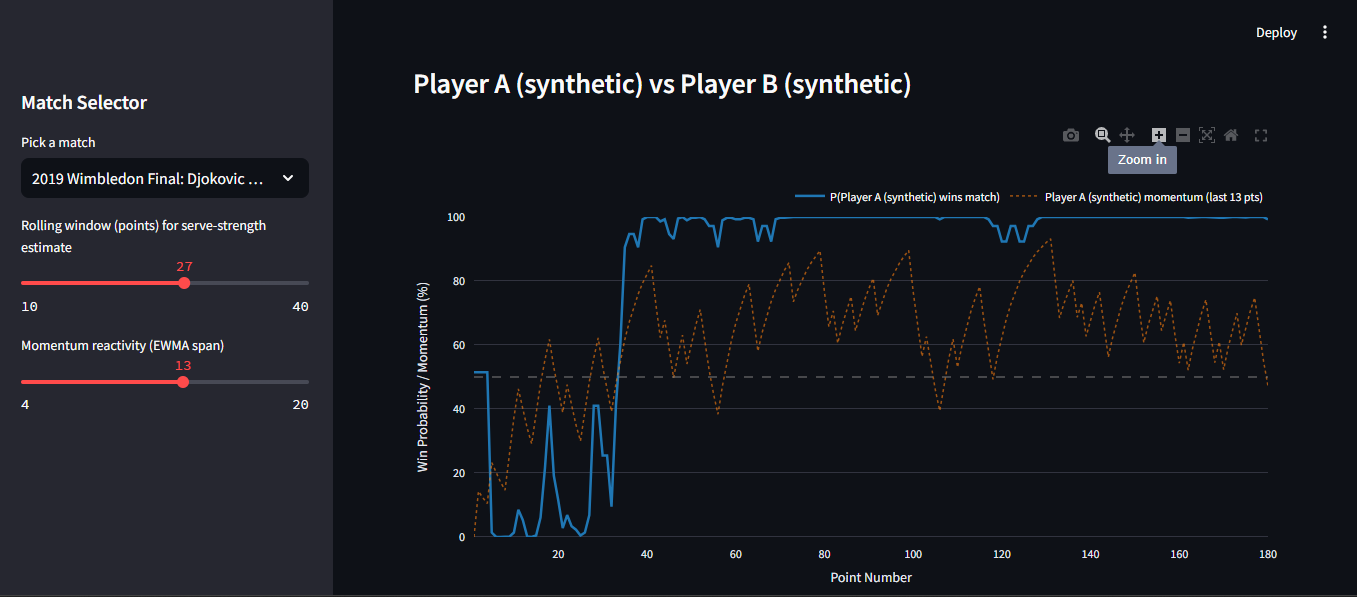
Every tennis broadcast talks about "momentum" — commentators say a player "has it" or "lost it" after a big point — but unlike baseball or football, tennis broadcasts almost never show a real win-probability graph. We wanted to build the tool that turns "momentum" from a broadcaster's buzzword into an actual, measurable number, point by point, using real Grand Slam match data.
RallyIQ takes real point-by-point data from historic Grand Slam matches and, after every single point, calculates:
- Win Probability — the statistical chance a player wins the match right now, based on a recursive game → set → match probability model (the same technique real sports-analytics win probability tools use).
- Momentum Score — a faster-reacting "hot hand" metric that tracks short-term streaks, separate from the long-run win probability.
Both are plotted on an interactive chart so you can watch a famous match unfold and see exactly where the turning points were — like the moment a player saved three break points and their win probability jumped from 40% to 65%.
The win probability engine is built from first principles using dynamic programming:
prob_win_game(p, a, b)computes the probability of winning a game from any point score, handling deuce/advantage with a closed-form formula.prob_win_tiebreak(...)extends this to 7-point tiebreaks.prob_win_set(...)combines game probabilities across a full set.prob_win_match(...)combines set probabilities into a full match win probability for best-of-3 or best-of-5 formats.
Each player's serve-win probability is estimated live from a rolling window of their own recent points, so the model adapts as the match progresses rather than using static career averages.
Point-by-point data comes from Jeff Sackmann's open-source
tennis_slam_pointbypoint dataset. The frontend is a Streamlit dashboard
with Plotly for the interactive win-probability chart.
The trickiest part was the tiebreak probability calculation — a naive recursive implementation could recurse indefinitely on tied scores deep into extra points (imagine 15-15 in a tiebreak), so we had to add a safety cutoff that resolves to whoever's currently ahead once the tiebreak goes deep enough that the exact math becomes computationally impractical (and vanishingly rare in real matches).
We also had to decide how to combine set-level probabilities into a match-level one. We assume set outcomes are independent given each set's win probability — a standard simplification in public win-probability models — and we say so explicitly, because the momentum score is designed to catch exactly the cross-set momentum effects that assumption misses.
Turning something as fuzzy as "momentum" into a real number forced us to be precise about what we were actually measuring — and made clear that "who's ahead on the scoreboard" and "who's likely to win" are often two different questions.
- Extend the model to badminton, where point-by-point data is scarcer but the same math applies.
- Add player-specific priors (career serve-win rates) instead of only using in-match rolling estimates, so early-match predictions are more stable.
- Build a "clutch index" that scores players on how often they convert high-pressure points into real win-probability swings.
Built With
- numpy
- pandas
- plotly
- python
- scikit-learn
- streamlit


Log in or sign up for Devpost to join the conversation.