-
-
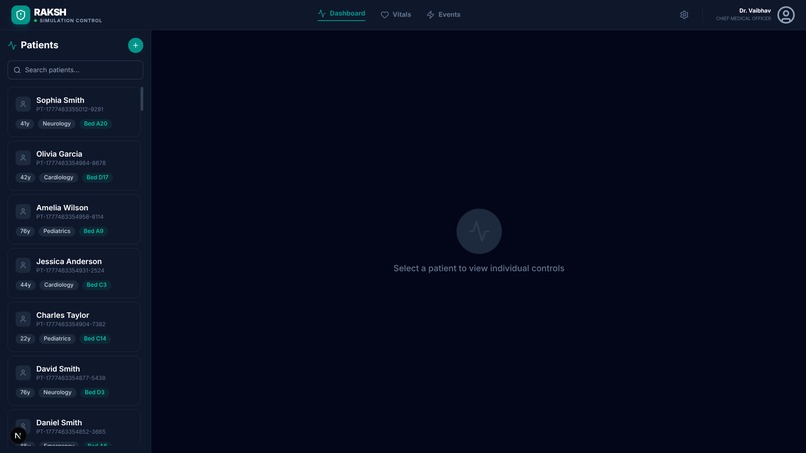
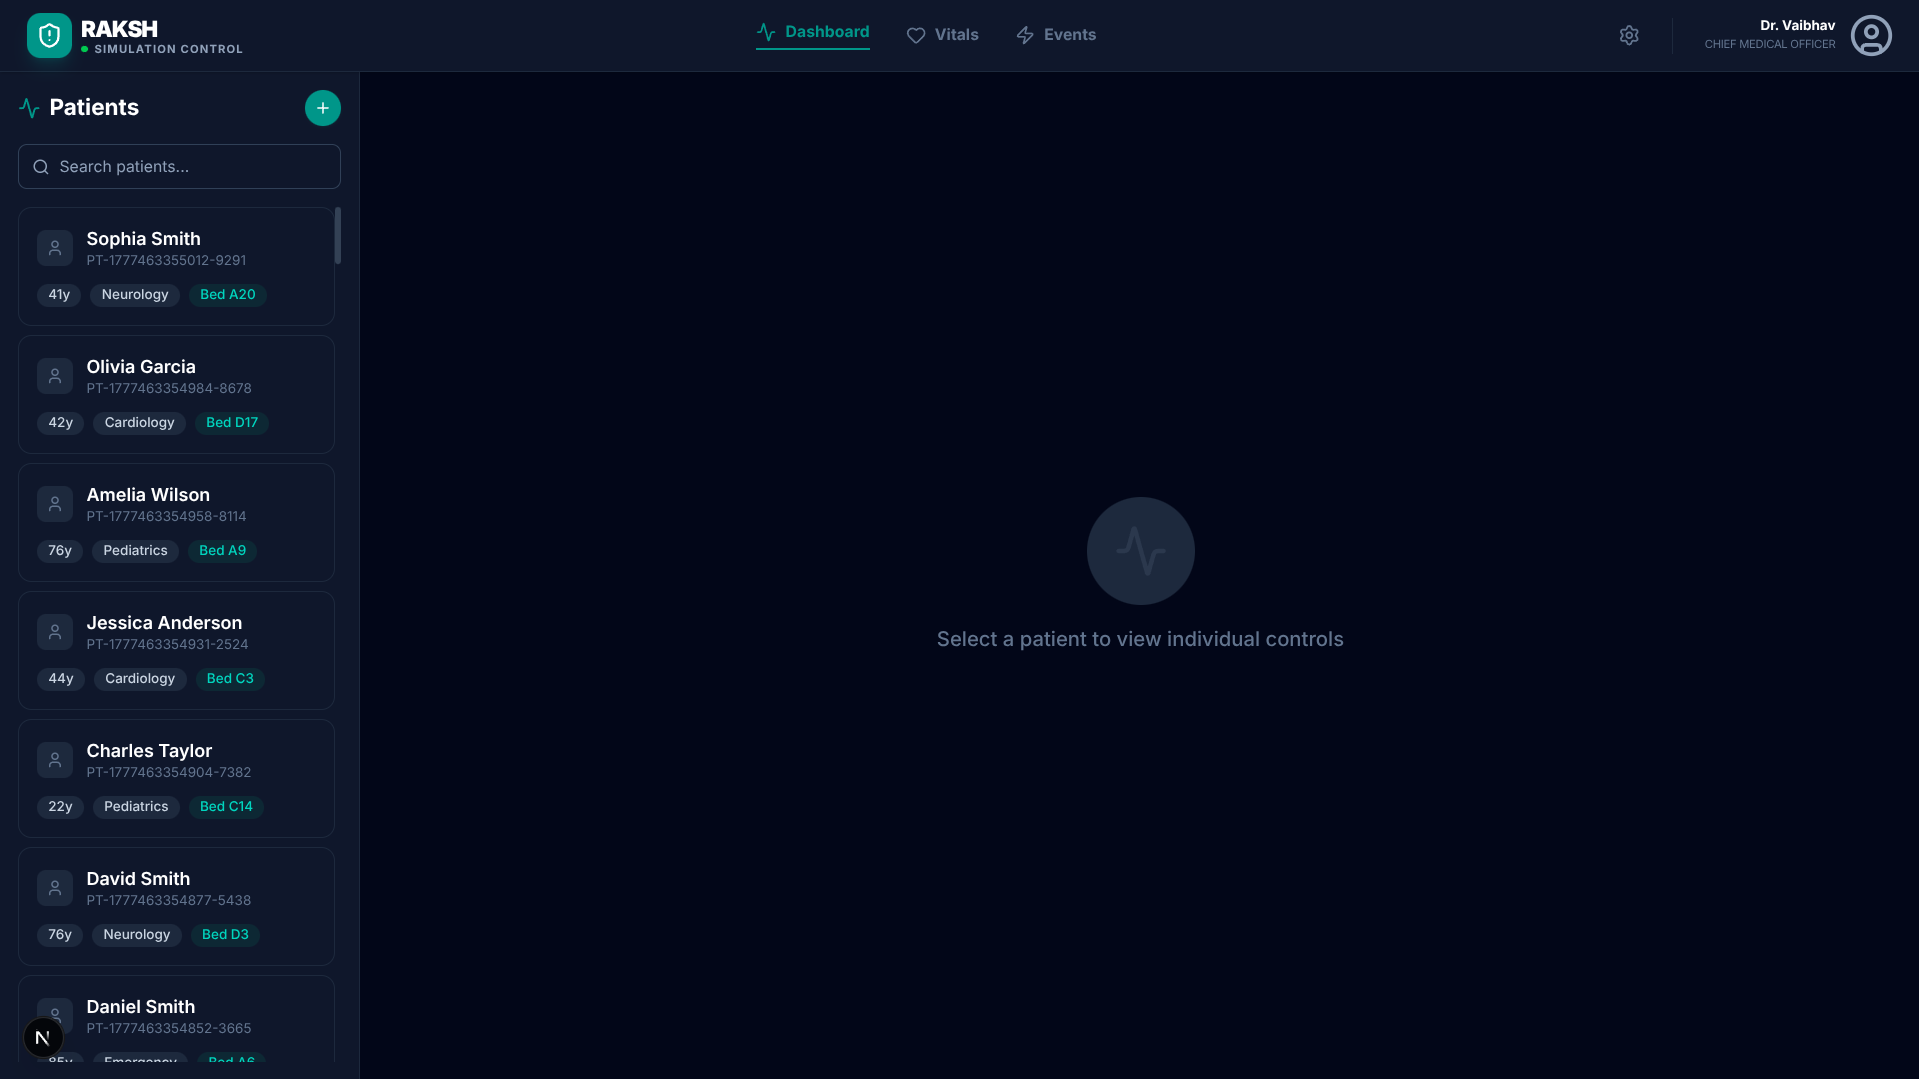
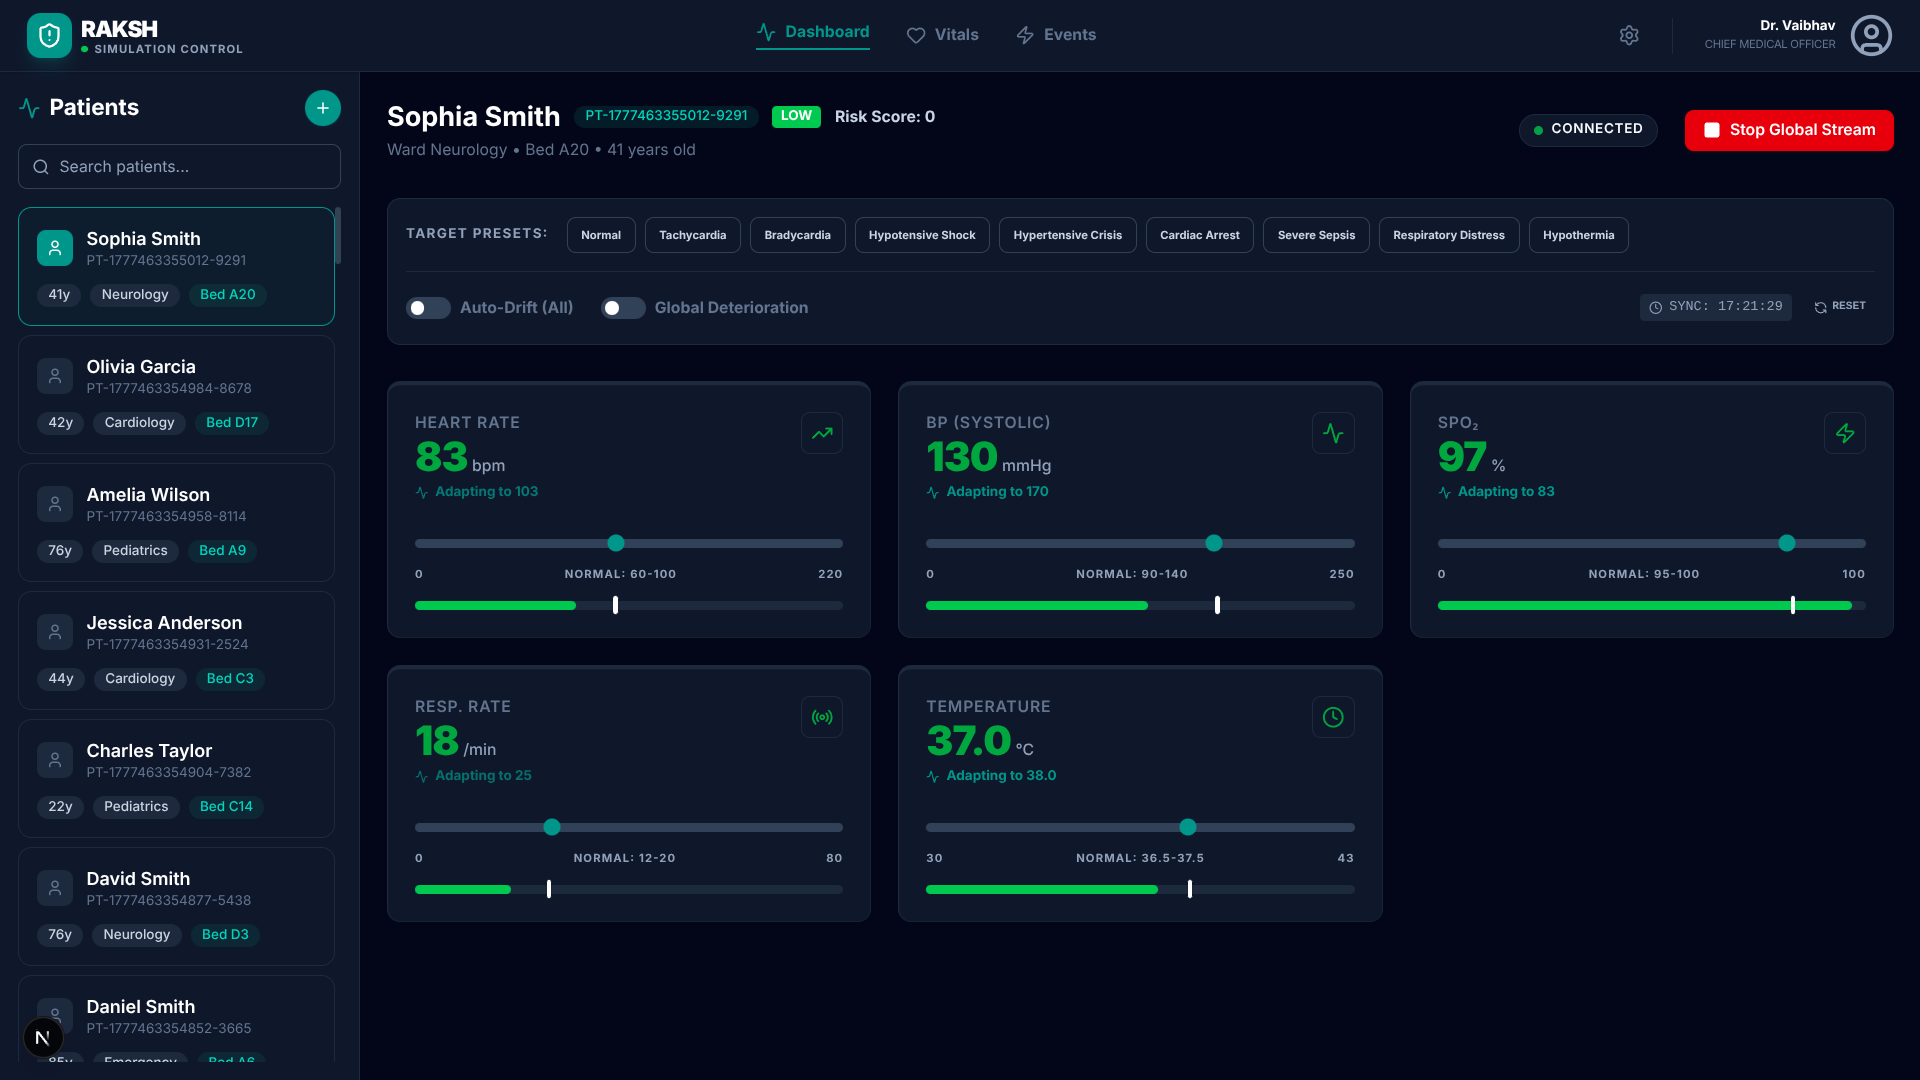
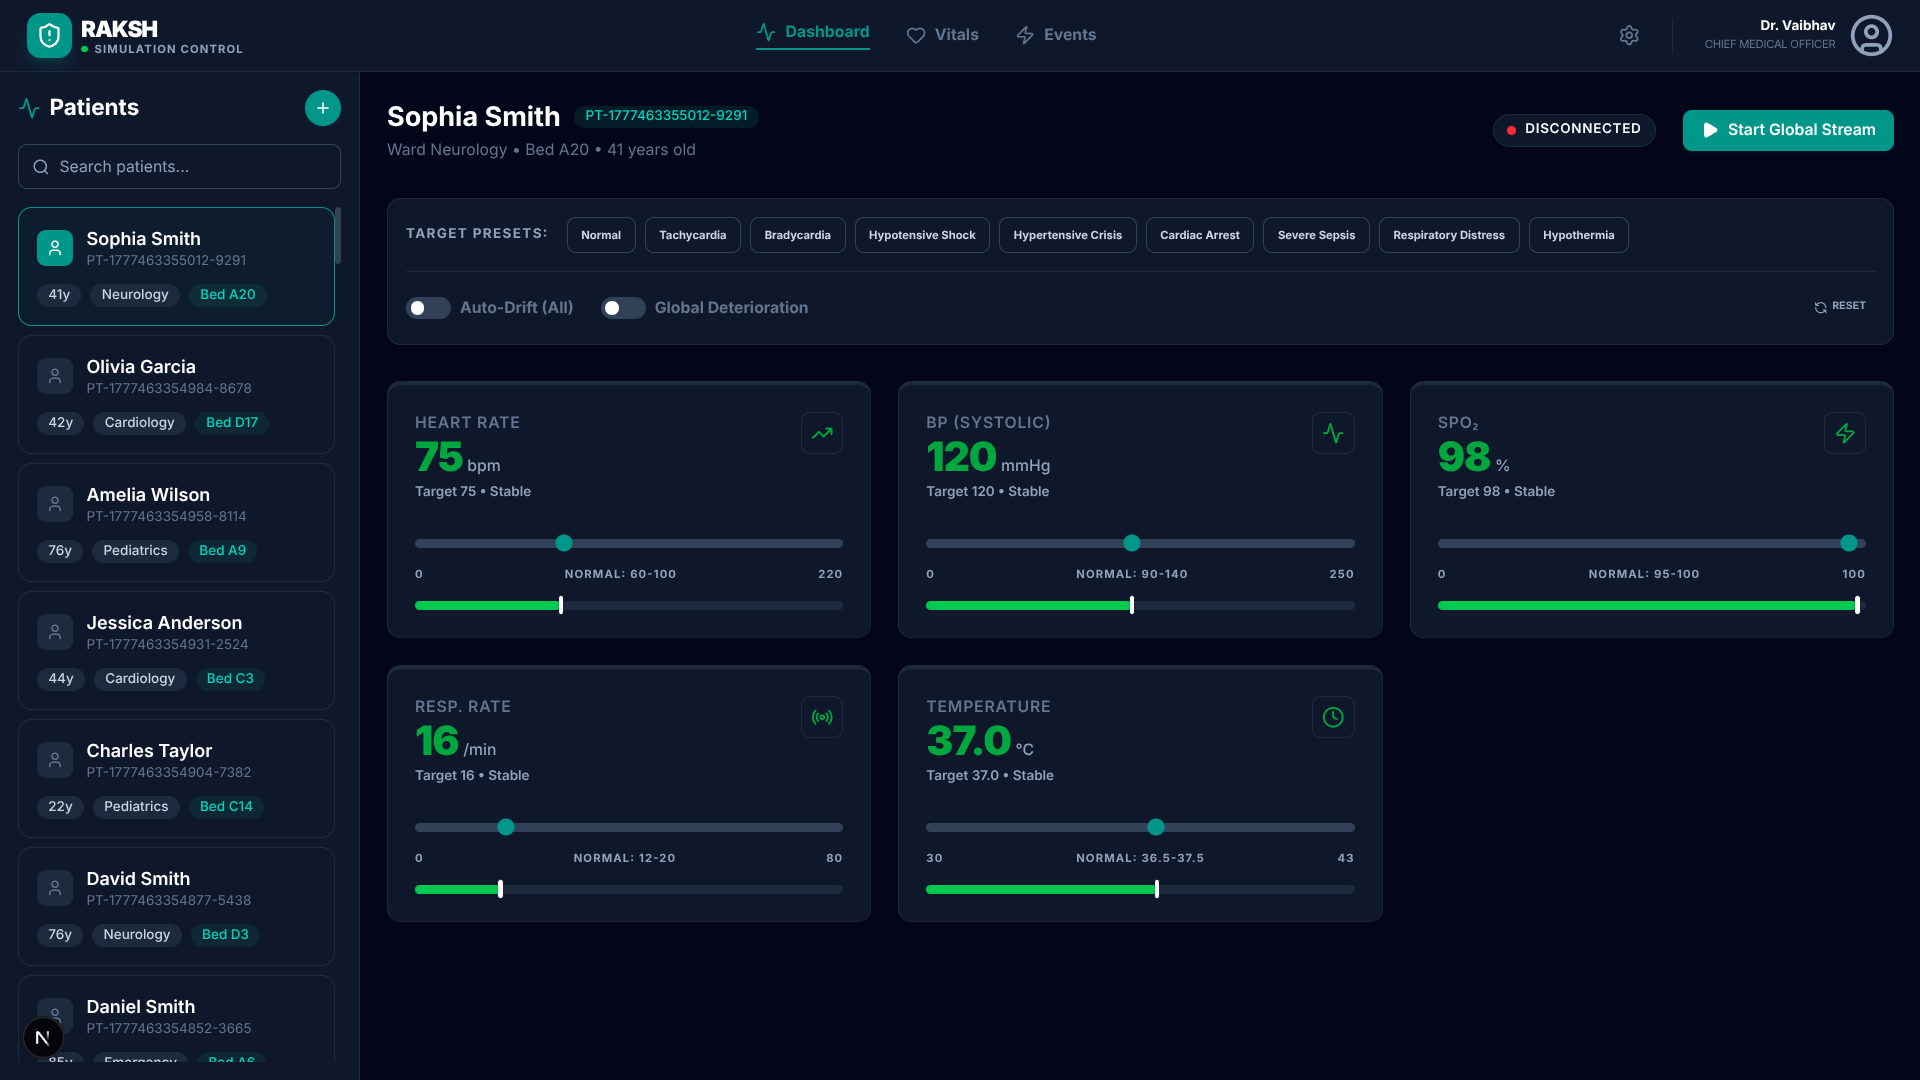
Simuation panel
-
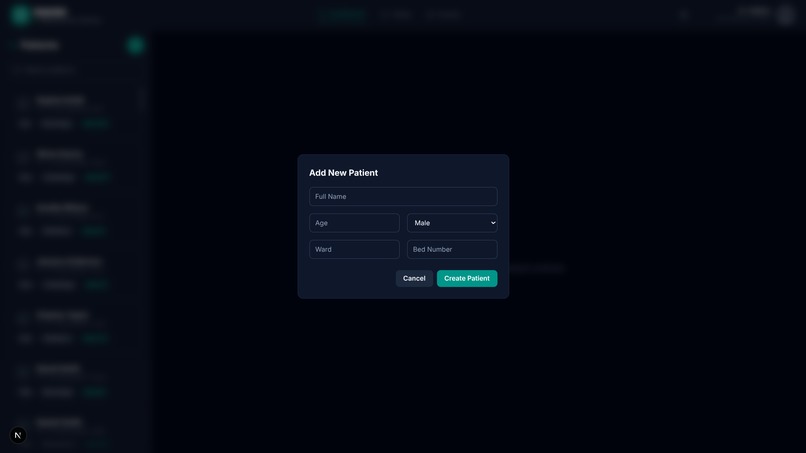
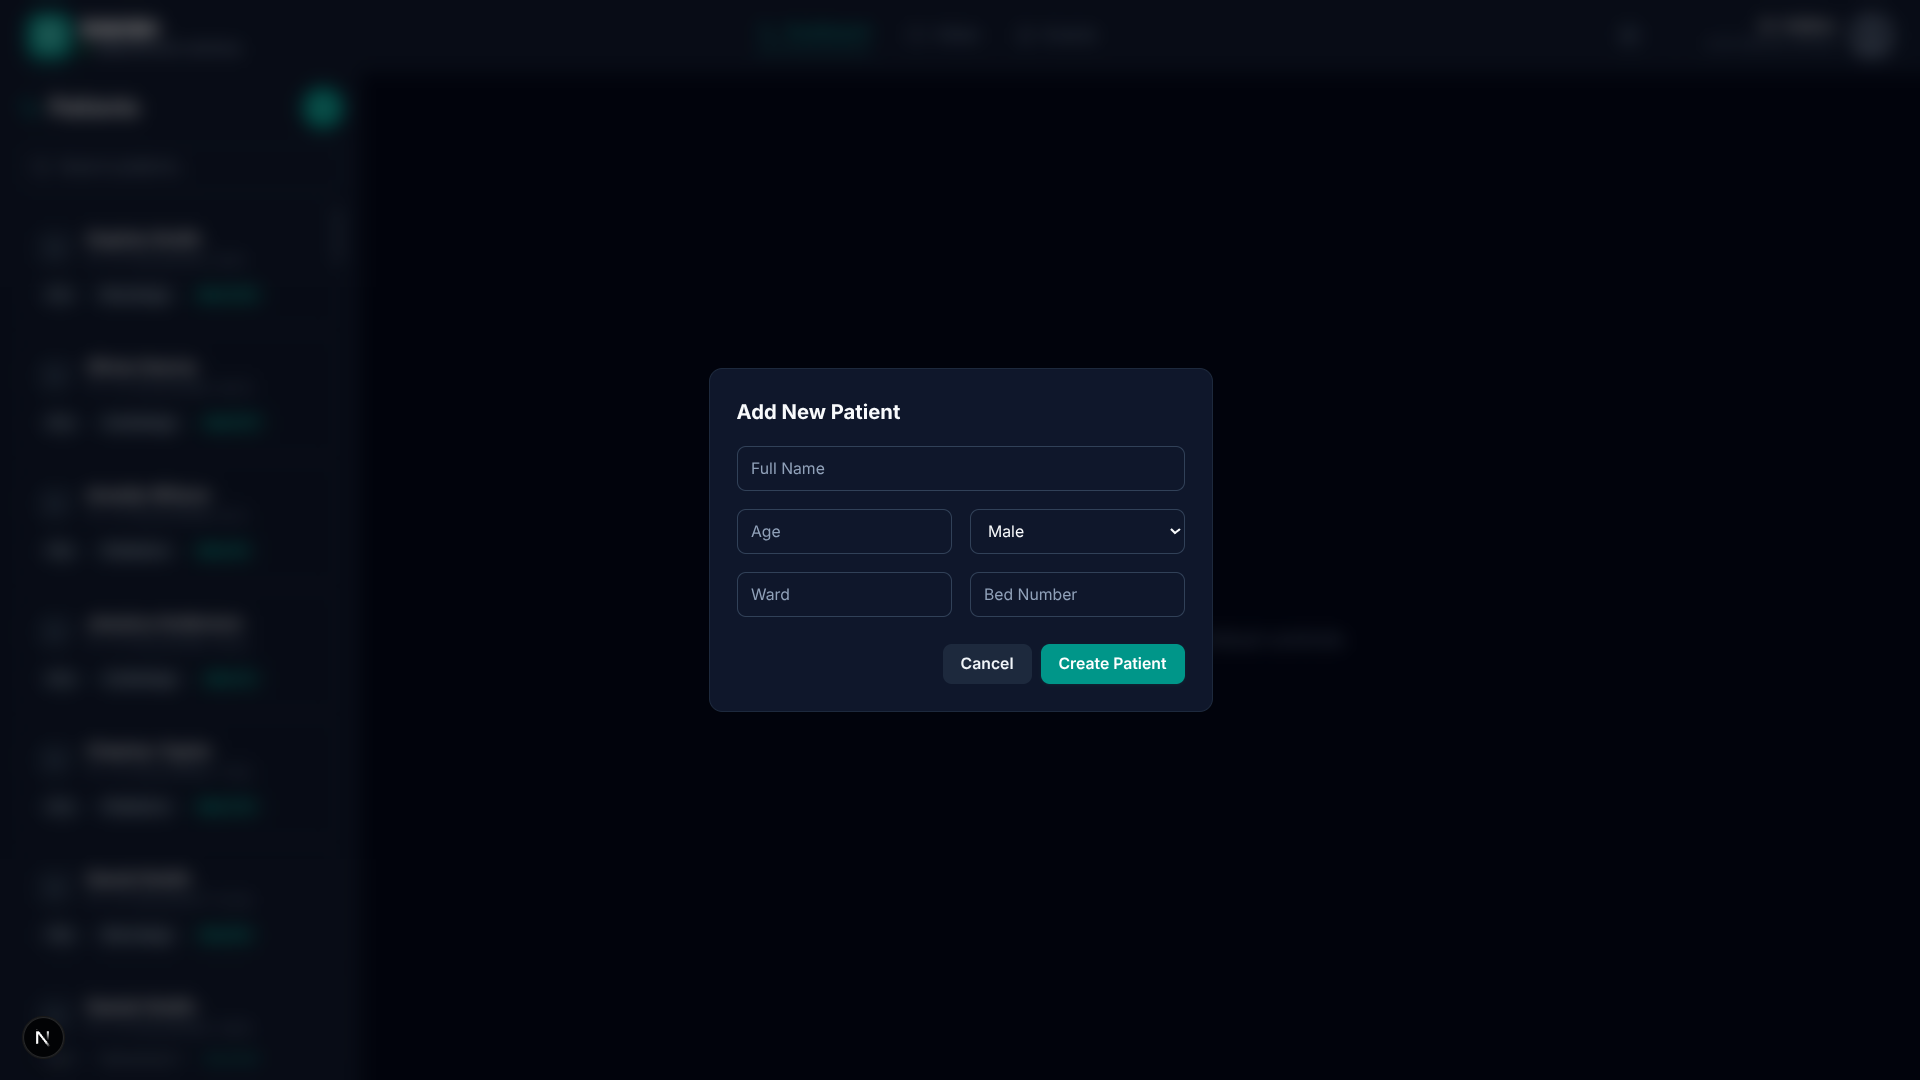
Adding a new patient
-
-
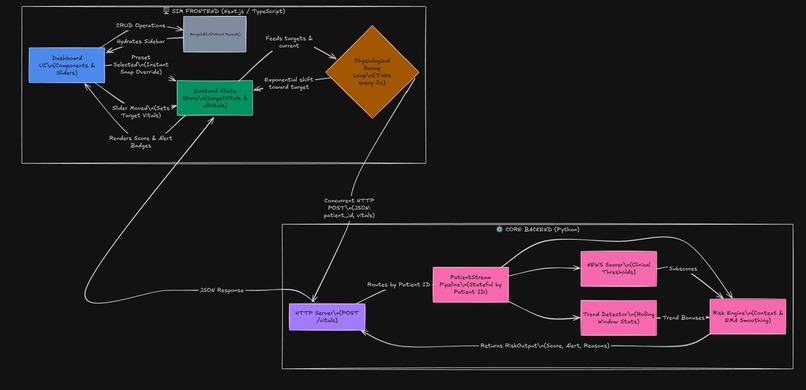
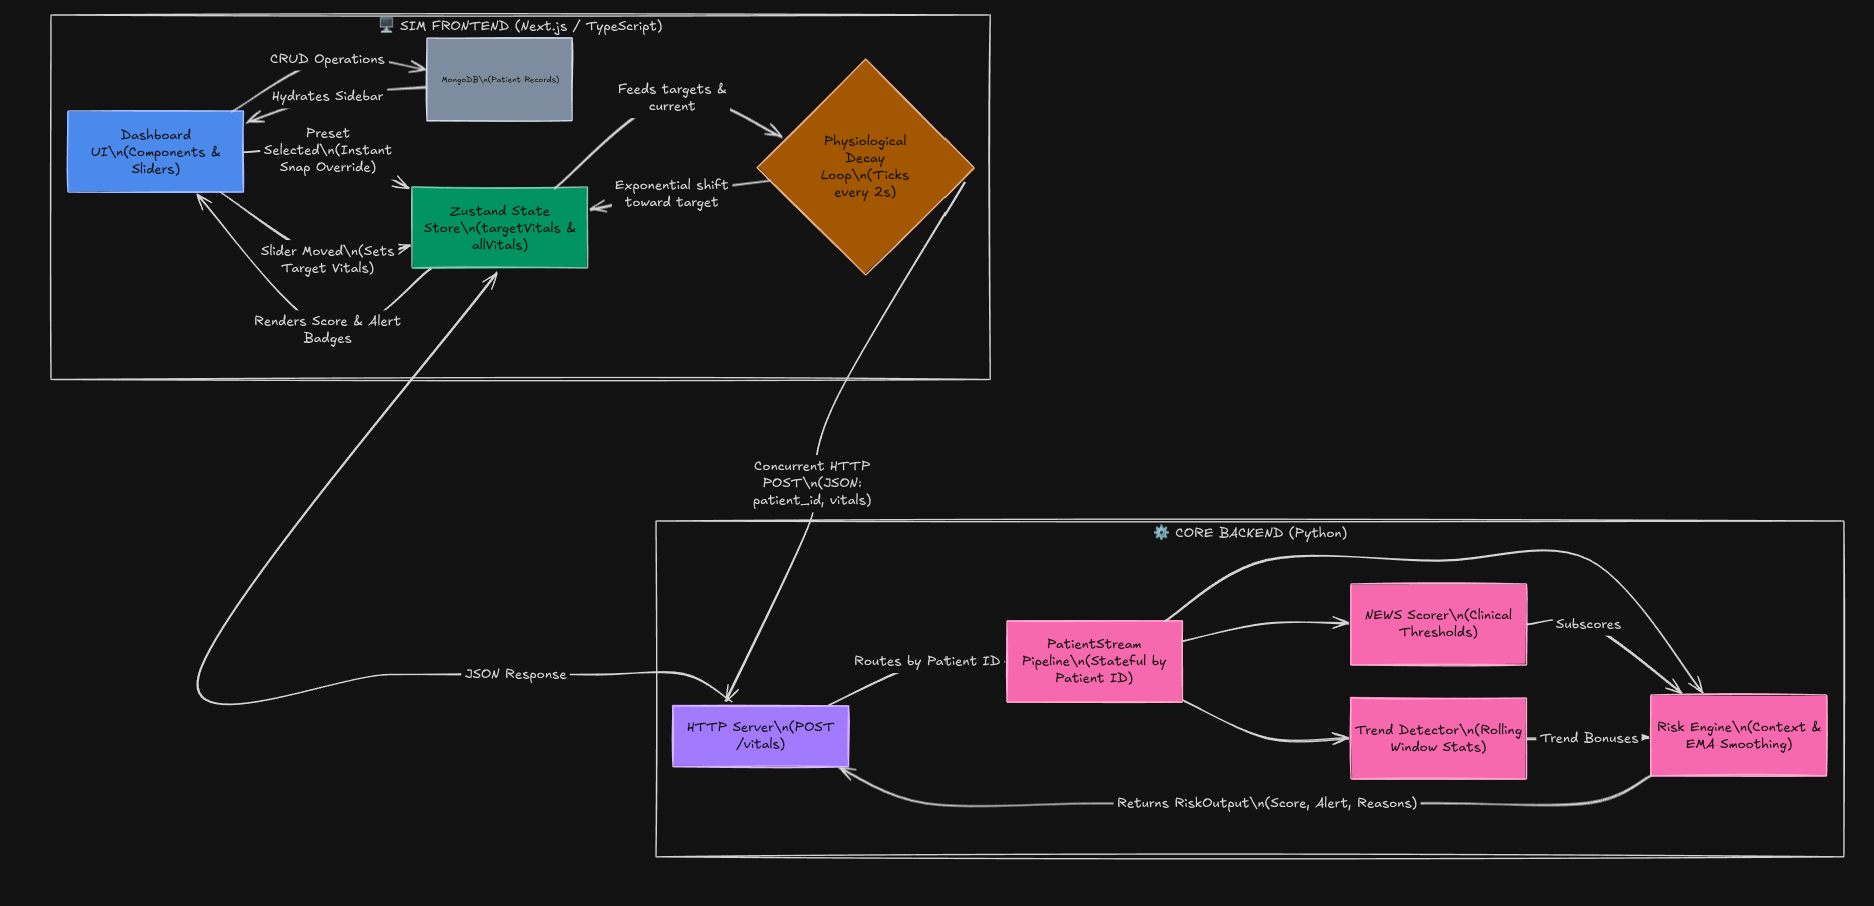
Flowchart
-
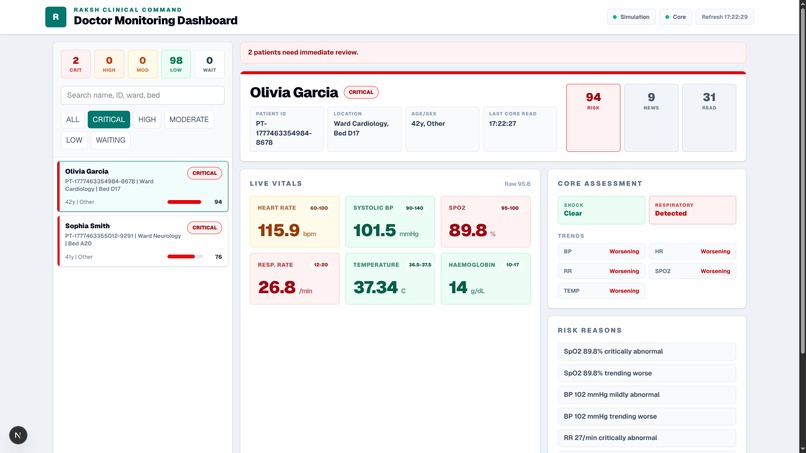
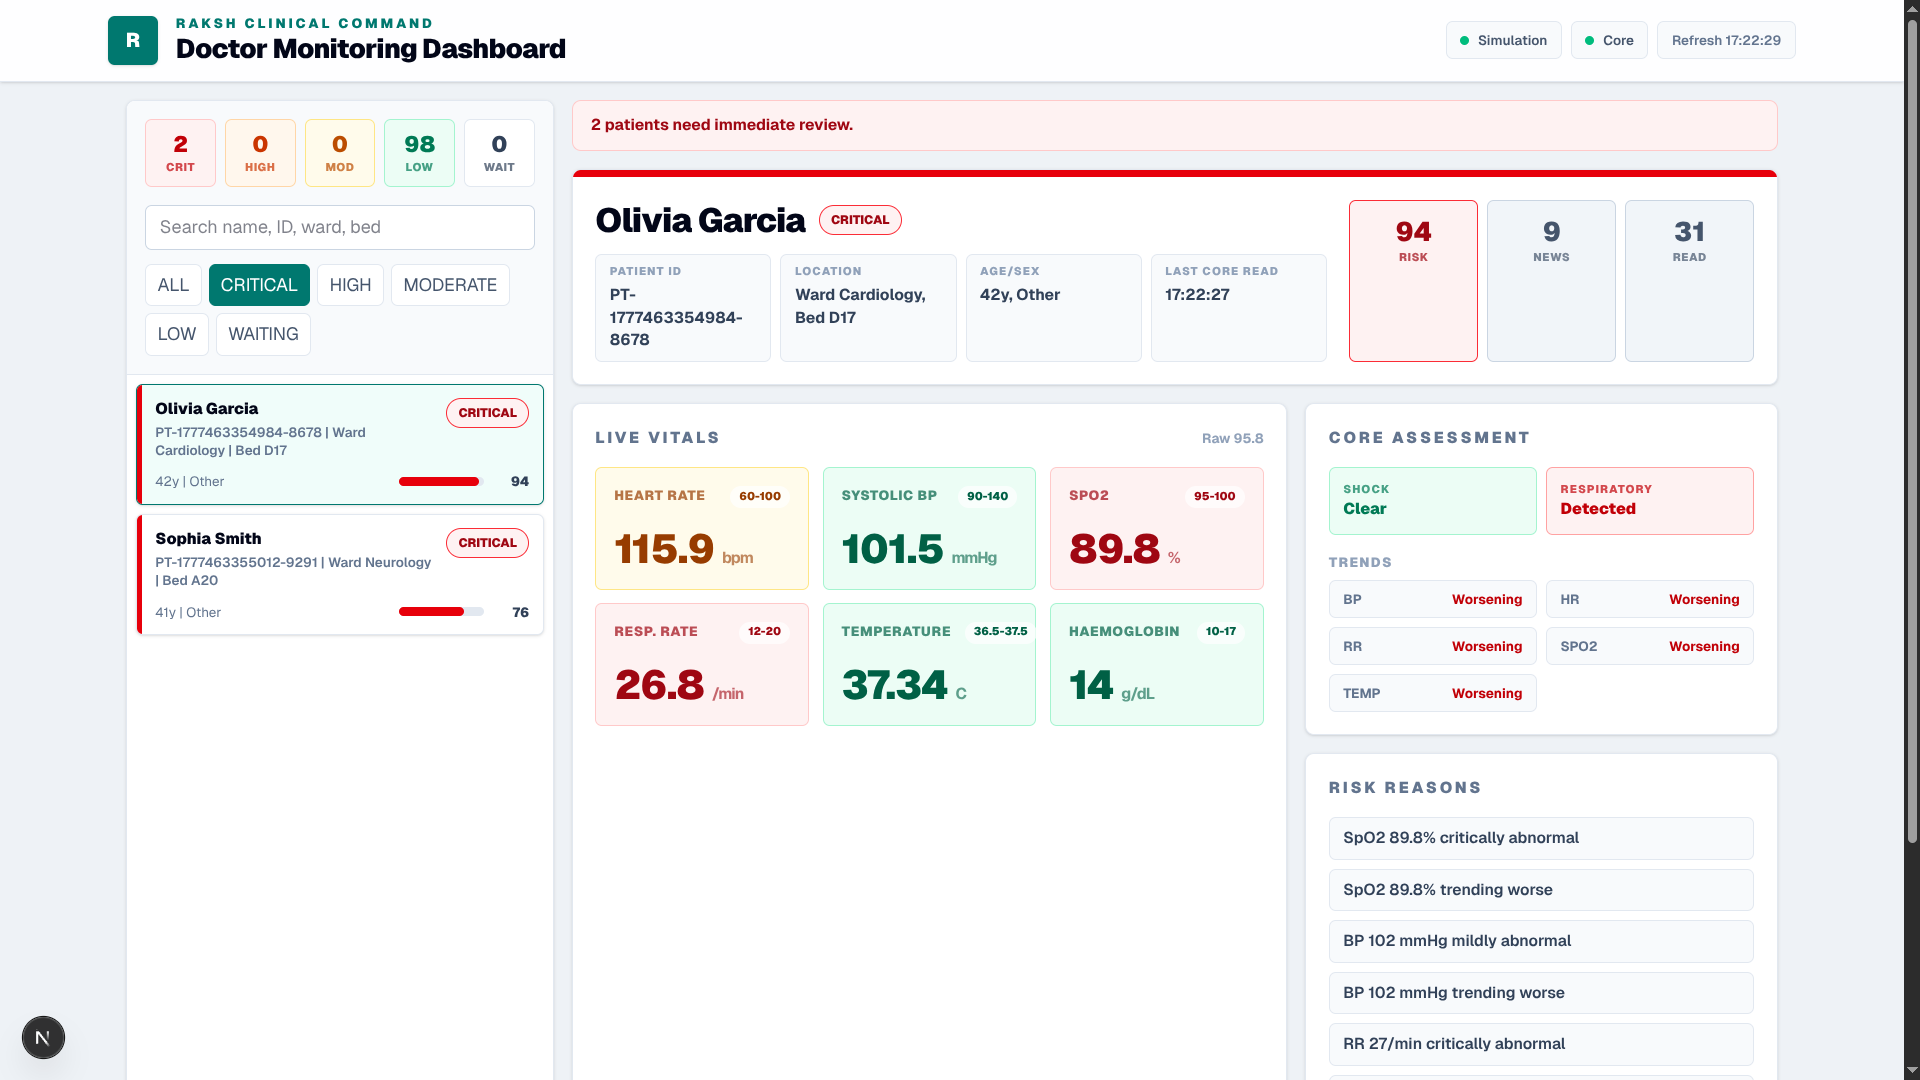
critical vital patient
-
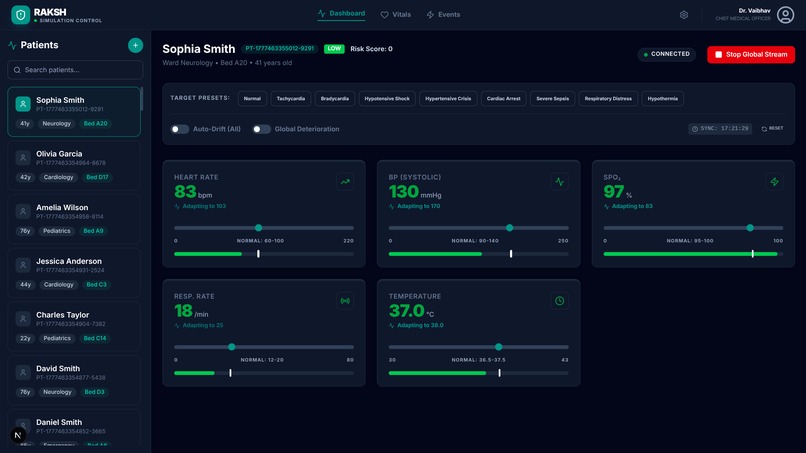
patient's stream active
-
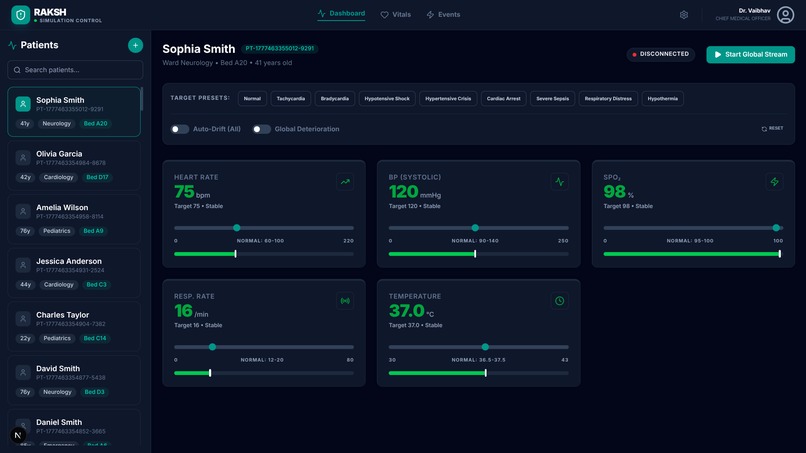
Patient's vital preview
-
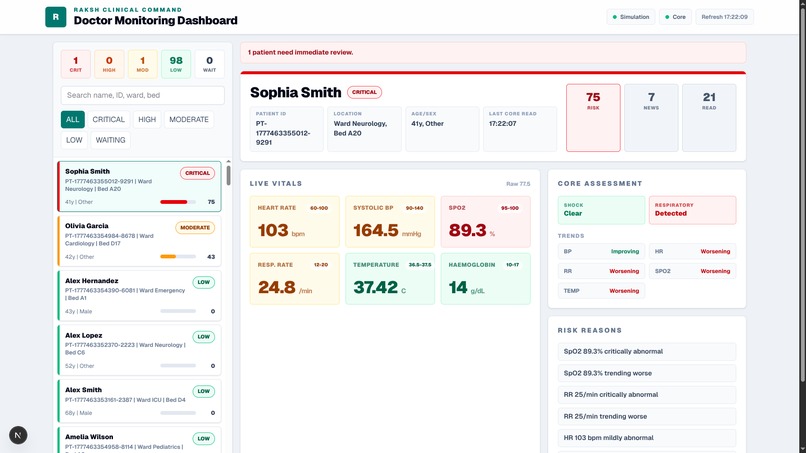
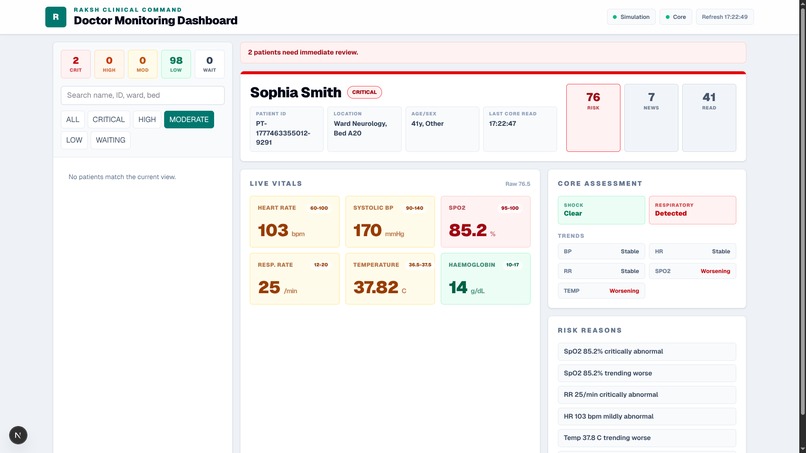
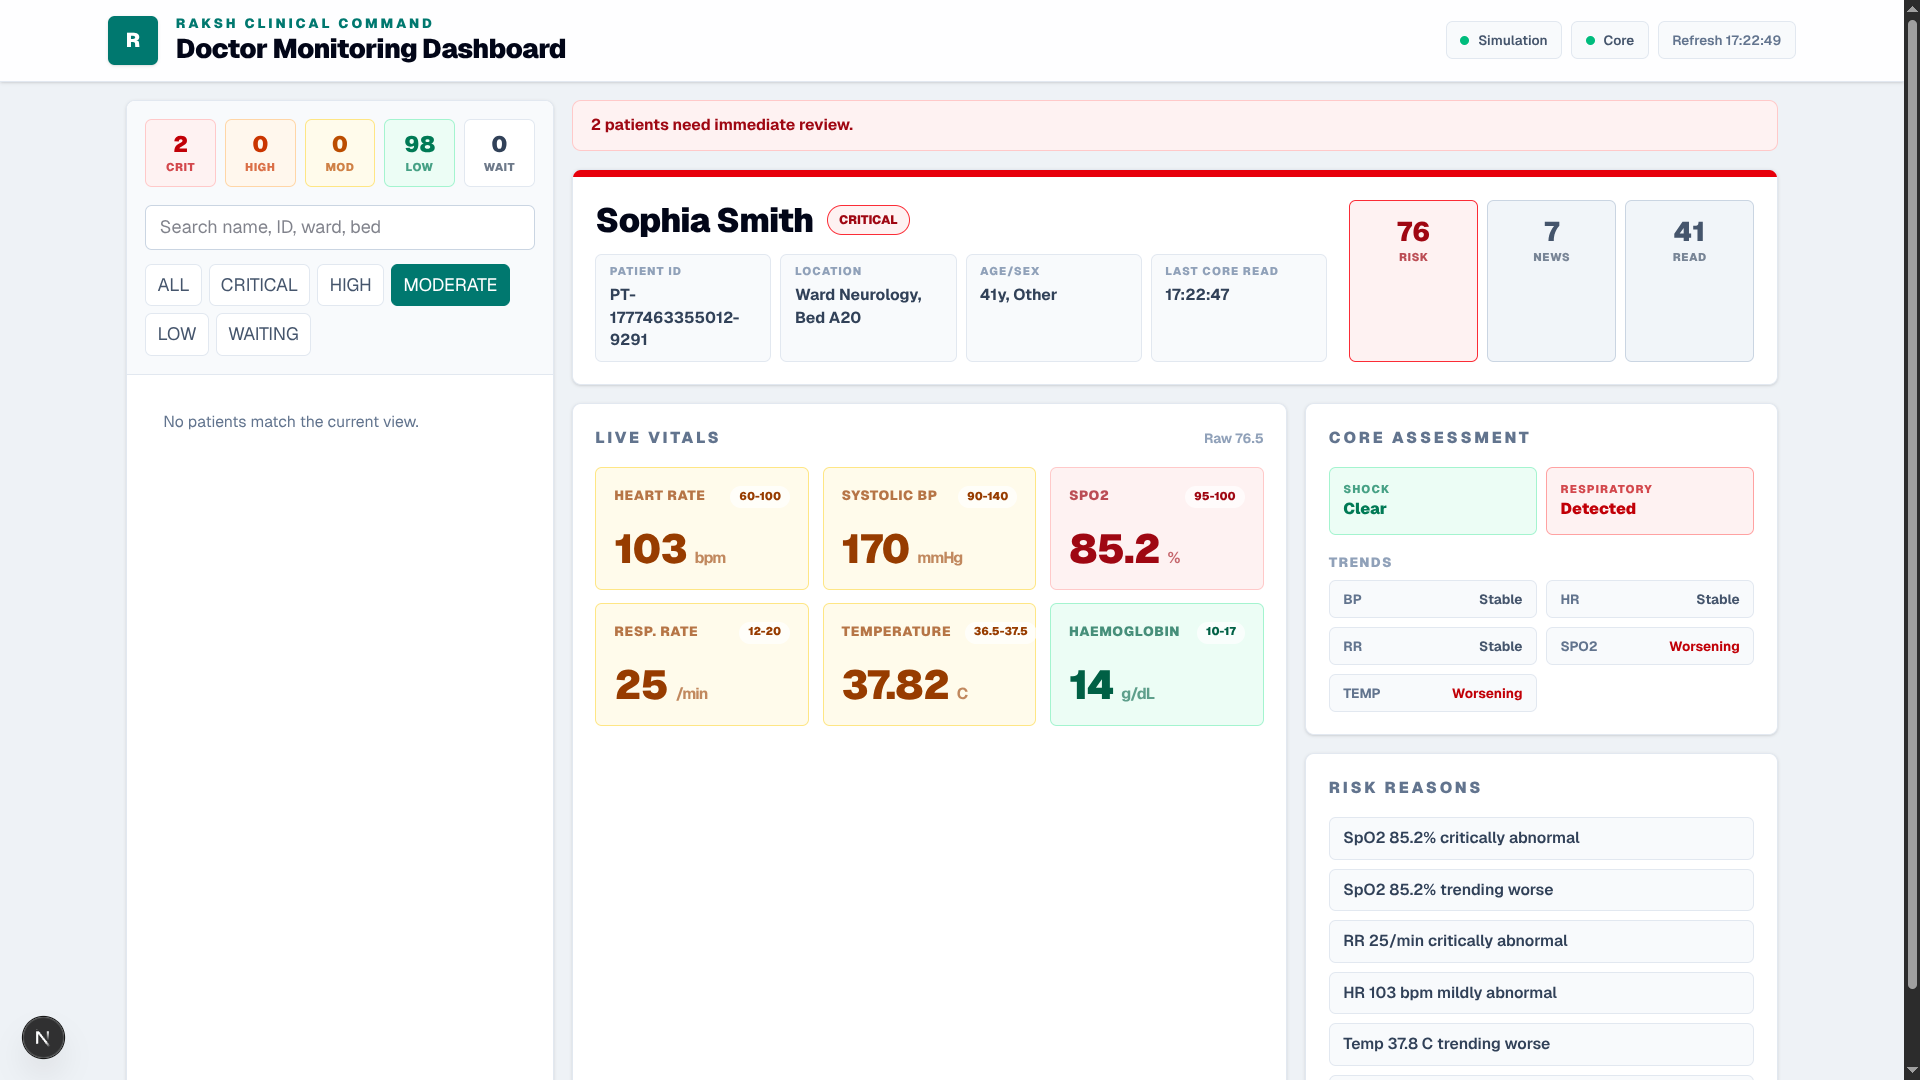
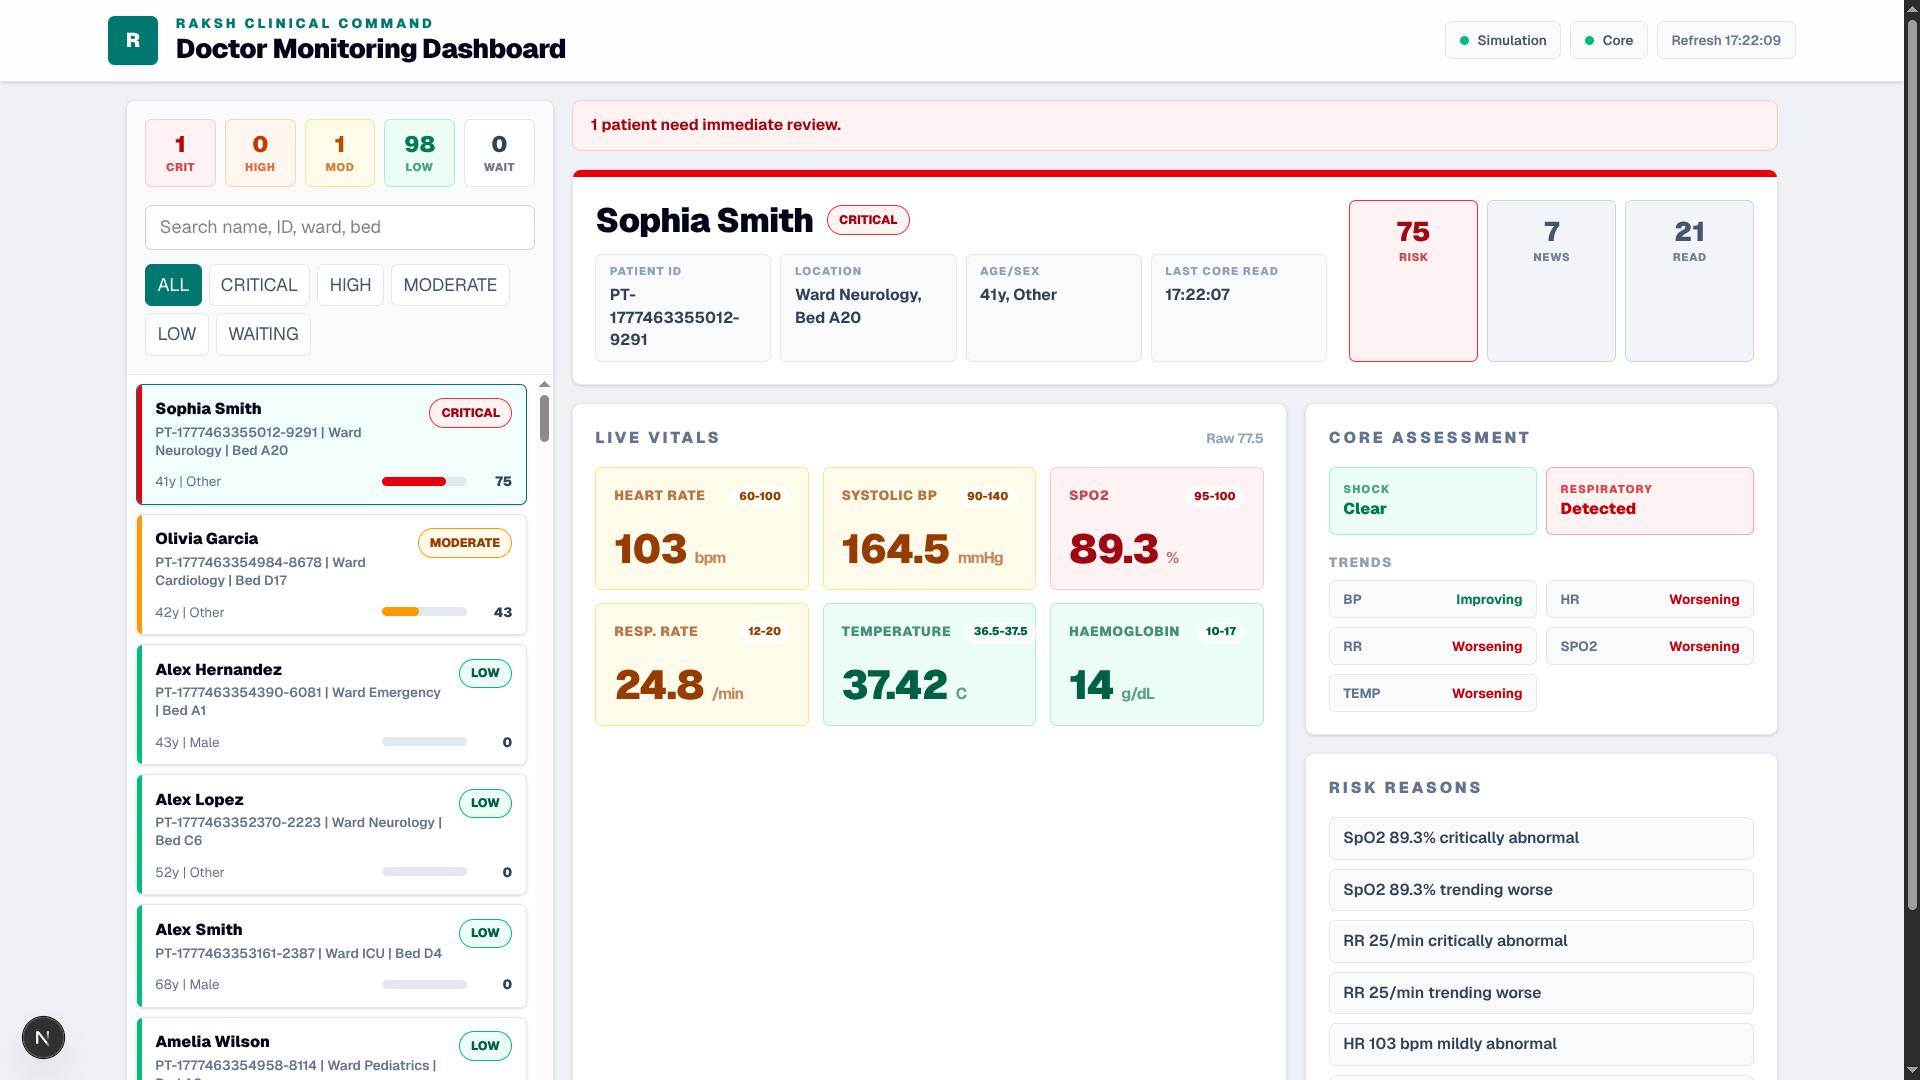
doctor's dashboard panel
-
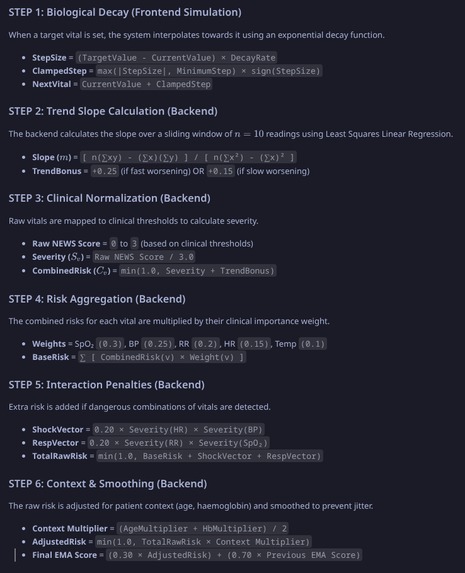
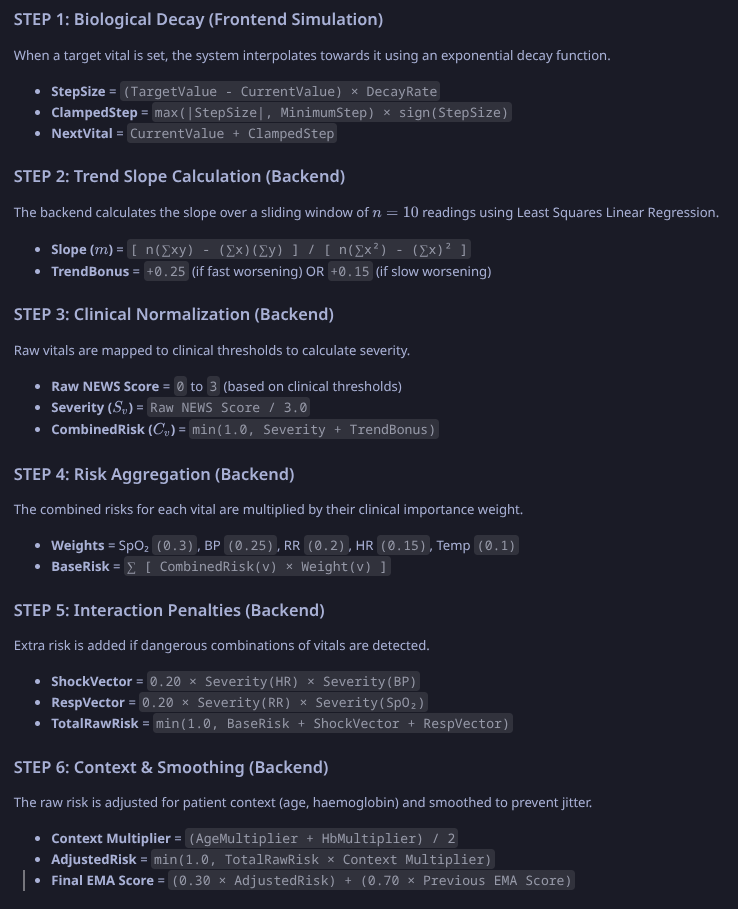
mathematical analysis
Inspiration
India has one of the world's most talented doctors but the doctor to patient ratio is 1 doctor to 811 people. They are often forced to work under extreme patient load. In many hospitals one doctor may need to monitor many patients at the same time. Under such pressure, subtle warning signs like falling SPO2, rising respiratory rates or dropping blood pressure can be easy to miss until the patient becomes critical.
Raksh was inspired by this gap between clinical expertise and available attention. We wanted to build a system that acts as an extra layer of vigilance for doctors. Continuously watching patient vitals connecting the dots and highlighting who needs help first.
What it does
Raksh continuously monitors patient vitals, analyzes deterioration patterns and ranks patients based on urgency. It uses a NEWS Style scoring approach, tread detection and clinical context such as age and haemoglobin to generate an explainable risk score. On the dashboard, doctors can immediately see which patients are critical, why they are at risk and who needs attention first.
How we built it
We built Raksh as a real time patient monitoring system with 3 main layers i.e. data simulation, risk analysis and doctor's dashboard.
Data simulation
For the hackathon prototype, we simulated patient's vital stream to represent data coming from existing hospital monitors. Each patient sends reading such as heartrate, SPO2, systolic blood pressure, respiratory rates, temperature, haemoglobin and age. These readings are sent to a python backend through a /vitals api endpoint. The backend keeps track of each patient separately and processes every new reading through a risk pipeline.
Risk analysis
The risk engine first calculates a NEWS Style score from the patient's vital sign. Then it checks whether the patient's condition is worsening overtime using sliding window trend detection. It also looks for dangerous clinical patterns such as high heart rate with low blood pressure or high respiratory rates with low oxygen saturation. After that, it adjusts the score based on patient context like age and haemoglobin and smooth the final score to avoid sudden noisy alert changes.
| Physiological Parameter | Score 3 | Score 2 | Score 1 | Score 0 | Score 1 | Score 2 | Score 3 |
|---|---|---|---|---|---|---|---|
| Respiration Rate (per min) | ≤ 8 | 9–11 | 12–20 | 21–24 | ≥ 25 | ||
| SpO₂ Scale 1 (%) | ≤ 91 | 92–93 | 94–95 | ≥ 96 | |||
| Systolic BP (mmHg) | ≤ 90 | 91–100 | 101–110 | 111–219 | ≥ 220 | ||
| Heart Rate (bpm) | ≤ 40 | 41–50 | 51–90 | 91–110 | 111–130 | ≥ 131 | |
| Temperature (°C) | ≤ 35.0 | 35.1–36.0 | 36.1–38.0 | 38.1–39.0 | ≥ 39.1 | ||
| Consciousness | Alert (A) | CVPU* | |||||
| Supplemental O₂ | Oxygen | Air |
- Direct PDF to the Clinical Chart: NEWS2 Clinical Chart (PDF)
Doctor Dashboard
Finally we build a nextjs doctor's dashboard that refreshes automatically. It shows patients shorted by urgency with labels like critical, high moderate and low. Doctors can click on each patient to see their live vitals, risk score, NEWS score, trends and the exact reason why the system raised an alert.
Challenges we ran into
- One major challenge was how to convert multiple sign into one meaningful risk score. A patient can have one abnormal vital but real deterioration usually appears as a combination of changes. So we had to design a scoring a pipeline that considers severity, trends and clinical patterns together.
- Another challenge was avoiding unnecessary alert noise. If the score changes too aggressively with every reading, doctors may lose trust in the system. To handle this, we added smoothing so the risk score remains stable while still reacting to serious deterioration.
- We also had to make the system explainable. A simple “high risk” label is not enough in healthcare. Doctors need to know why the patient is being flagged, so we built the backend to generate clear reasons such as low SpO2, worsening respiratory rate, or shock pattern.
- Since we did not have access to real hospital hardware or patient data during the hackathon, we had to simulate realistic vital streams. This helped us demonstrate the workflow, but it also means clinical validation would be needed before real deployment
- Finally, connecting the backend risk engine with a live dashboard required careful handling of patient state, refresh timing, and sorting patients by urgency in real time.
Accomplishments that we're proud of
- We’re proud that Raksh actually works end to end. It takes in patient vitals, runs them through our backend, calculates risk, and shows the most urgent patients first on a live dashboard.
- We’re also proud that it doesn’t just show a random score. It tells the doctor why a patient is being marked risky, like low SpO2, rising respiratory rate, dropping BP, or a possible shock pattern.
- Another thing we’re happy about is that it’s more than a basic alarm system. We added trend detection, patient context like age and haemoglobin, and smoothing so the alerts feel more useful and less noisy.
- Most importantly, we built it around a real problem we’ve seen in Indian hospitals: doctors and nurses are skilled, but they’re often overloaded. Raksh is our attempt to give them a cleaner way to know who needs attention first.
What we learned
- We learned that building for healthcare is not just about showing data. The bigger challenge is making the data useful, clear, and trustworthy for the doctor.
- We also learned that a single abnormal vital sign does not always tell the full story. Trends and combinations matter a lot. For example, high heart rate alone may not be as serious as high heart rate with low blood pressure.
- Another important learning was explainability. In healthcare, you cannot just show a score and expect people to trust it. The system needs to clearly explain why it is raising an alert.
- We also understood how difficult real-world integration can be. For the prototype, we simulated vitals, but in an actual hospital we would need to work with existing monitors, EHR systems, APIs, and hospital workflows.
What's next for Raksh
- Next, we want to test Raksh with more realistic patient data and improve the risk scoring with feedback from doctors.
- We also want to connect it with real hospital systems, so instead of simulated vitals, Raksh can receive live data from bedside monitors, EHR systems, or hospital APIs.
- Another next step is adding proper alert workflows. For example, a nurse or doctor should be able to acknowledge an alert, add notes, escalate a case, or mark that action has been taken.
- We also want to make the dashboard more useful for real wards by adding patient history, previous trends, lab reports, and different views for doctors and nurses.
- Long term, Raksh could support multiple hospital settings like general wards, emergency rooms, and ICUs, with scoring logic tuned for each environment.
- Our goal is to make Raksh a reliable clinical support tool that helps medical teams catch deterioration earlier and respond faster.

Log in or sign up for Devpost to join the conversation.