-
-
Logo
-
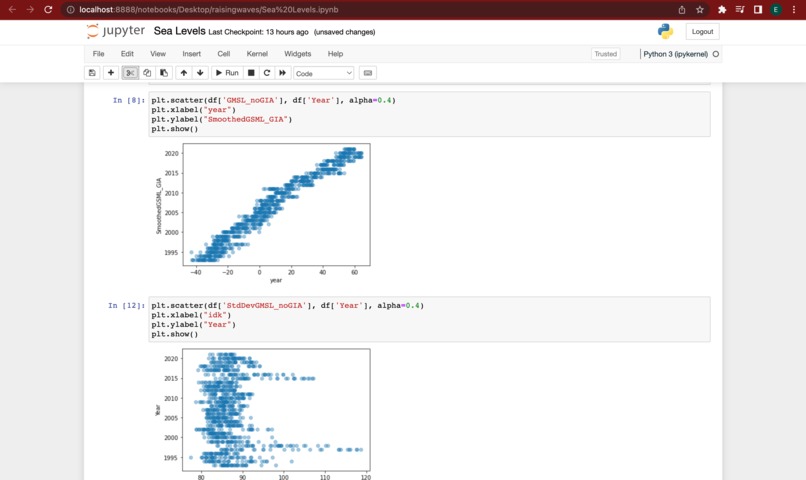
Feature Engineering
-
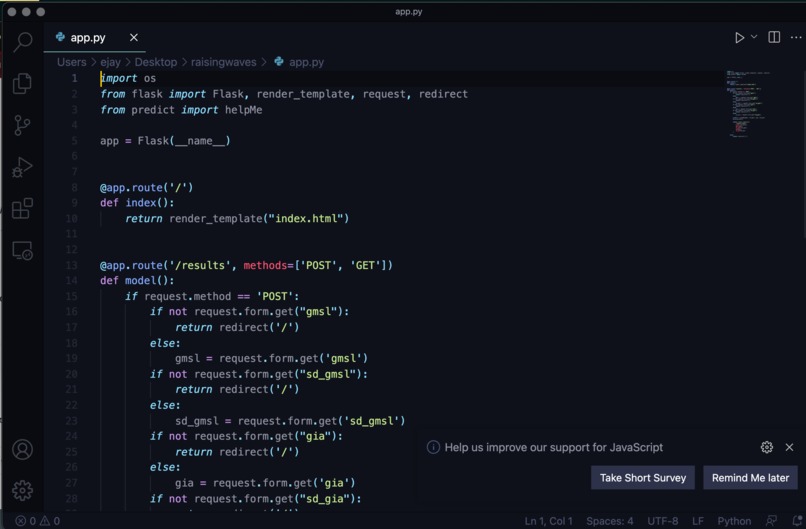
Flask Code
-
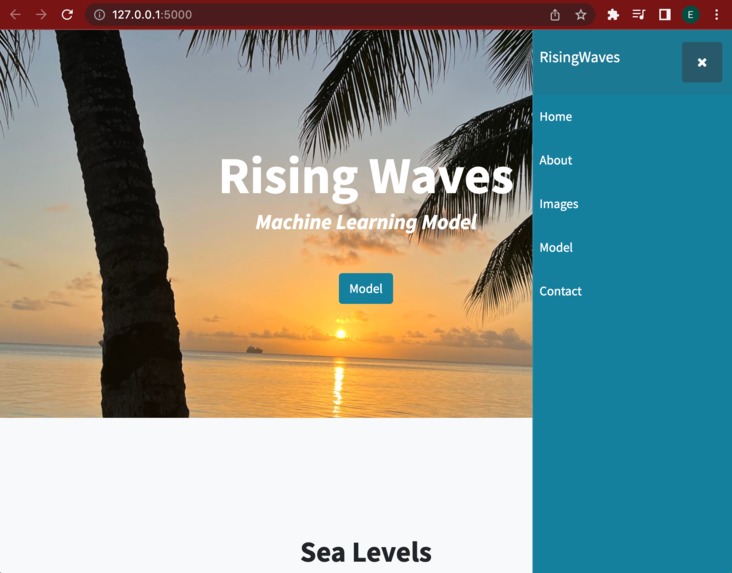
BootStrap


Inspiration
The inspiration for this project happened when I read about what it means to be an ethical hacker. This brought up the idea of wanting to spread awareness of a big problem happening right below our noses. The raising of sea levels. It is also extremely useful for me as well, since I live on an island in the Pacific Ocean.
What it does
The ML model is a supervised model that utilizes linear regression, from the sklearn library, to predict the year it will occur when we input our values to our 4 main features. Our features are the Global Mean Sea Level (GMSL), Global Isolation Adjustment (GIA), and their Standard Deviation (SD_GMSL/SD_GIA) within that year.
How we built it
The first thing I did was to find a dataset about the sea levels throughout the past years. After finding a dataset at Kaggle, I used Jyupter Book to clean and evaluate the dataset. I had to find features that showed a strong correlation, as well as graphs, and scatter plots to visualize the data. After feature engineering the dataset, I went to python to create the ML model. Lastly, I had to figure out a way to showcase my project which led me to create a website using Bootstrap Studio and Flask, a python web framework.
Challenges we ran into
I ran into many challenges within the 48-hour time frame. I had a rough time cleaning and evaluating the sea-level data set. To only find 4 strong features to use for my model. Another challenge was how I was going to showcase my project. I did not know how I can deploy an ML model into a website so that was another obstacle I came across upon. I even had to learn how to use Bootstrap Studio, since I knew I didn't have the time to create a website from scratch. However, the greatest challenge I stumbled upon was trying to deploy my website on google cloud with a domain name for domain.com. I had no experience with the cloud or even how to deploy a website. So that resulted in a complete failure due to the lack of time.
Accomplishments that we're proud of
I am very proud of utilizing a Kaggle dataset to find a correlation between GMSL, GIA, and their Standard Deviation to predict the year of their sea level as it was my first time creating an ML model. Another proud accomplishment of mine was figuring out how I could deploy my ML model into a website.
What we learned
I learned a lot during those 48 hours. I learned so much about machine learning, python libraries, Jyputer notebook, Bootstrap Studio, and even learned a bit of the google cloud despite failing to launch a running website (due to lack of time).
What's next for Raising Waves
There is a lot more to come for Raising Waves. First off, I would like to implement a visual plot for the users to see when they use the model. A scatter plot for each of the four main features. I would also like to implement a google map API that can visualize a heated map of how deep (high) the water is.

Log in or sign up for Devpost to join the conversation.