Inspiration
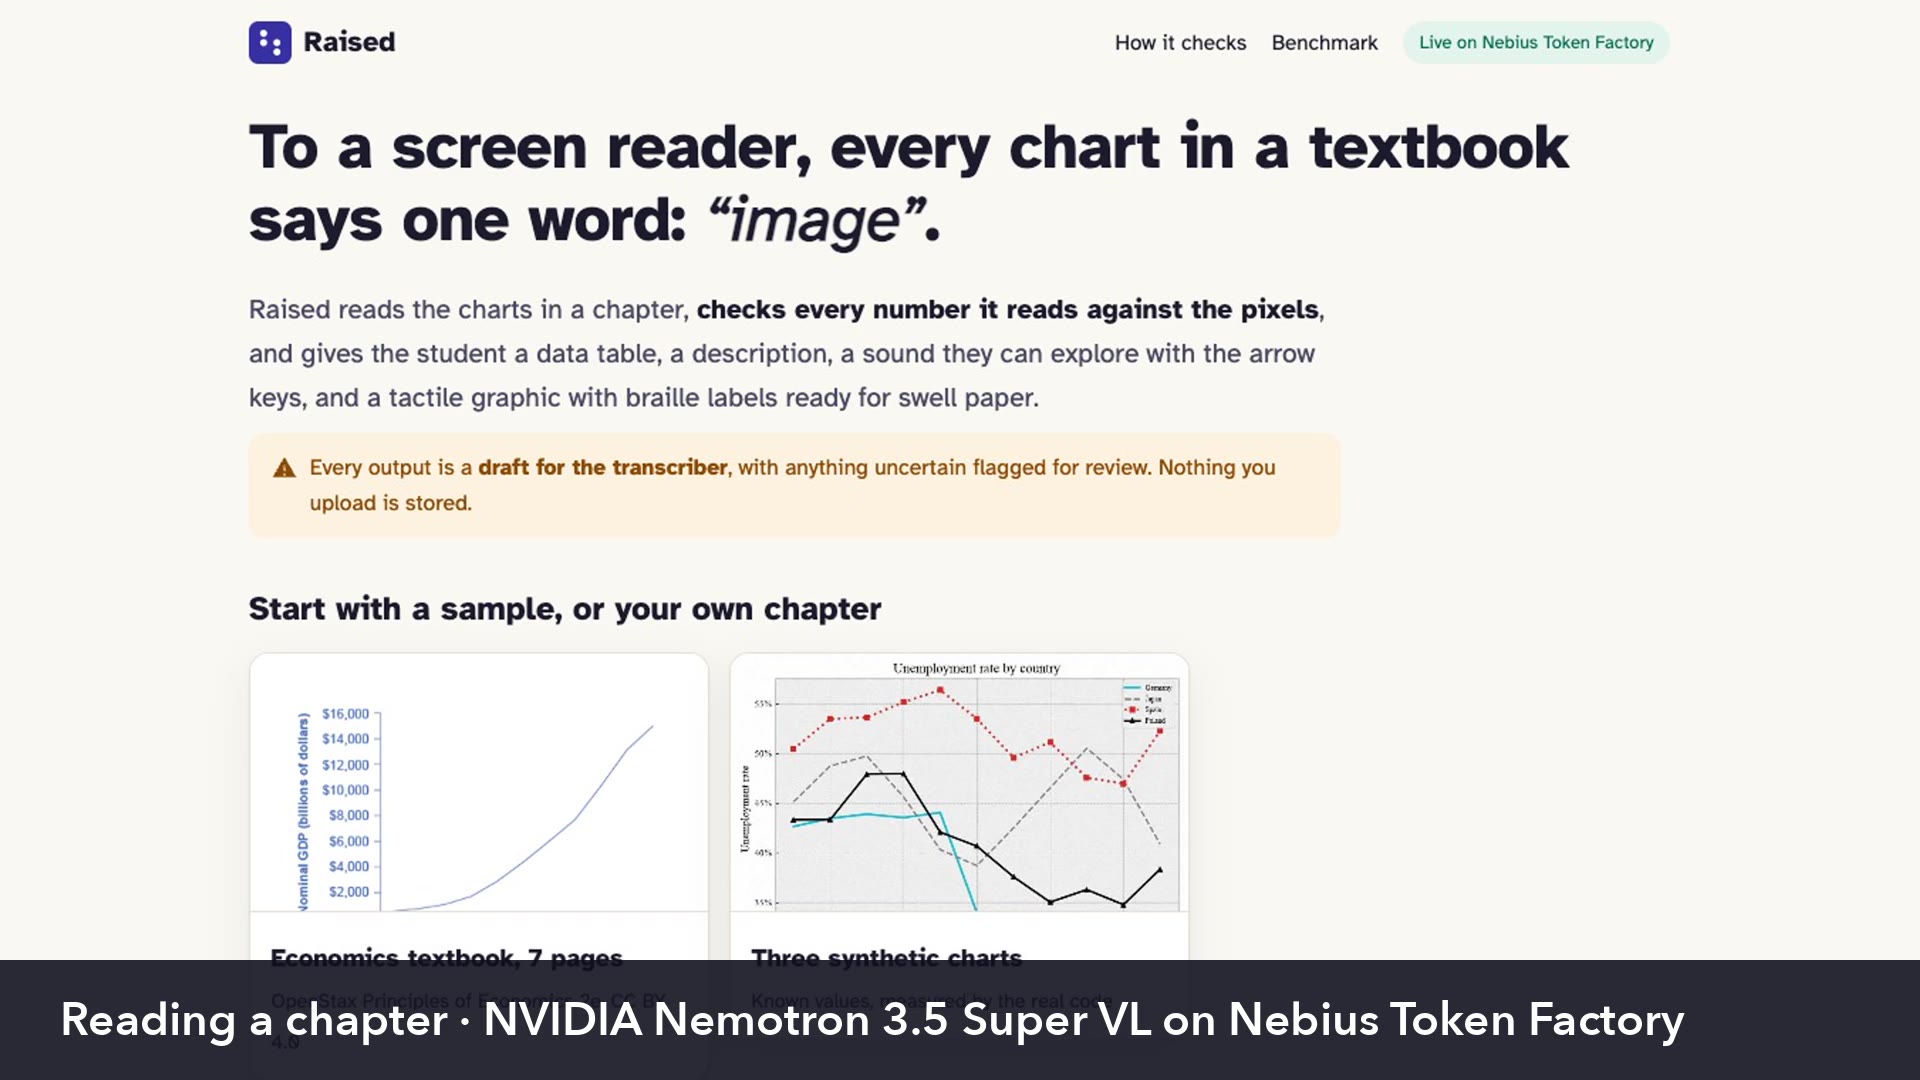
If you open a textbook PDF with a screen reader, every chart is just a picture. It says "image" and goes to the next line, so blind and low-vision students lose the entire data behind it. We wanted those students to get the same data from a chart as everyone else in class.
What it does
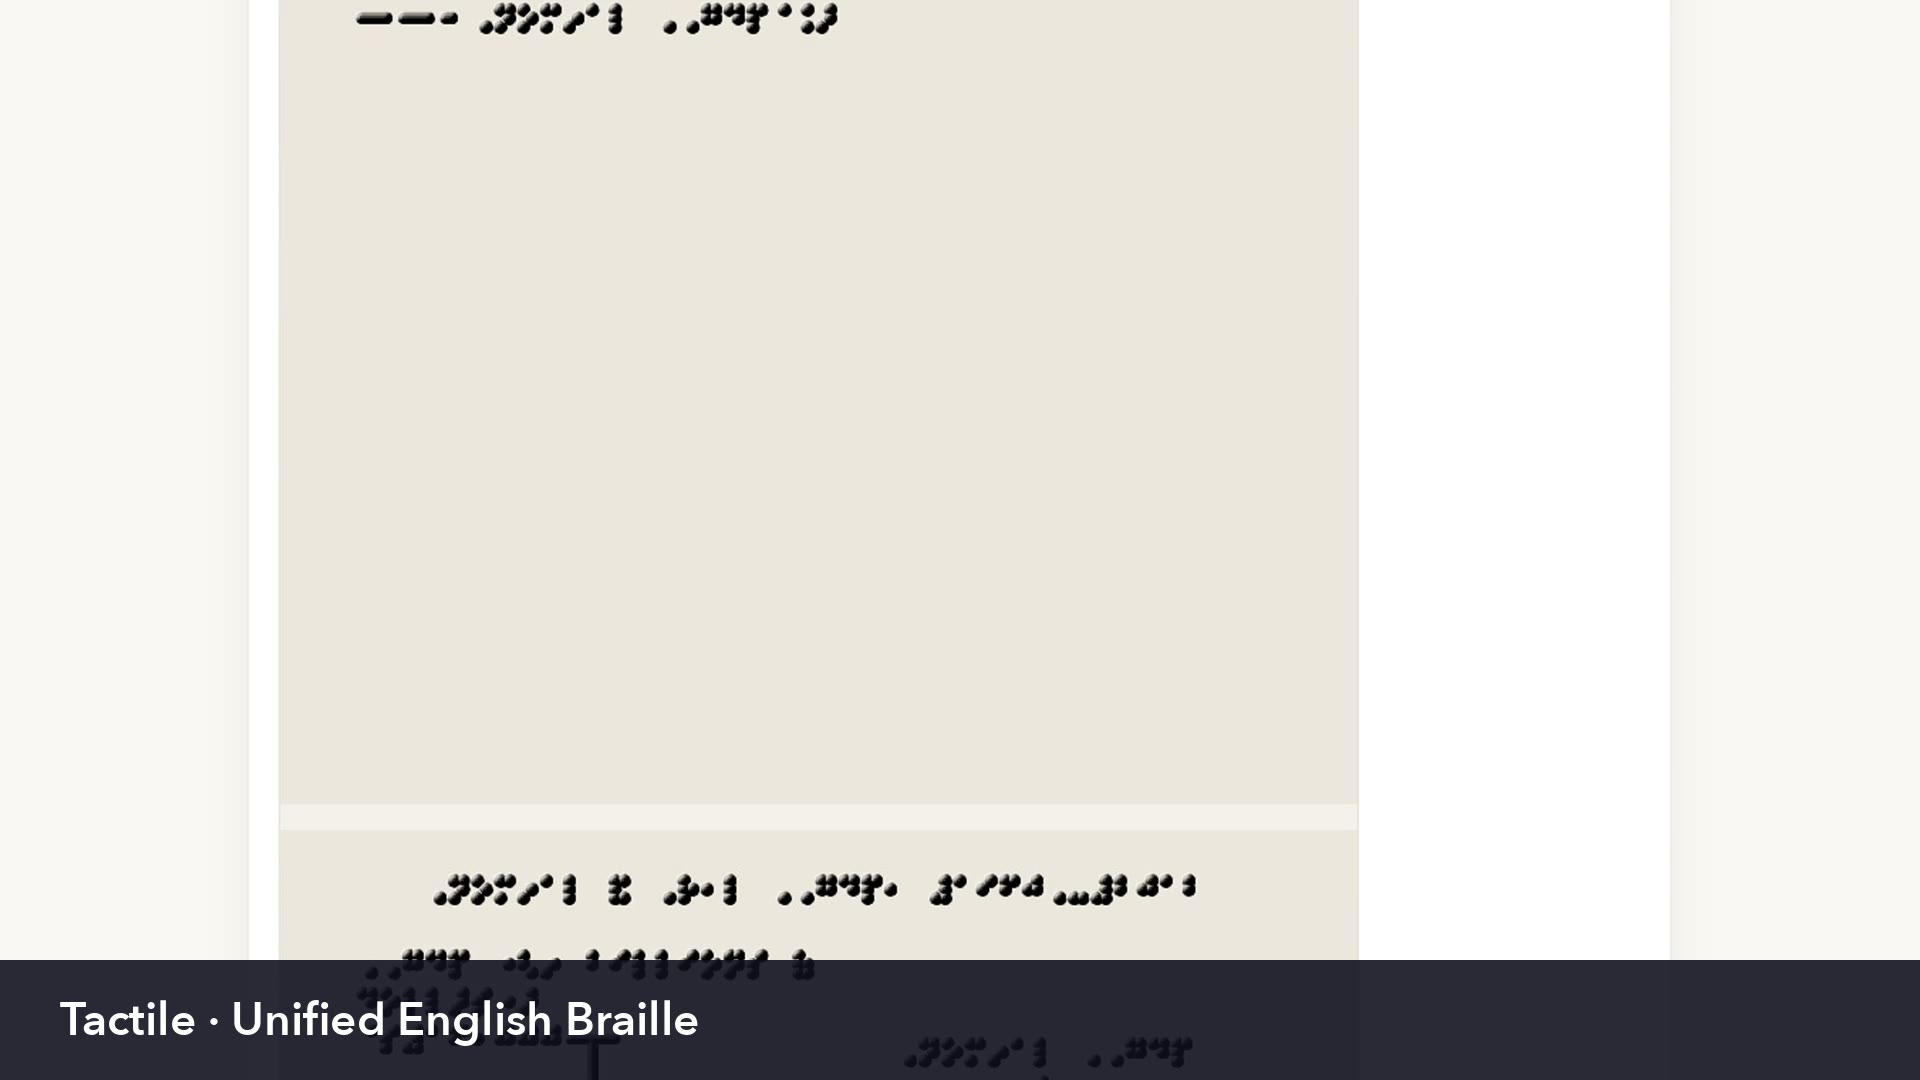
You give Raised a textbook PDF or a single chart image, and it finds every data chart inside. For each chart it makes 6 outputs: a checked data table, a long description, a short alt text, a sound explorer, a tactile graphic and a braille file.
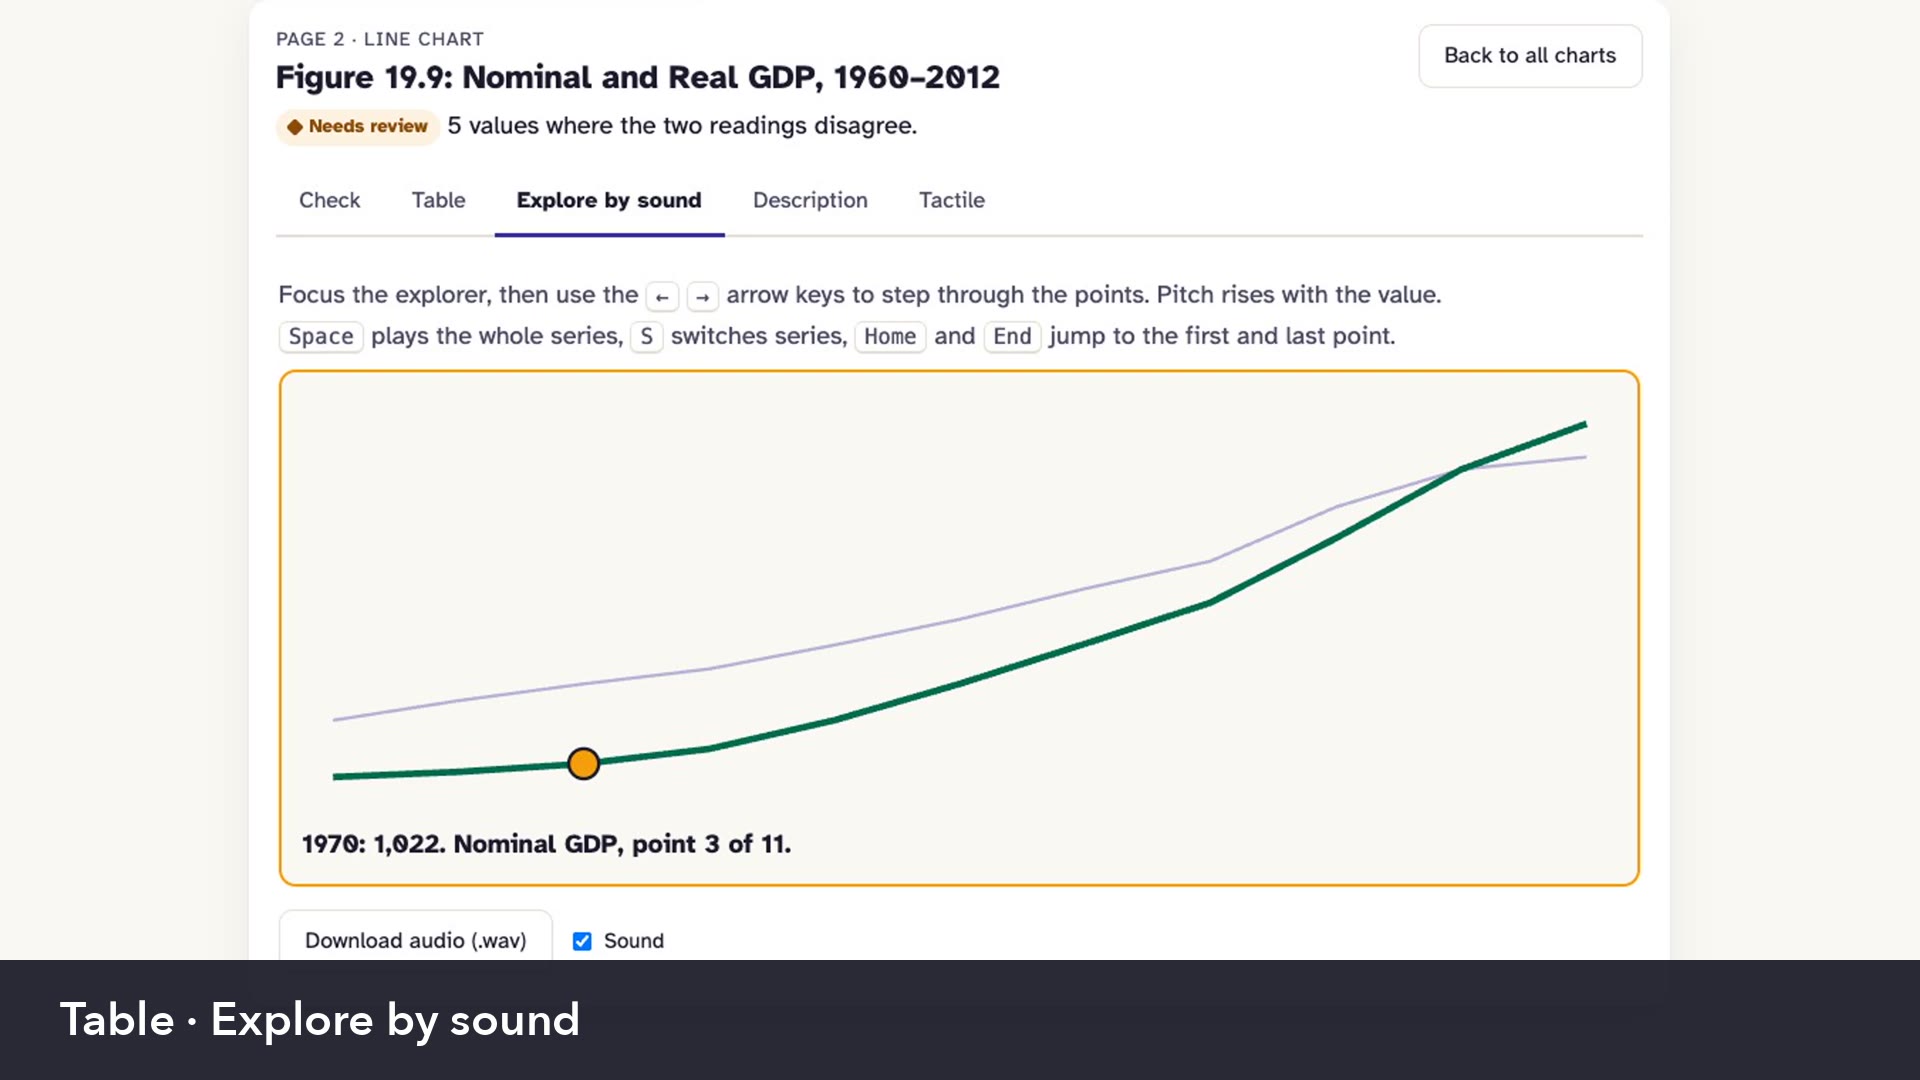
In the sound explorer you move between points with arrow keys, and pitch follows each value. Tactile graphics follow BANA Guidelines and Standards for Tactile Graphics from 2010.
How we built it
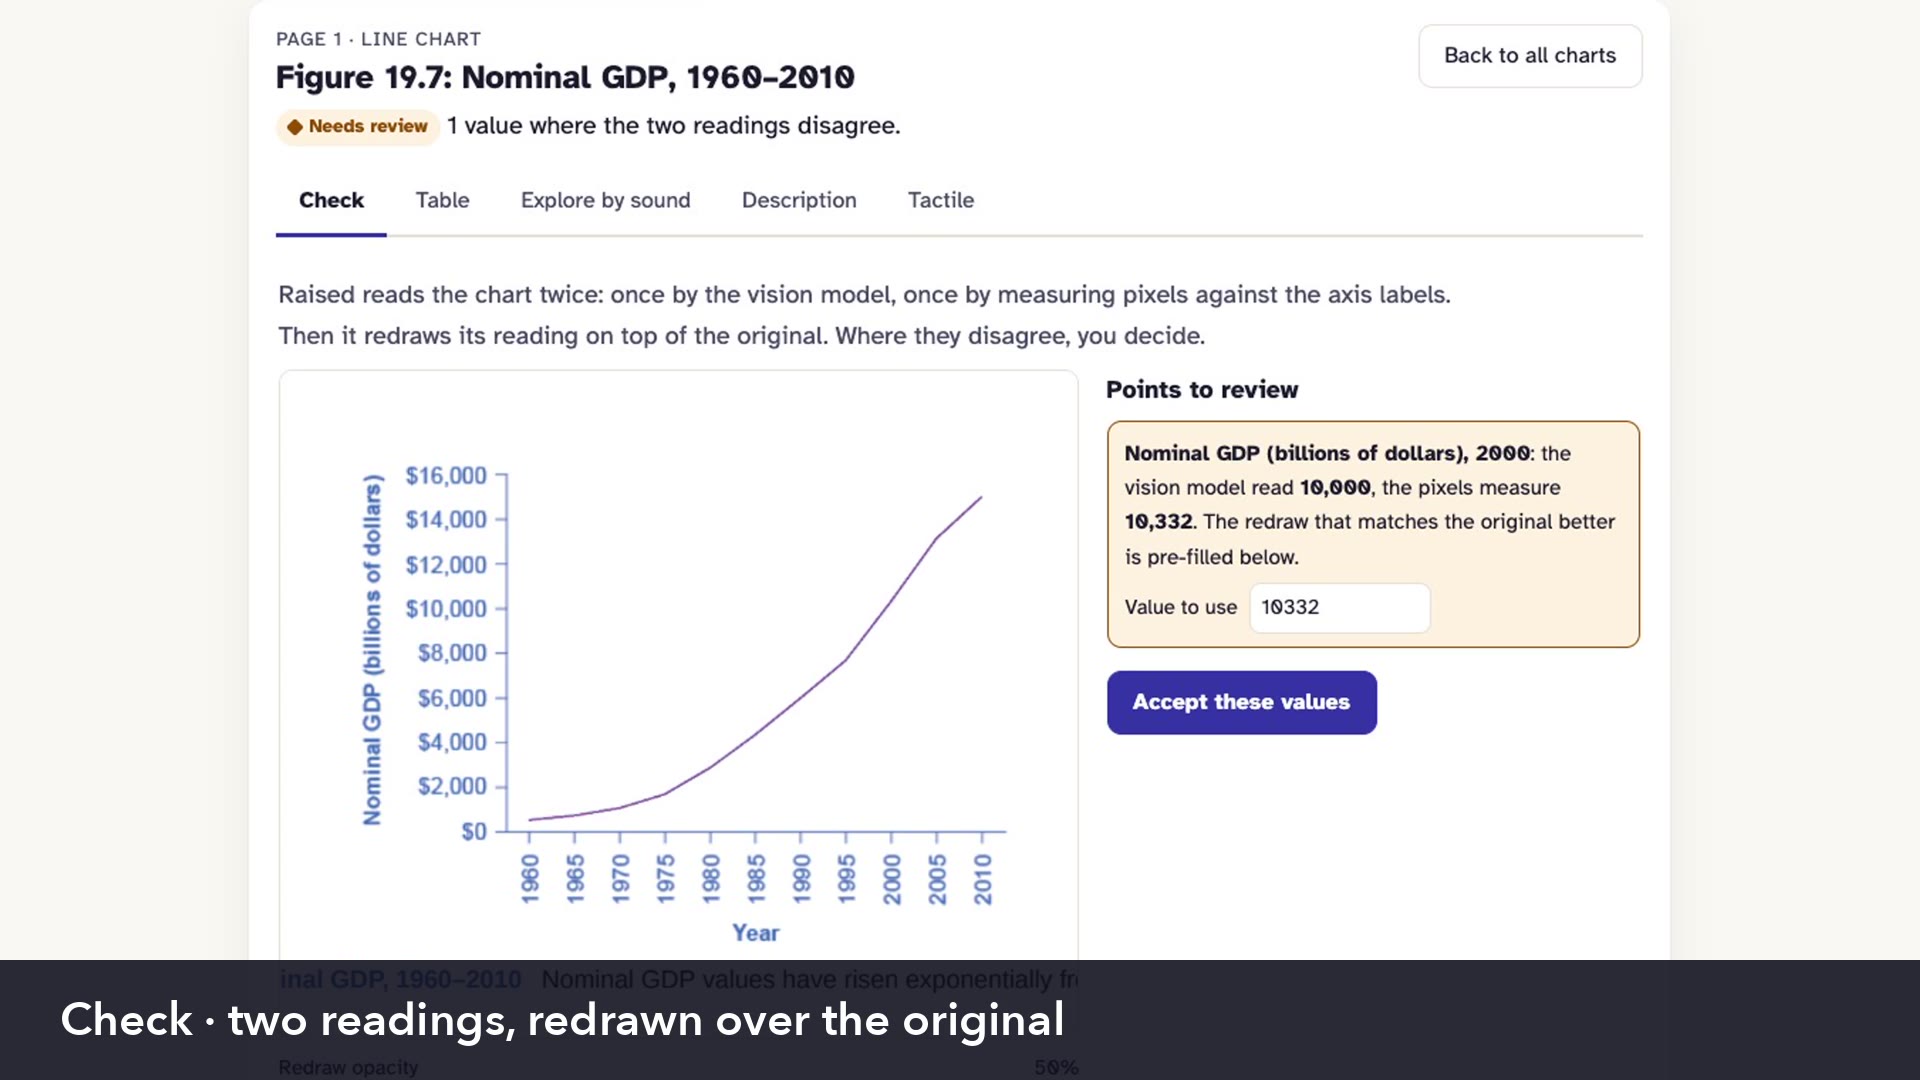
Raised reads every chart twice. One reading comes from NVIDIA Nemotron 3.5 Super VL, which understands what a chart is about and gives a first value for every point. The second one is plain code, with OCR on tick labels, a fitted axis scale and measuring pixels by colour.
If the two readings disagree, we redraw both over the original image, and whichever matches the pixels better wins. Points that are still disputed get flagged for a transcriber.
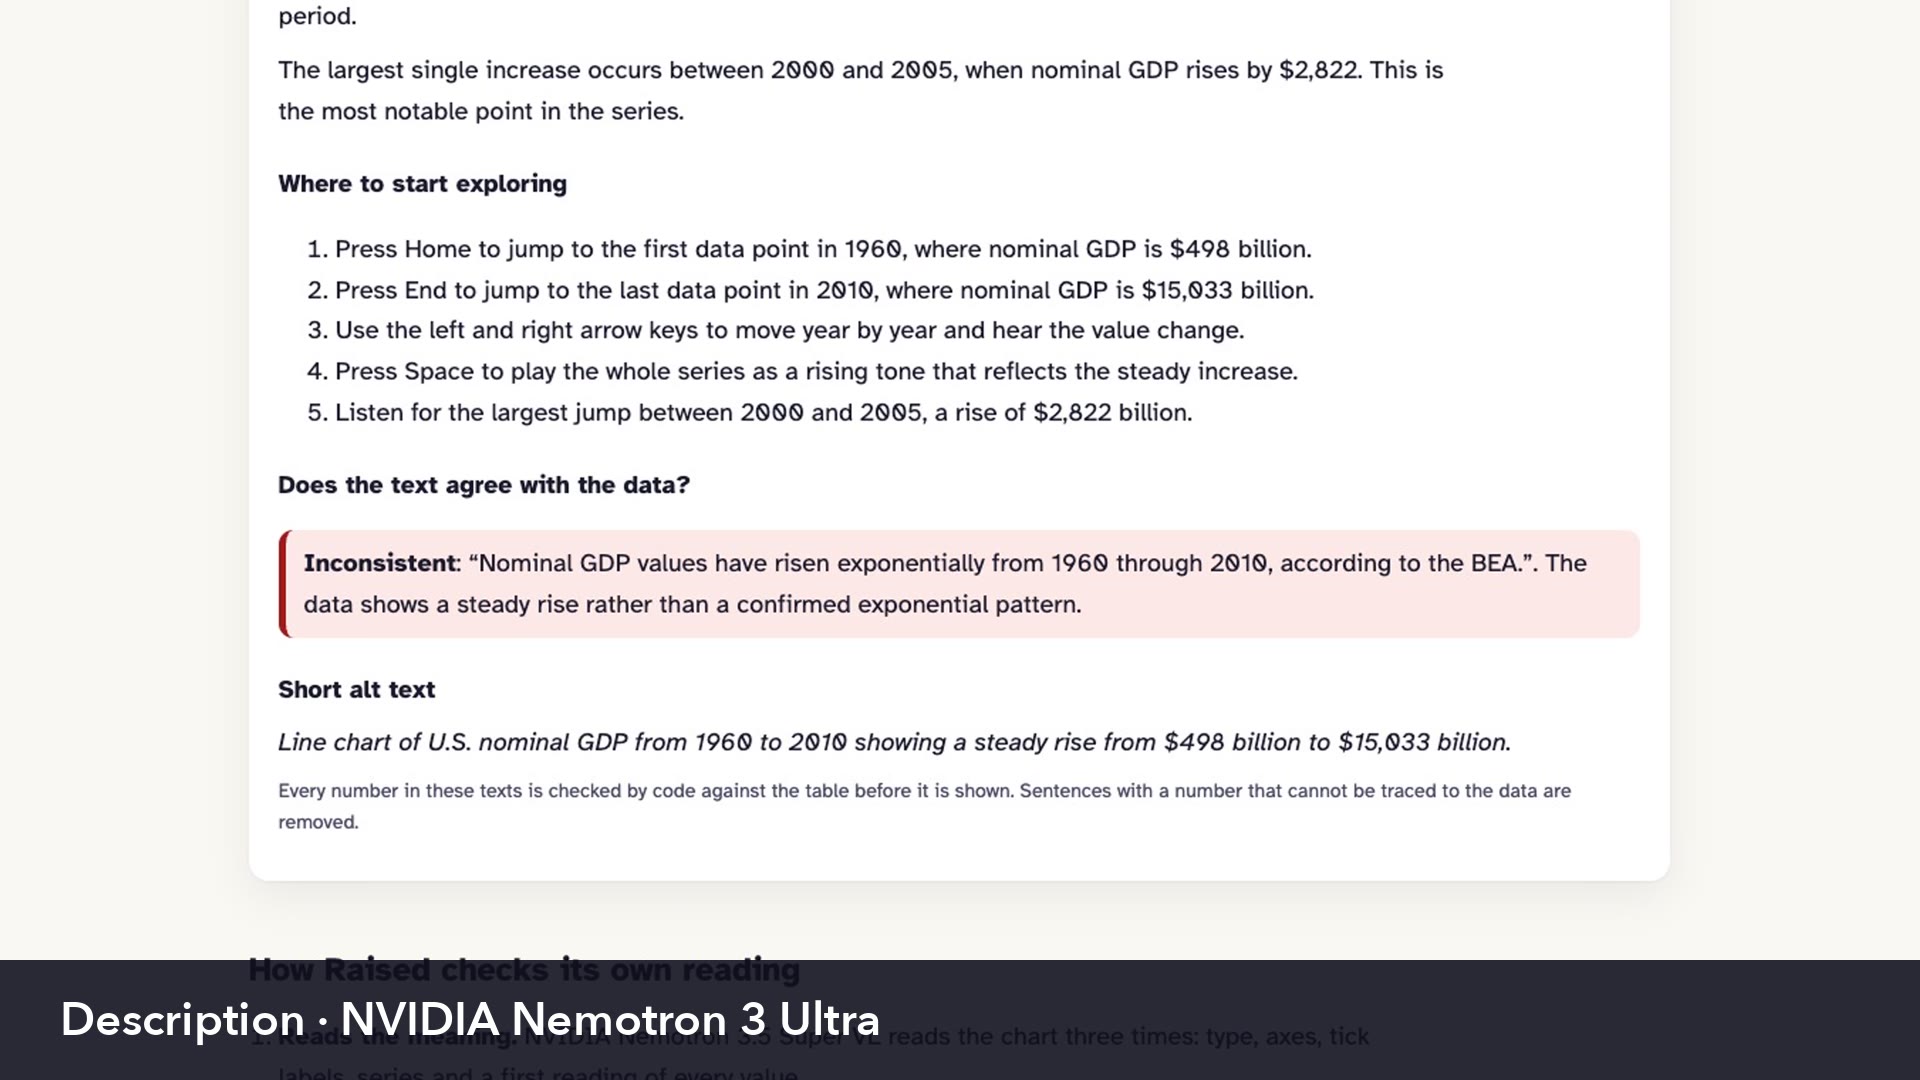
After that, NVIDIA Nemotron 3 Ultra writes a long description and checks each caption from the book against our data. For example, it flagged a caption that called a steady rise exponential. Code then deletes any generated number that is not in our data table, and NVIDIA Nemotron 3.5 Lightning checks that each sentence is supported, shortens labels so they fit in braille and writes alt text. Every model call goes through Nebius Token Factory, everything else is Python, FastAPI, Tesseract OCR, liblouis and Modal.
Challenges we ran into
First of all, lines cross each other or hide behind a legend, so it gets hard to tell which line is which. Second of all, log axes have only a few labels, therefore fitting a scale is much harder. Besides that, braille labels take a lot more space than print, so on a crowded chart they overlap and nobody can read them on paper.
On figures from actual textbooks, one chart returned no usable JSON 3 times in a row. Super VL spent most of its tokens on reasoning, so we raised our output token limit.
Accomplishments that we're proud of
Tactile layouts have 0 label overlaps across 350 test charts. Every output is still marked as a draft, because a certified transcriber has to review it before it goes to a student.
What we learned
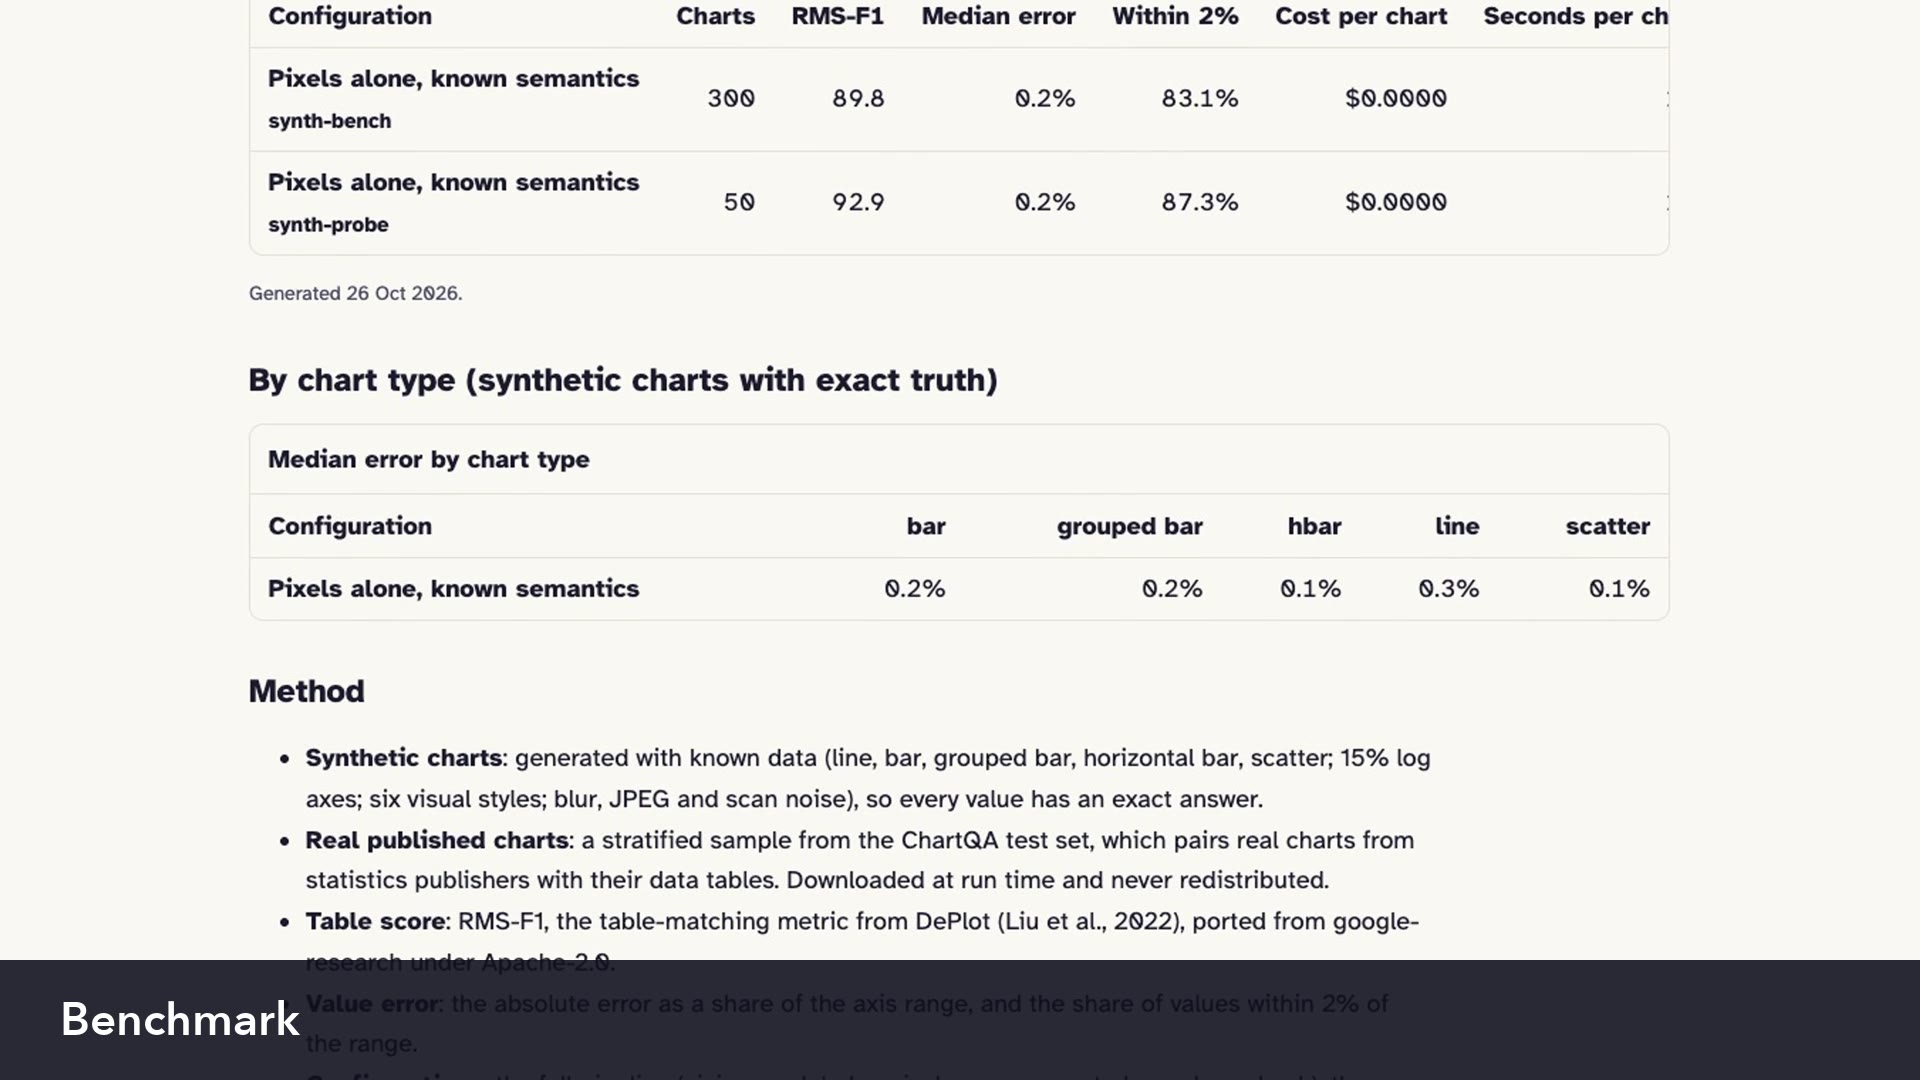
A vision model is really good at understanding what a chart means, however exact numbers need code, because code can be checked. On 300 synthetic charts with known values, pixel measurement alone has a median error of 0.24% of the axis range, while Super VL alone had 0.8% on 10 synthetic charts.
What's next
Next is testing Raised with teachers of visually impaired students and certified transcribers, and adding more chart types.
Log in or sign up for Devpost to join the conversation.