Inspiration
Commercial buildings waste millions of gallons of potable water on cooling towers, toilet flushing, and irrigation — water that could come from rain. But identifying which buildings are worth retrofitting is a manual, time-consuming process. We asked: what if we could scan an entire city and instantly rank every building by its rainwater-reuse viability?
What it does
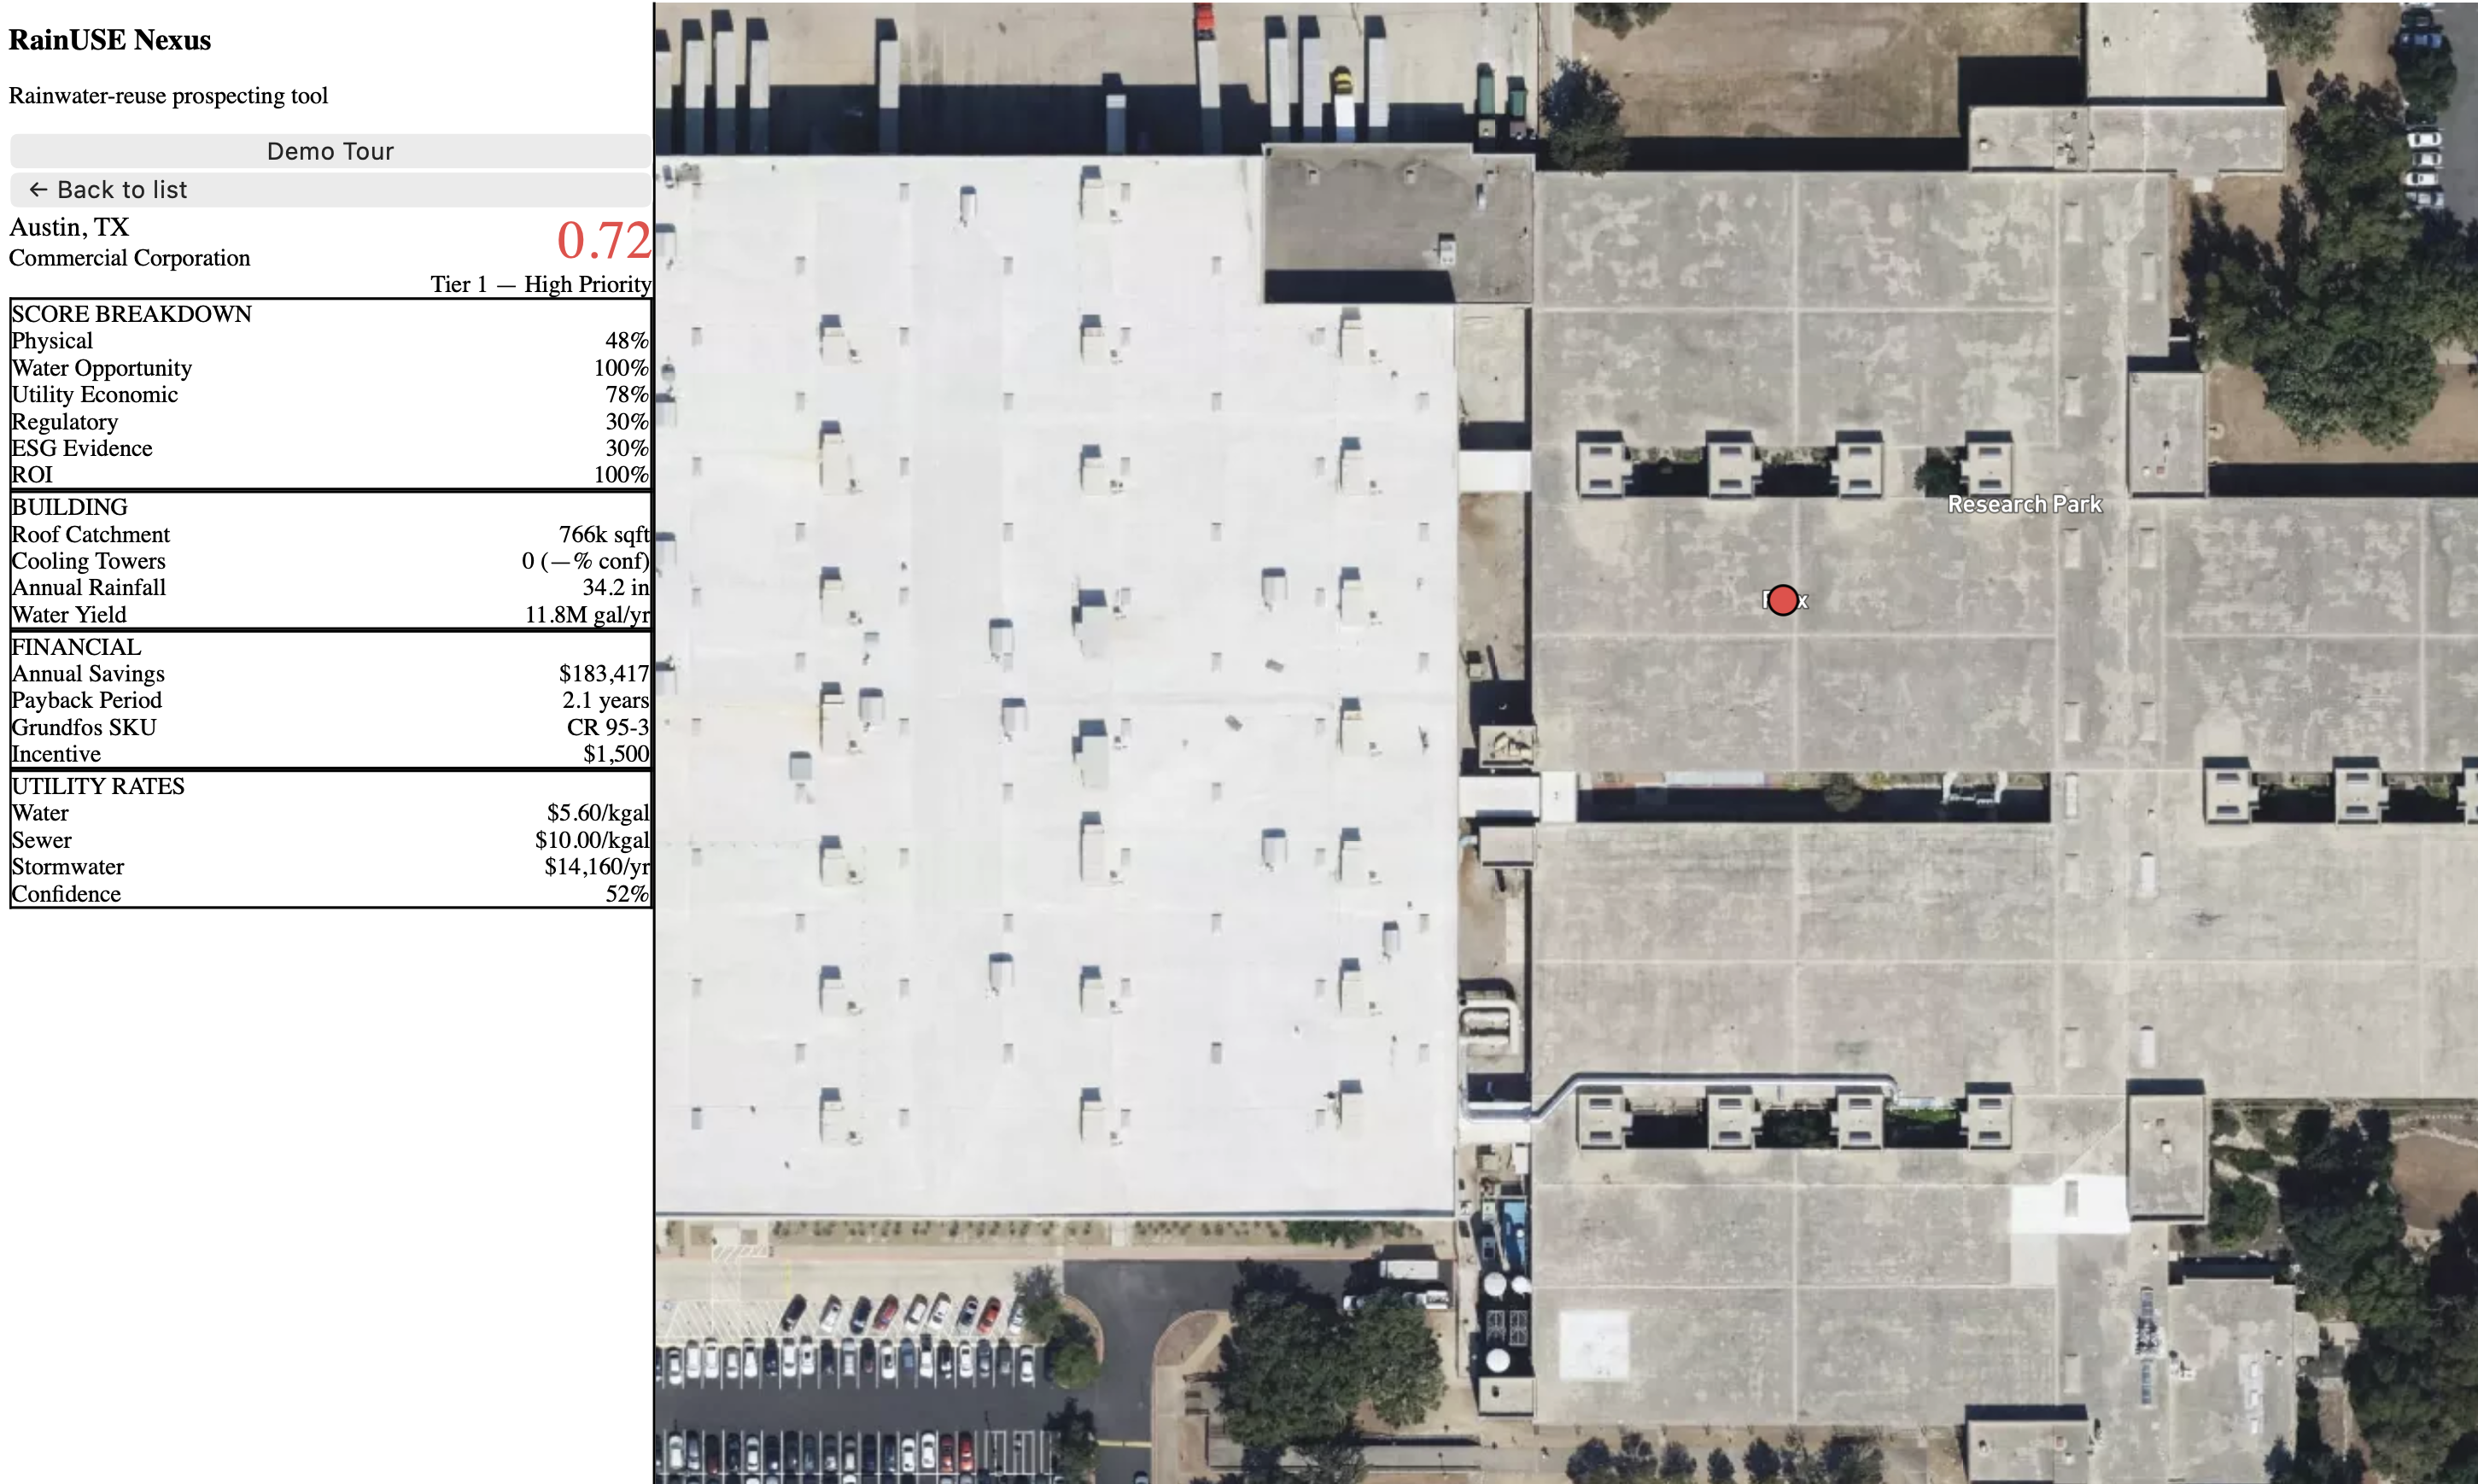
RainUSE Nexus ingests building footprints across entire metro areas (Austin, Tucson, Philadelphia), calculates roof catchment area, estimates annual harvestable rainwater, detects cooling towers from satellite imagery using computer vision, layers in local utility rates and government incentives, and computes a composite Viability Score that ranks buildings by retrofit potential. The result is an interactive map where Grundfos sales teams can explore top prospects, see financial projections (annual savings, payback period), and export shortlists — all from a single dashboard.
How we built it
- Data pipeline: Overture Maps building footprints (568k+ buildings across 3 cities), reprojected to equal-area CRS for accurate roof area calculation
- Computer vision: YOLOv8n trained on hand-labeled Mapbox satellite tiles to detect rooftop cooling towers — a key indicator of large HVAC water demand
- Scoring engine: 6-factor weighted viability model (physical feasibility, water opportunity, utility economics, regulatory incentives, ESG signals, ROI) computed in 3-pass SQL
- Backend: FastAPI + async SQLAlchemy + PostGIS for spatial queries, running on PostgreSQL 16
- Frontend: Next.js + Mapbox GL with satellite imagery, ranked building list, detailed score breakdowns, CSV export, and a 3-city demo tour ## Challenges we ran into
- Training a cooling tower detector with only 48 positive labeled images — we supplemented with 131 negative examples and achieved workable precision (58%) for a proof of concept
- Balancing city coverage: our initial Austin bounding box was too small (5,649 buildings, only 4 flagged). We expanded to full metro coverage (252k buildings, 237 flagged) to match the scale of Tucson and Philadelphia ## Accomplishments that we're proud of
- End-to-end pipeline from raw building polygons to ranked prospects with financial projections in under 2 seconds
- Real CV inference on 413 satellite tiles feeding directly into the scoring engine — not just a mockup
- The top-ranked Austin building shows $183k/year in potential water savings with a 2.1-year payback period
- A working demo tour that automatically flies through 3 cities and highlights the top prospect in each ## What we learned
- Rainwater harvesting economics vary dramatically by city — Philadelphia's high combined water+sewer rates ($14.76/kgal) make it consistently more viable than Tucson despite Tucson's water scarcity
- Object detection on satellite imagery is feasible with small datasets but requires careful negative sampling
- PostGIS + Overture Maps is a powerful combination for rapid urban-scale building analysis ## What's next for RainUSE
- Scale to all US cities with populations over 100k
- Integrate real property ownership data (CoStar, county assessor records) for direct outreach
- Improve the cooling tower detector with more labeled training data and higher-resolution imagery
- Add building-level water consumption estimates from utility billing data
- Build a Grundfos product configurator that auto-specs pump systems based on building characteristics
Built With
- fastapi
- mapbox
- next.js
- postgis
- postgresql
- python
- pytorch
- react
- sqlalchemy
- yolov8

Log in or sign up for Devpost to join the conversation.