-
-
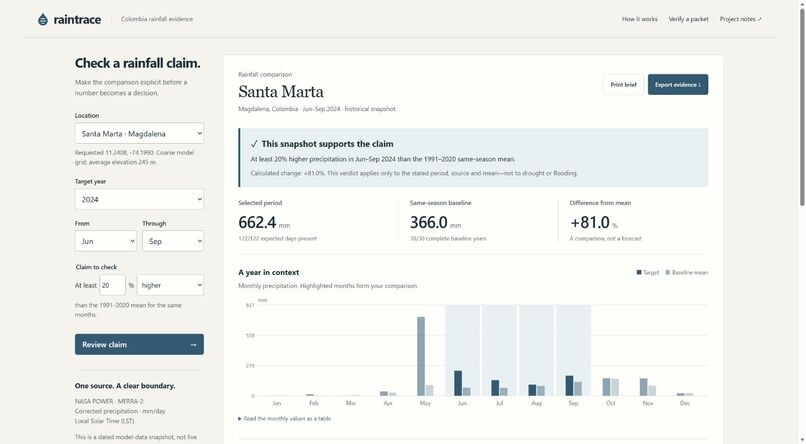
Santa Marta, June–September 2024: a complete historical snapshot supports this specific comparison with the 1991–2020 mean.
Inspiration
A rainfall chart can travel further than its evidence. In a community report, a percentage may lose the date range, baseline, source revision or missing-day checks that made it meaningful. We wanted a small tool that makes those conditions visible and hands the complete calculation to the next reader.
What it does
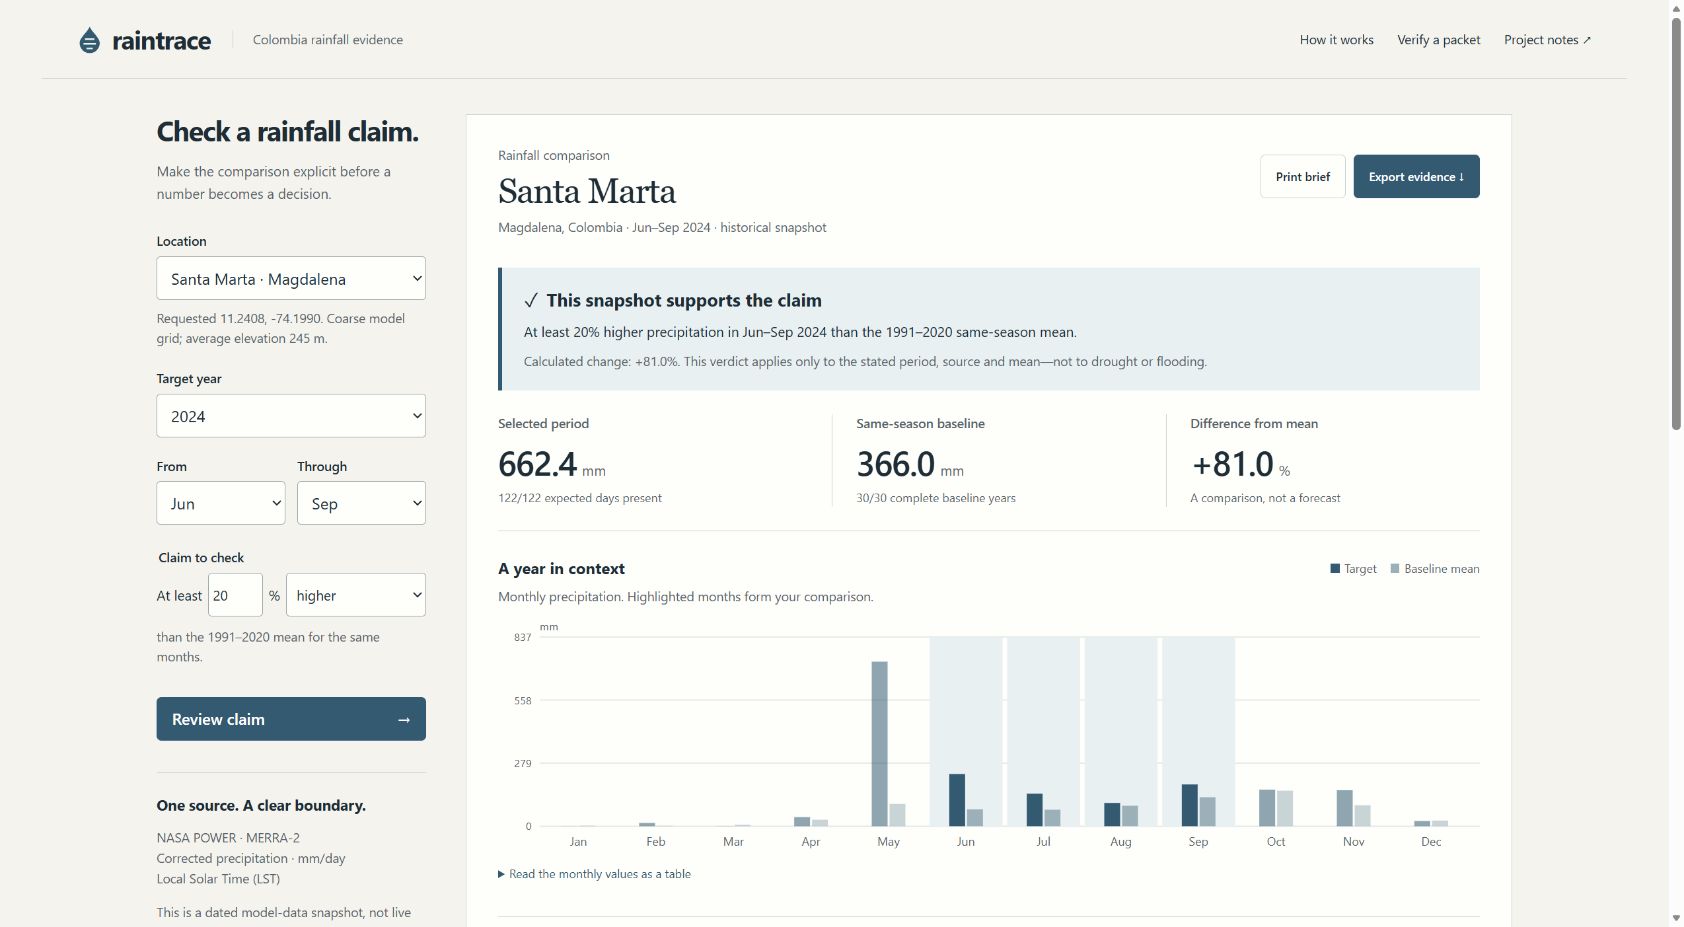
Raintrace checks a specific precipitation claim for Santa Marta or Bogotá against a 30-year same-season baseline. It uses pinned NASA POWER daily MERRA-2 data, lets the user state a direction and threshold, and returns supported, not supported or insufficient evidence. It shows the monthly values, past seasonal spread and source limitations beside the result.
Users can export a printable brief, a daily CSV or a self-contained evidence JSON containing the exact source bytes, settings and calculation. A recipient can verify the source against this release's fingerprint and rerun the calculation in a browser or through the included command-line verifier. A missing-data demonstration makes the abstention behavior visible without altering the original snapshot.
How it is built
A dependency-free JavaScript analysis module runs in both the browser and Node.js. A frozen source catalog binds location, query, retrieval time and source hash. The comparison requires every target day and all 30 baseline seasons to be complete; February 29 is excluded consistently. SHA-256 and canonical JSON link the evidence to the result. All normal use is local to the browser, with no wallet, keys, telemetry or paid inference service.
What is different
The useful unit is a claim with its inspectable evidence, not only another chart. Existing portals cover much broader environmental datasets; Raintrace intentionally focuses on the short handover between a person citing a statistic and a reviewer checking it. It pairs a counter-result and missing-data refusal with the positive example, and supplies the source bytes needed to reproduce the calculation later even if an upstream archive changes.
Challenges
The most consequential errors were treating an absent day as zero rain, comparing inconsistent calendars, and presenting a checksum as scientific validation. The implementation blocks incomplete comparisons, uses a documented matched calendar and states clearly what integrity verification cannot prove. The public-data dependency was tested before the interface was built.
Accomplishments
The local prototype completes source selection → explicit claim → calculation → evidence export → reproduction. Automated tests cover calculation boundaries and source/result tampering, with six reference calculations implemented separately in Python. Real browser checks exercise the contrary verdict, missing-data refusal and packet verification. These checks do not establish station-level accuracy or real-world adoption.
Practical use and next steps
The current audience is students and community researchers preparing an evidence-backed rainfall statement. Two locations and five target years make the prototype easy to audit. Broader adoption would require locally validated station inputs, appropriate quality-control metadata, user studies and reviewed regional interpretation. No water allocation, emergency alert or measured environmental improvement is claimed.
AI and third-party disclosure
Substantial AI coding assistance from OpenAI Codex was used. No generative AI is required at runtime. Data comes from NASA POWER with attribution and source metadata. The application has no blockchain deployment and does not claim that its local fingerprints are blockchain records. New project code was written for this submission.

Log in or sign up for Devpost to join the conversation.