-
-
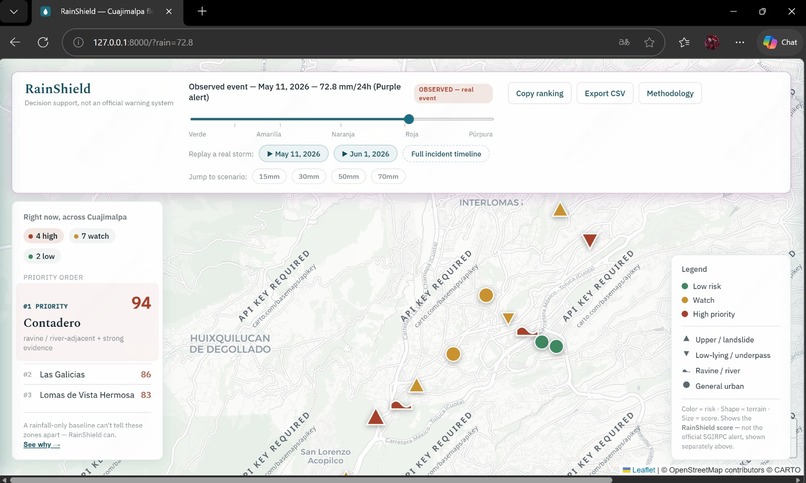
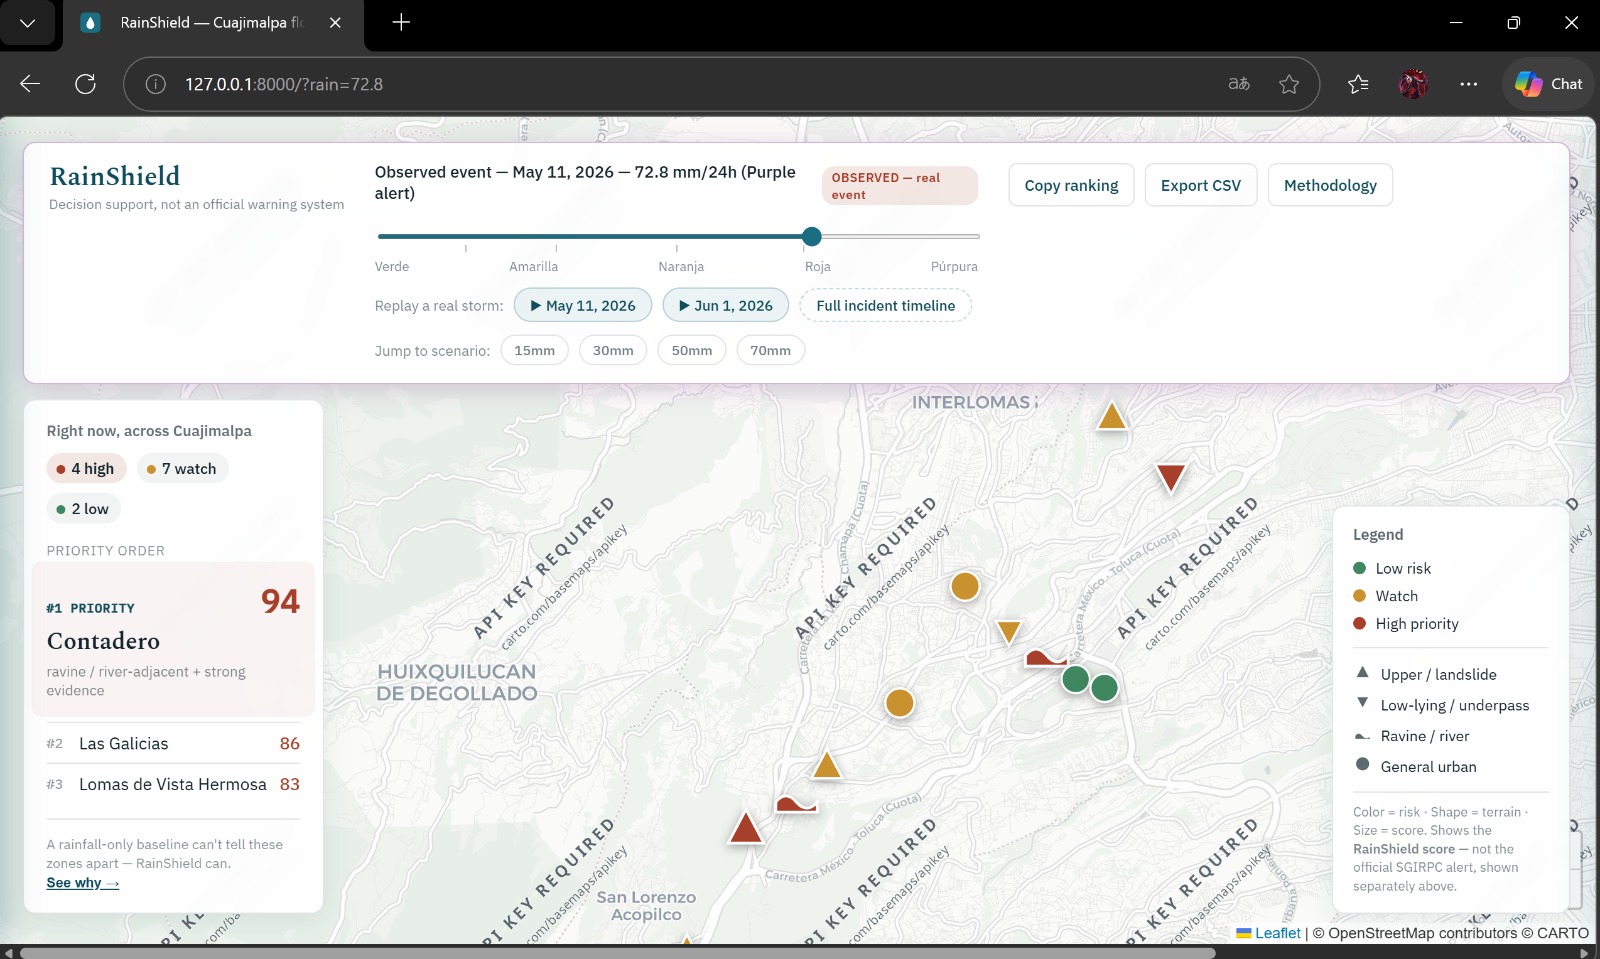
RainShield map of Cuajimalpa at the May 11, 2026 Purple Alert scenario (72.8 mm) — Contadero ranked #1 with score 94
Inspiration
I'm a high school student from Mexico City. Cuajimalpa, one of the city's boroughs, is where the first two Purple Alerts of 2026 started: 72.8 mm of rain on May 11 and 80 mm on June 1. The city's rain alert scale goes from Green to Purple.
Floods have been documented in about 40% of the borough's 64 localities, and clearing a reported clogged storm drain can take up to 72 hours. When heavy rain is coming, someone has to decide which colonias (neighborhoods) to check or help first. There is no simple local tool that tells you that in seconds for a given rainfall scenario.
I built RainShield for the Earth Forward track. Extreme rain is a local climate resilience problem: neighborhoods have to adapt to it, and adapting starts with knowing which places need attention first.
What it does
RainShield is an interactive web map of flood and landslide risk for 13 real zones (colonias) in Cuajimalpa. You choose a rainfall scenario and it shows which zones to prioritize, why, what evidence supports it, and what actions make sense.
- Rain slider: 0 to 100 mm per 24 hours (0.1 mm steps), mapped to the official alert levels of Mexico City's civil protection agency (SGIRPC): Green, Yellow, Orange, Red and Purple.
- Priority ranking: it reorders as you move the slider.
- Zone detail panel: risk score, a breakdown (terrain, incident history, severe-incident flag and rain factor), the evidence behind the score, a plain-language explanation, and recommended actions for that risk level.
- Storm replay: two real events, May 11 (72.8 mm) and June 1 (80 mm).
- Incident timeline: documented incidents from 2013 to 2026.
- Baseline comparison: a rain-only ranking next to the RainShield score.
- CSV export of the ranking.
RainShield is a decision-support prototype, not an official alert system.
How I built it
The backend is FastAPI (Python) and the frontend is plain HTML, CSS and JavaScript with Leaflet for the map. It runs locally with uvicorn, and the repo includes a Dockerfile.
The main score is a rule-based index that I can explain step by step. Each zone has a base profile made from its terrain, its documented incident history and a flag for severe past events. The rainfall scenario is applied on top of that profile through a rain factor, and the app shows every part in the breakdown. I also trained a small logistic regression (scikit-learn) as a secondary signal. With only 13 zones I checked it with leave-one-out validation, and I don't treat it as the main answer.
The incidents and sources come from public information (gob.mx pages and news reports). The project has 42 automated tests and a GitHub Actions workflow.
Limitations:
- It covers only 13 zones, not all of Cuajimalpa.
- The coordinates of each zone are approximate.
- The model is tiny (13 data points), so it is only a secondary signal.
- The incident history only includes what was publicly reported.
- It doesn't forecast rain: you choose the scenario.
- It is not an official alert system and shouldn't replace the decisions of civil protection authorities.
- It isn't deployed online; you run it locally.
Challenges I ran into
- Very little data. 13 zones is too few to trust a machine learning model on its own, so the rule-based index is the main score and the logistic regression is only a secondary signal, checked with leave-one-out validation.
- Turning a slider into official alert levels. The slider moves in 0.1 mm steps, so I had to handle edge cases at the boundaries between levels. I also had to fix score-cap bugs and race conditions, and I wrote automated tests and set up GitHub Actions to catch that kind of bug.
- Making the result useful, not just a number. Someone making a decision needs to know why a zone is ranked first, so each result comes with a breakdown, evidence and recommended actions.
- Using only sourced data. I built the incident history from gob.mx pages and news reports, so it only includes incidents I could source.
Accomplishments that I'm proud of
- I finished a complete tool: backend, interactive map, ranking, storm replay, incident timeline, CSV export and tests.
- It's built around real events: the replays use the May 11 and June 1 storms, and the timeline covers incidents from 2013 to 2026.
- Every result explains itself with a breakdown, evidence and recommended actions, so it isn't a black box.
- The baseline comparison shows how a rain-only ranking differs from RainShield's score.
- Automated tests, GitHub Actions and a Dockerfile make it easier for others to run and check it.
What I learned
- How to build a full-stack app with FastAPI and Leaflet and connect the backend to the map.
- How Mexico City's rain alert levels work and how to turn them into a slider scenario.
- That small data changes how you use machine learning: with 13 zones, leave-one-out validation and a simple index I can explain were more useful than a complicated model.
- How to test edge cases: score caps, boundary values and race conditions are easy to miss when you only click around the app.
- That a decision-support tool should show its reasons, not only a score.
What's next for RainShield
- Add more colonias beyond the current 13 and replace the approximate coordinates with more precise locations.
- Put a live version online so people can try RainShield without running it locally.
- Compare the ranking against future storms and new incident reports, and adjust the score if it doesn't hold up.


Log in or sign up for Devpost to join the conversation.