-
-
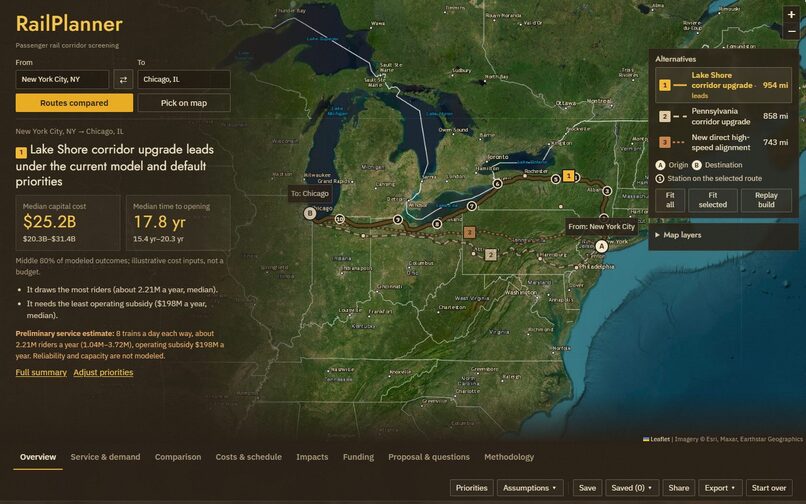
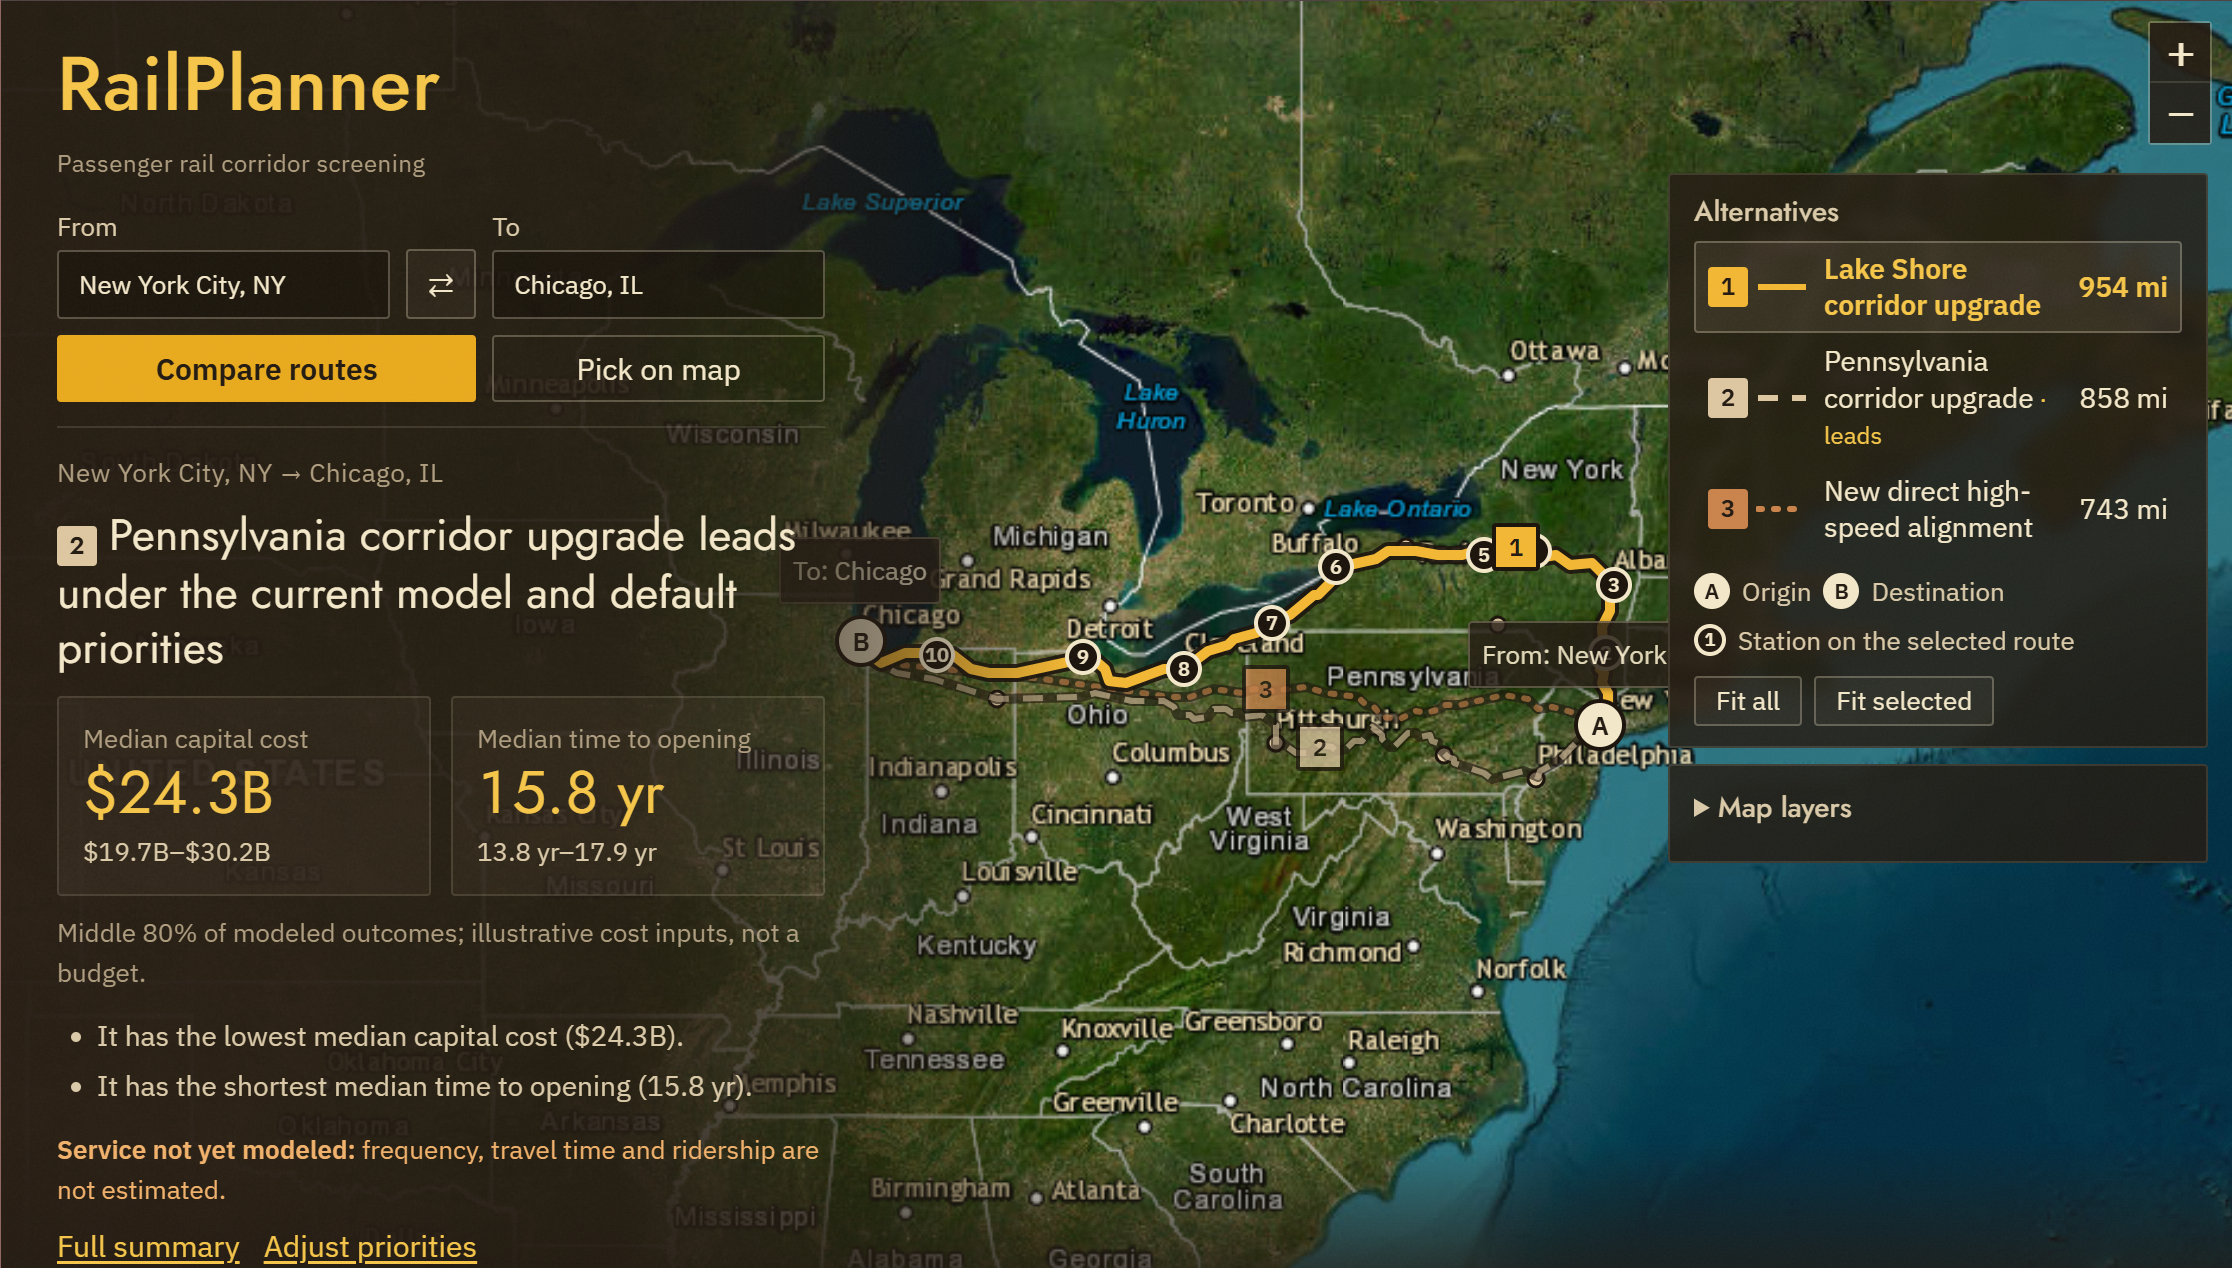
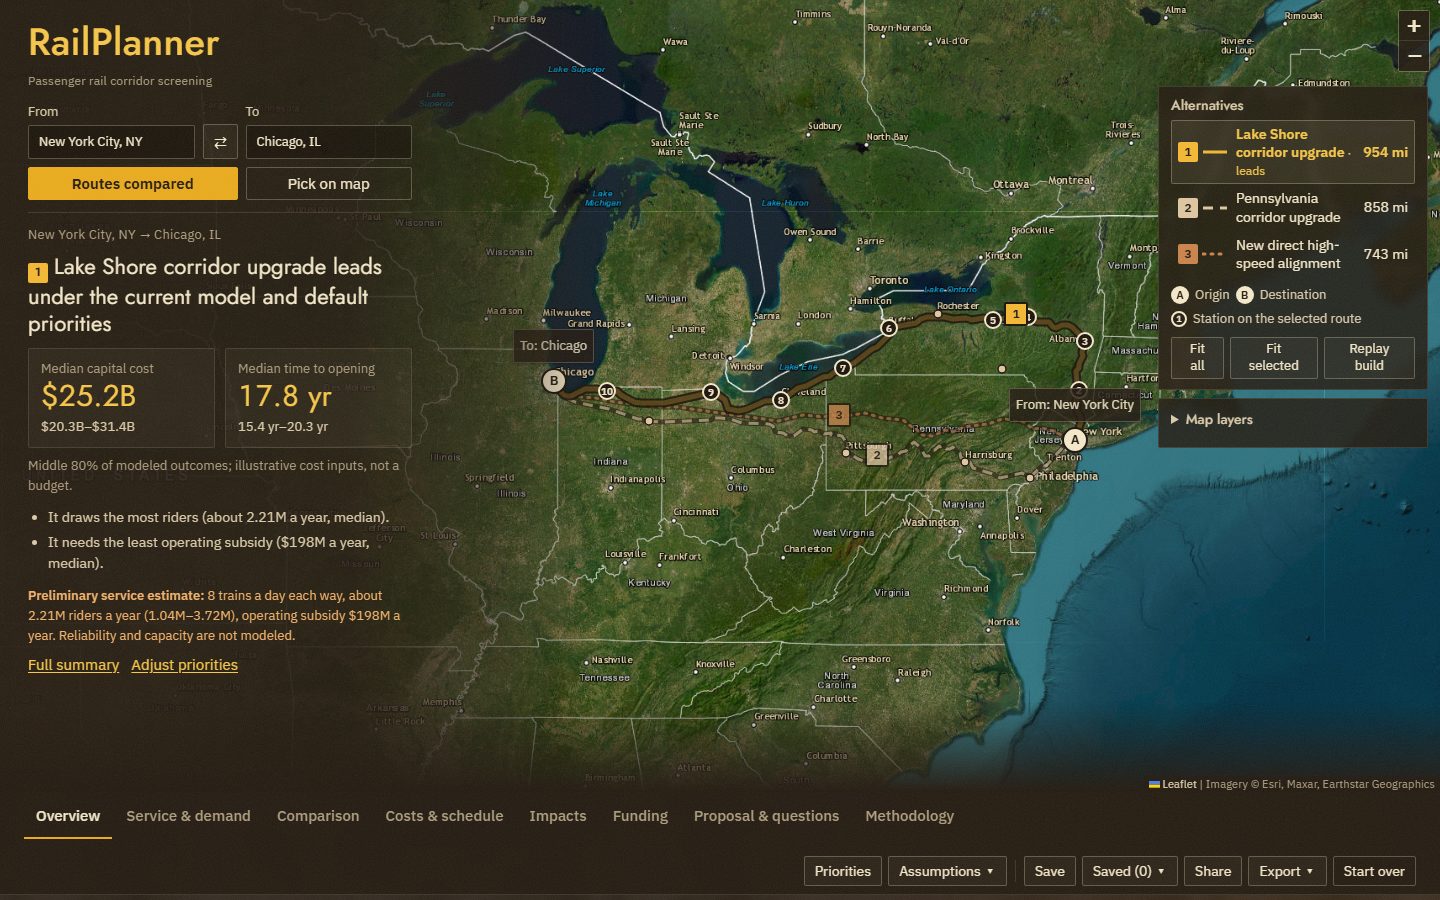
The map hero: three alternatives on satellite imagery, with the decision summary on a translucent overlay
-
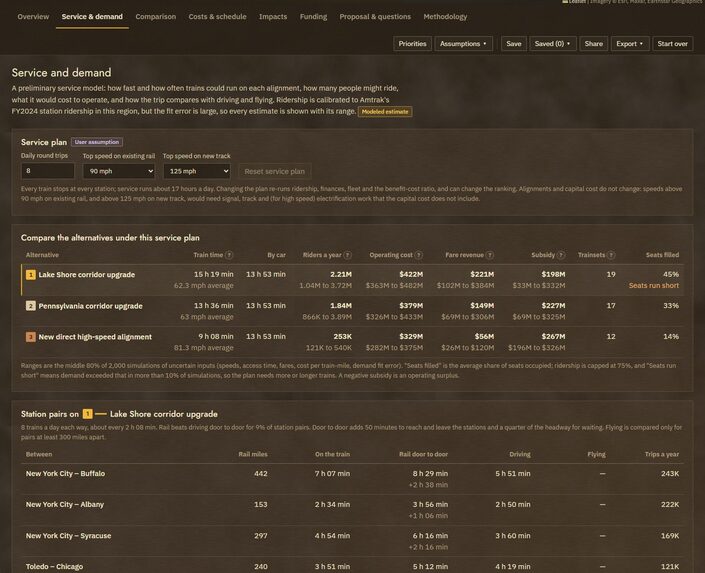
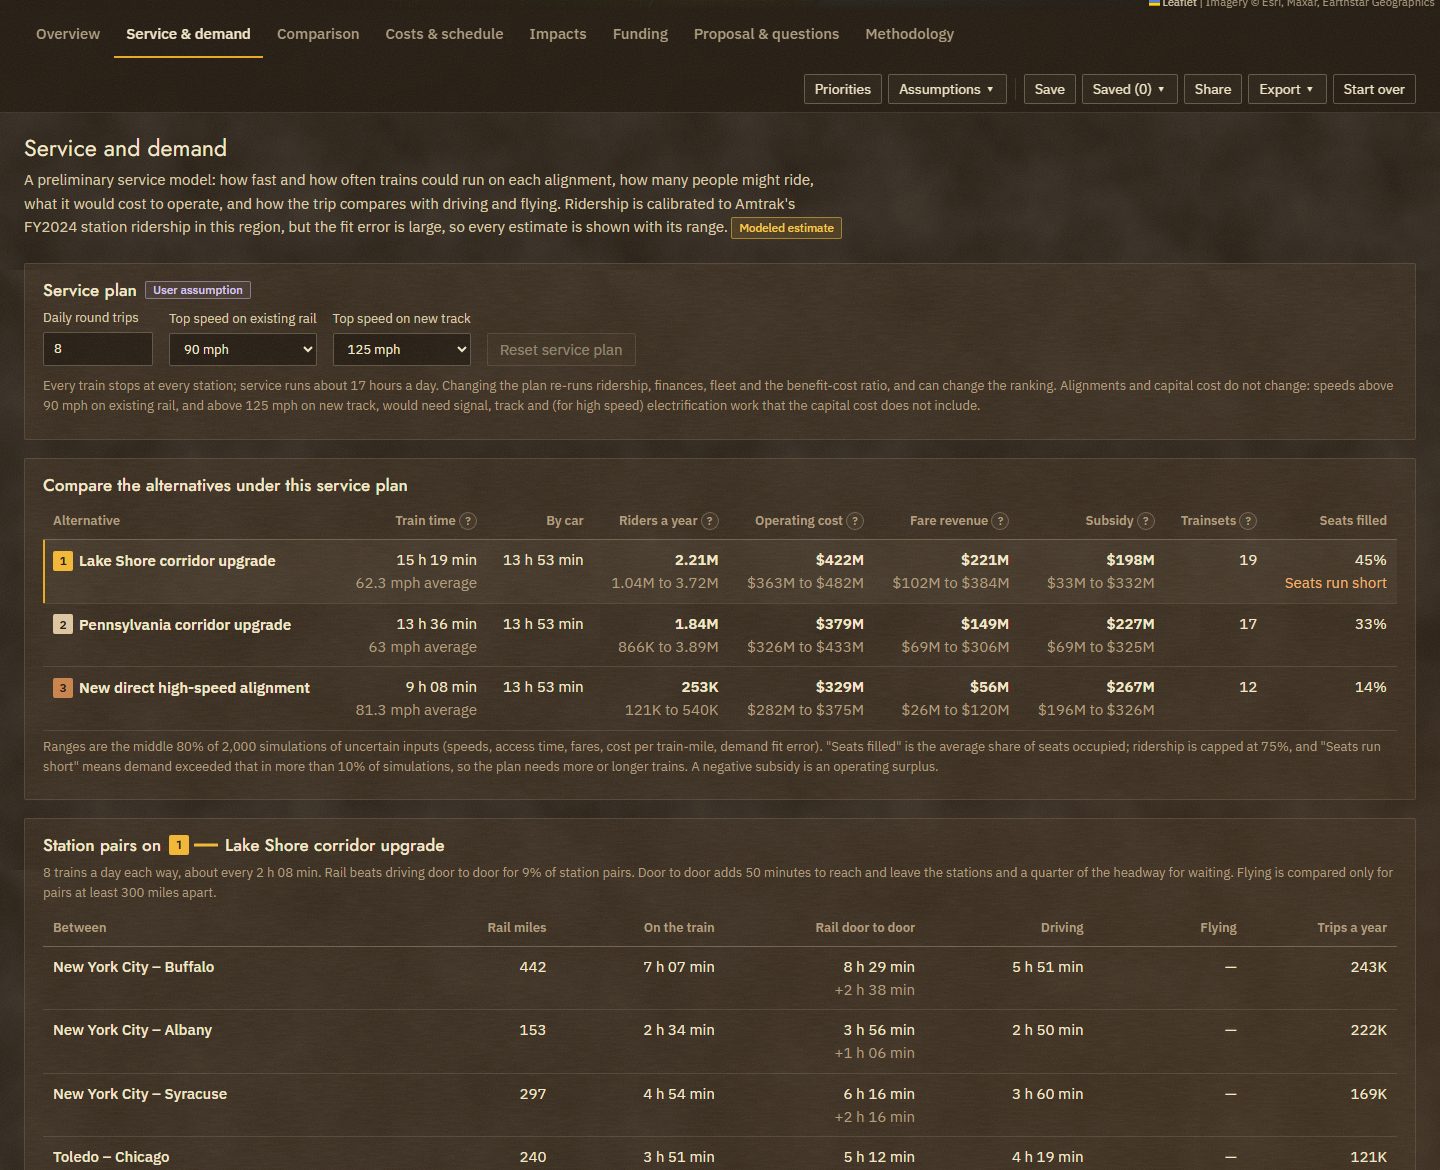
Service & demand: train times, riders, operating cost, subsidy and fleet for each alternative
-
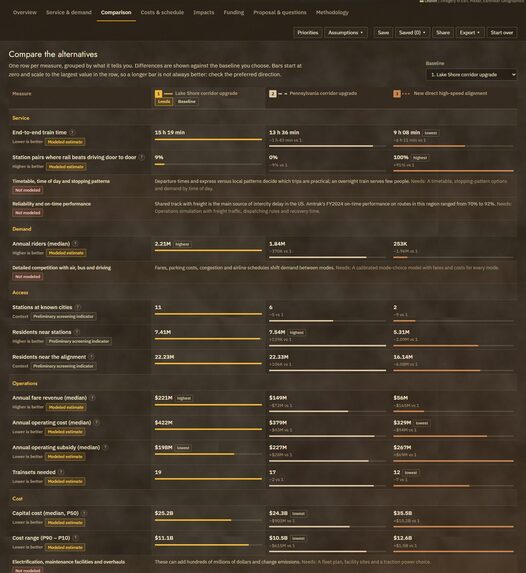
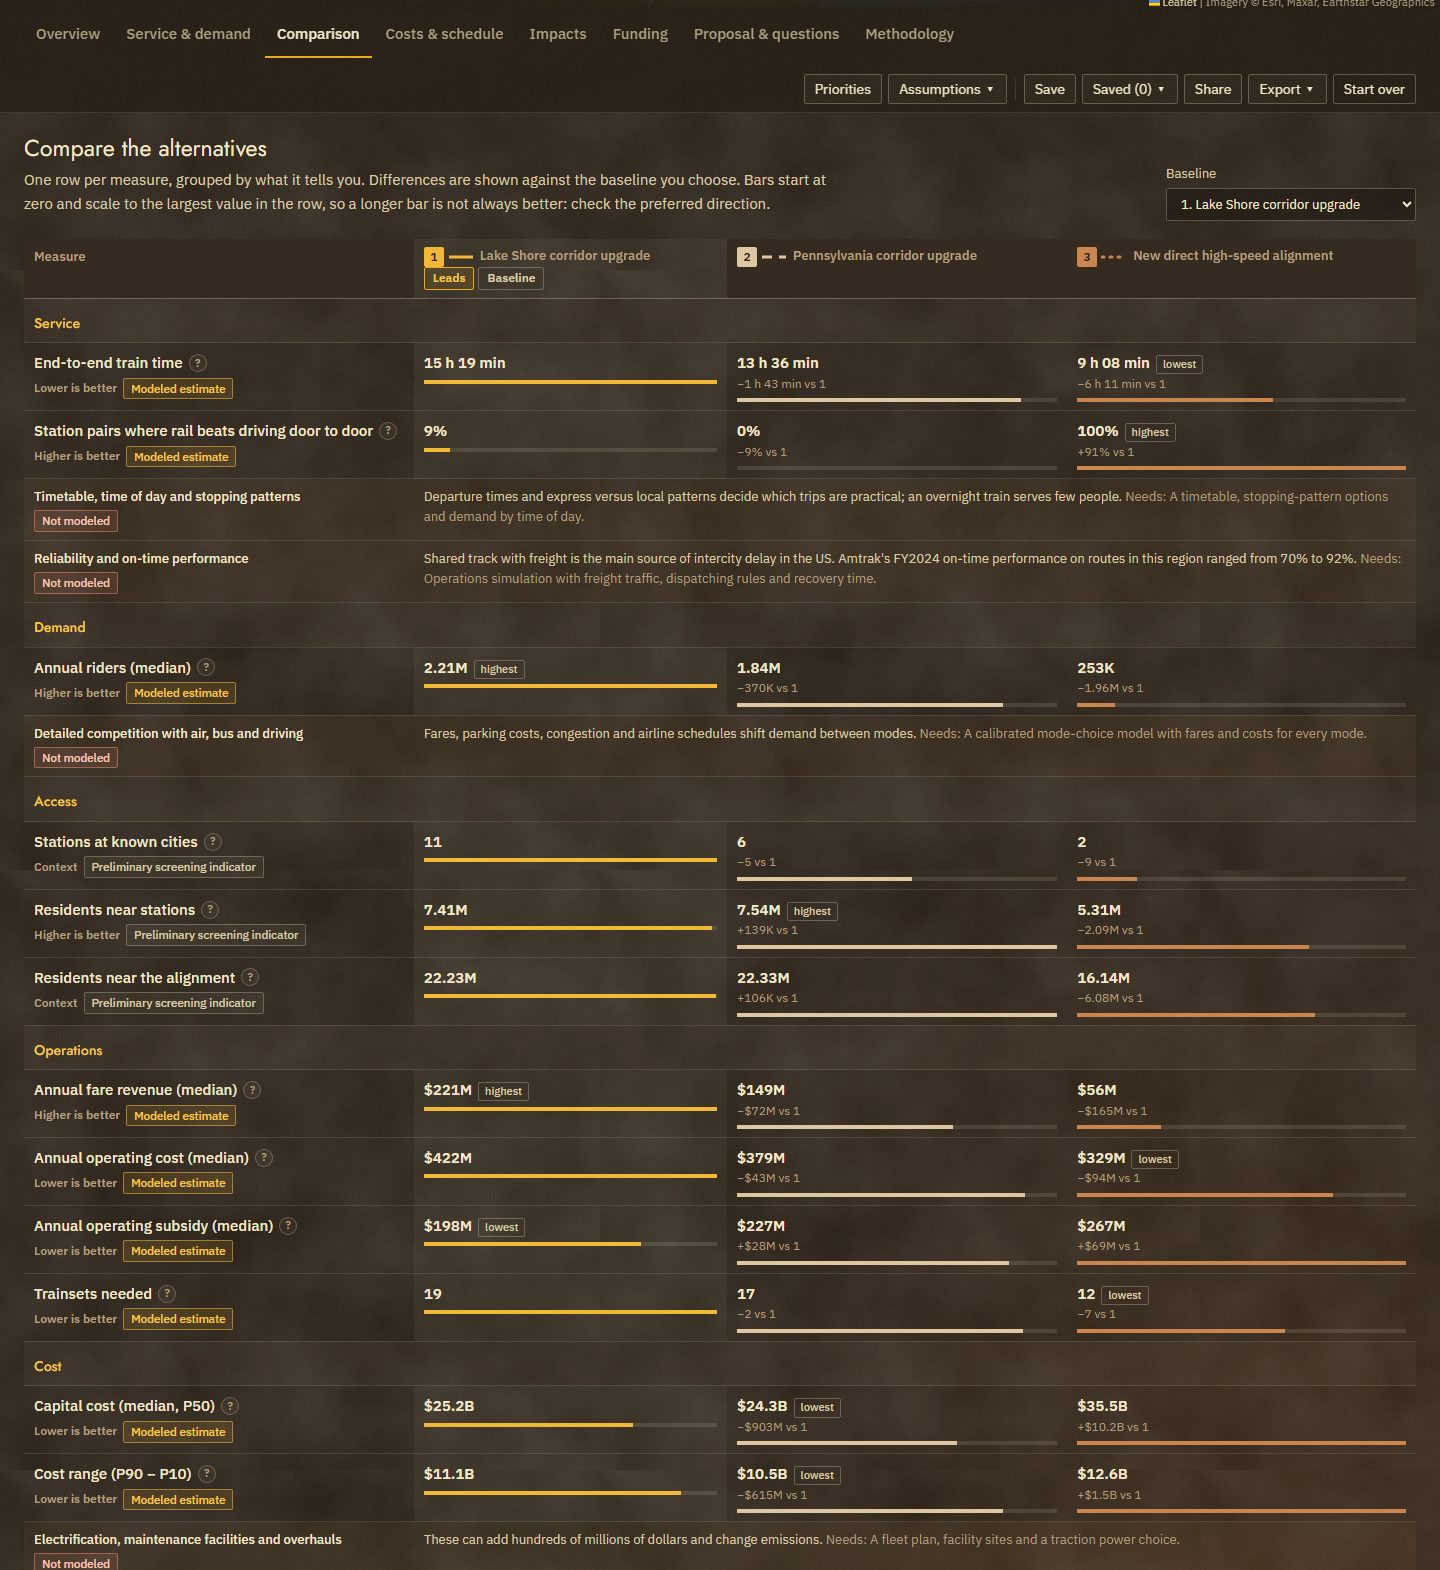
Comparison: every measure grouped, with preferred direction and how each figure was produced
-
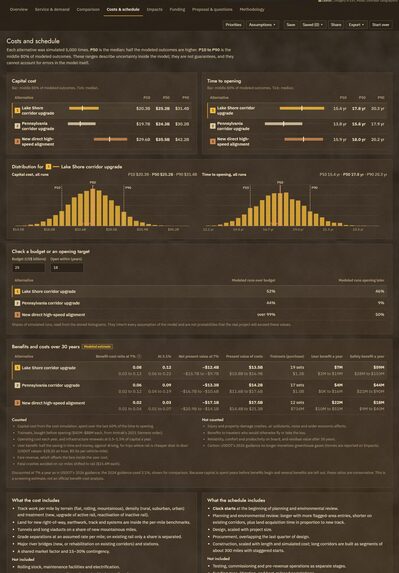
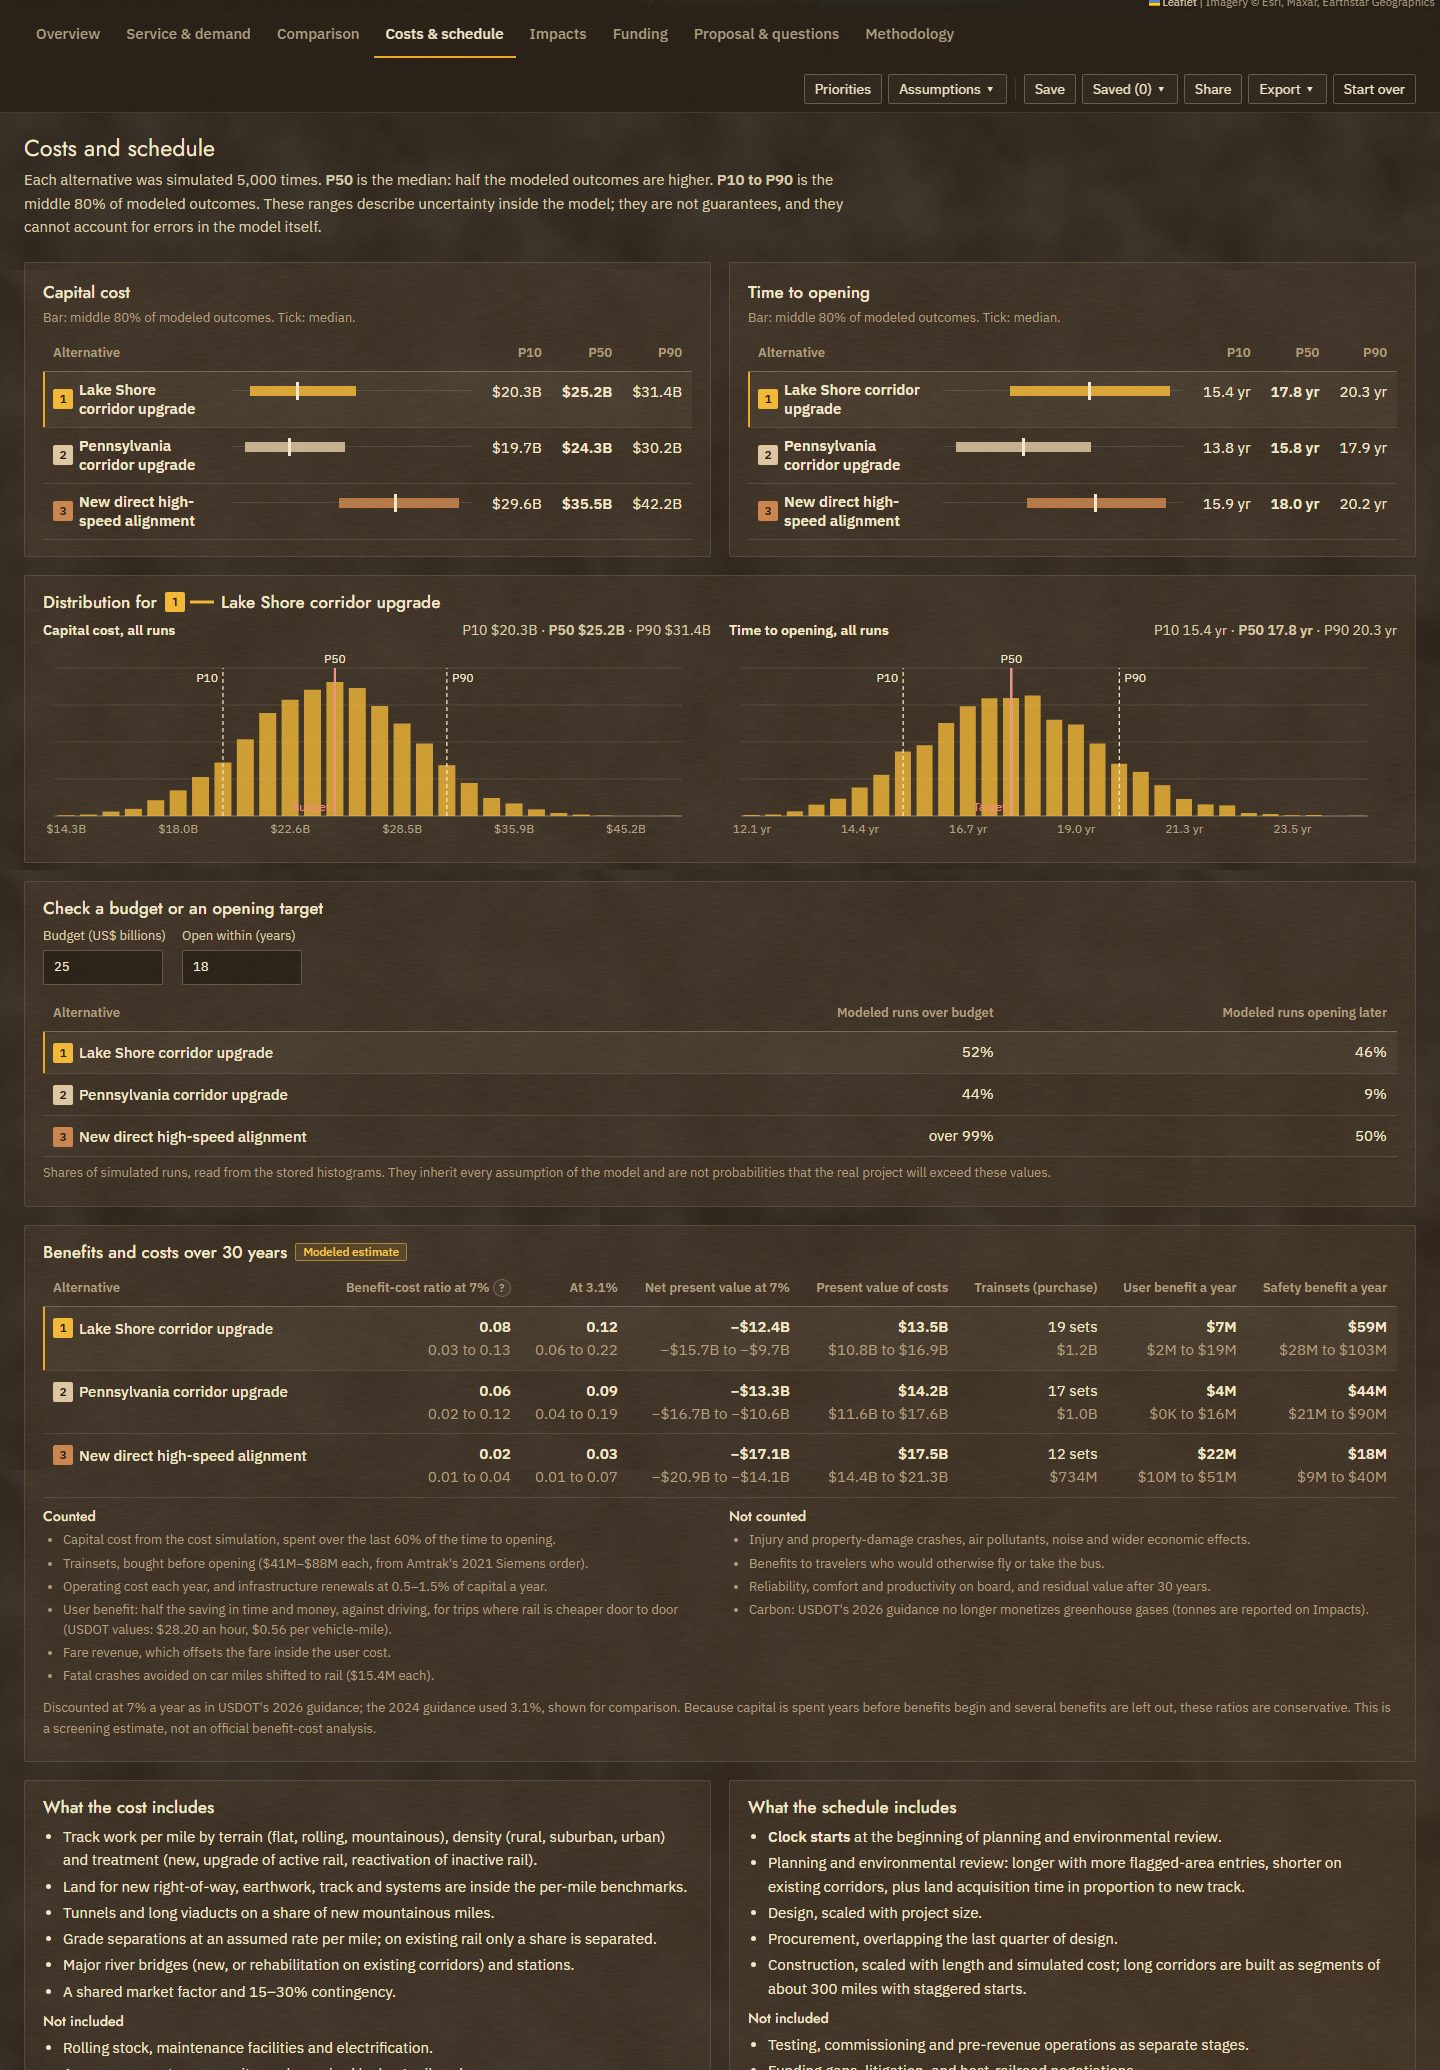
Costs & schedule: P10/P50/P90 ranges, 5,000-run histograms from TimescaleDB, and 30-year benefits and costs
Inspiration
When we think of steampunk, the first thing that comes to mind is trains; the whole aesthetic wouldn't be complete without the feel of fast and robust railroads. However, it makes sense that this is usually confined to Victorian-inspired eras; the US doesn't have a high-speed rail line that can traverse states in ample time, unlike most of Europe. It's possible to take a train from one country to the next while hitting all major cities along the way. We decided to focus on the most viable options that can be made to establish a high-speed rail from one major city to another in the US. Specifically, it is to aid the federal and state transit departments in facilitating the best plan based on manufacturing cost, speed, and timeline.
What it does
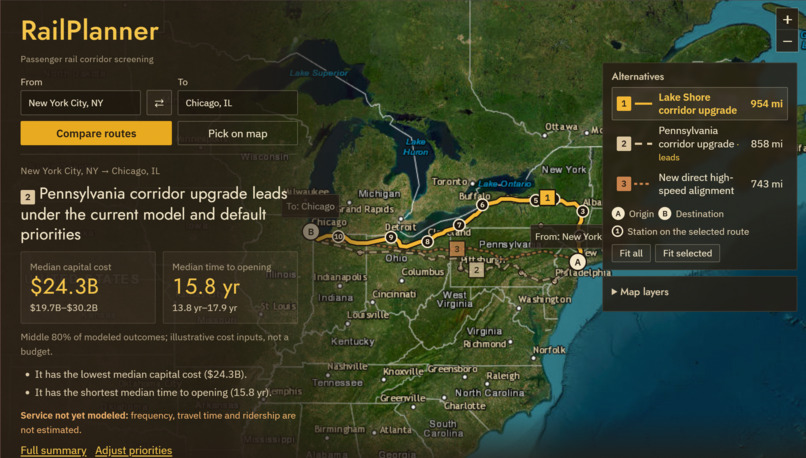
Pick two of 17 cities between New York/Philadelphia and Chicago. RailPlanner treats the region as a 1 km grid of nodes scored from real data on active and abandoned railroads, terrain, population and protected land, and runs a Dijkstra-style least-cost search to draw three alternatives on a satellite map: upgrade existing rail, a new direct line, and a route through intermediate cities. The track is animated being laid mile by mile.
Cost and schedule, 5,000 times per alternative: the median plus the middle 80% of outcomes, never a single made-up number. Service estimates: train times, door-to-door trips against driving and flying, annual riders, fare revenue, operating subsidy, trainsets, CO2, road deaths avoided and a 30-year benefit-cost ratio. Ridership is calibrated to Amtrak's real FY2024 ridership. Change trains per day or top speed and everything re-runs. Ranked by your priorities: sliders for cost, delivery, riders, train time, subsidy and environment; the ranking explains why the leader changes. Federal funding guide: six programs checked against official FRA and USDOT pages, with applicants, match, status, sources and next steps. A Gemini-drafted proposal that cannot invent numbers: every figure is checked against our computed results. Ask questions and get short, sourced answers. Shows its work: every figure is labeled (Observed, Modeled estimate, Screening indicator, User assumption, Not modeled) with its source, year, method and limits. Save, share and export: share links, saved scenarios, and PDF, HTML and CSV reports.
Example, New York → Chicago: upgrading the Lake Shore route leads under the default priorities: about $25.2B and 17.8 years to open, roughly 2.2M riders a year and a $198M yearly operating subsidy. The new direct high-speed line is 6 hours faster on the train but draws only about 250K riders, because with no stops in between it competes head-on with a roughly 5-hour flight. Speed alone doesn't make a useful corridor; the cities in between do.
How we built it
- Data and scoring: rail lines (BTS national rail network, active and abandoned), 2020 Census tracts, USGS elevation and protected areas (PAD-US), and Natural Earth water were pulled, pruned to the region and rasterized onto a 1 km grid. Each cell (node) gets a cost from slope, existing rail (discounted), protected land and floodplain (penalized), rivers (bridge penalty), population and length; each alternative weights these differently. scikit-image finds the least-cost paths.
- The money part: per-mile cost by terrain, density and track type (new, upgrade, reactivation), plus tunnels, grade separations, bridges, stations, a market factor and 15–30% contingency, simulated 5,000 times. The runs go into Tiger Data: a TimescaleDB hypertable (bulk-loaded with COPY) and a continuous aggregate that keeps cost and duration histograms, from which we read P10/P50/P90. PostGIS stores route geometry.
- Service model: a gravity demand model fitted to Amtrak FY2024 boardings at 12 stations; fares and operating costs from Amtrak's FY2024 route results; benefit-cost values from USDOT's 2026 guidance; a second Monte Carlo (2,000 runs) for ranges.
- Gemini: receives only figures we computed and returns structured JSON sections. A number-check guardrail rejects any number not in our results, retries once, then falls back to a template.
- Frontend: React, TypeScript and Vite; Leaflet for the satellite map, p5.js for the track-building animation, Recharts for histograms.
- Deployment: Docker Compose on a Vultr VM, with Caddy, nginx and a FastAPI API.
Challenges we ran into
The densest part of the project involved gathering and pruning the correct data. A lot of data on railroad tracks is provided by each state government's transit department. However, the given data varies a lot. Oftentimes, we would have to make sure we could find and merge more data so that our scale for scoring could be applied to each node.
Since we are dealing with multiple big datasets, there were specified API limitations on some of our sources, like Overpass. The best way to bypass this was to make and export the datasets from queries instead of just relying on an API.
- Keeping the AI honest: Gemini would round, add or invent figures; the number check, structured output and template fallback fixed that.
- Our first ridership model was badly wrong: it forecast 3.7M New York–Chicago riders because it only compared trains with cars. Adding flying as a competitor and capping riders at the seats offered brought it in line with reality.
- Misleading metrics: "population served" counted people near the track with no station, so we split it into residents near the line and near stations.
Accomplishments that we're proud of
- A ridership model calibrated to real Amtrak data that shows its own error, station by station.
- AI-written proposals where every number is verified against computed results.
- Real use of TimescaleDB hypertables and continuous aggregates for simulation results.
- Honesty built into the interface: ranges, sources, status labels and a clear list of what isn't modeled.
What we learned
- Uncertainty is the product: planners need ranges and sources more than a single answer.
- Rail questions are really service questions: how often trains run, how fast door to door, and between which cities matters more than cost per mile.
- Language models are most useful when they write words around numbers they are not allowed to change.
What's next for RailPlanner
We exclusively focused on the Northeast region of the United States in order to make implementation viable within the 36-hour timeline. Given more time, we would like to expand past the region and give viable plans for a cross-country high-speed rail. We would also calibrate costs to real project data, add timetables and an operations simulation for reliability and capacity on freight-owned track, and improve demand with station-pair data and fares.
RailPlanner is a screening tool: costs use illustrative benchmarks and service estimates are preliminary. It is built to decide what deserves a real study, not to replace one.
Built With
- caddy
- docker
- fastapi
- gemini
- geopandas
- leaflet.js
- nginx
- numpy
- p5.js
- postgis
- postgresql
- python
- react
- recharts
- scikit-image
- scipy
- shapely
- tiger-data
- timescaledb
- typescript
- vite
- vultr

Log in or sign up for Devpost to join the conversation.