-
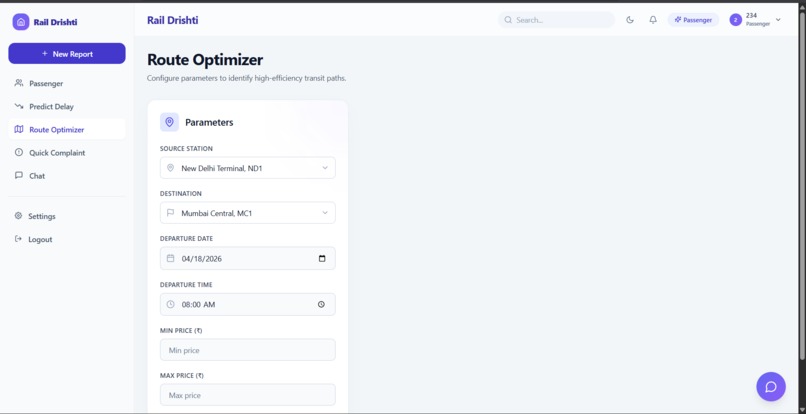
Features
-
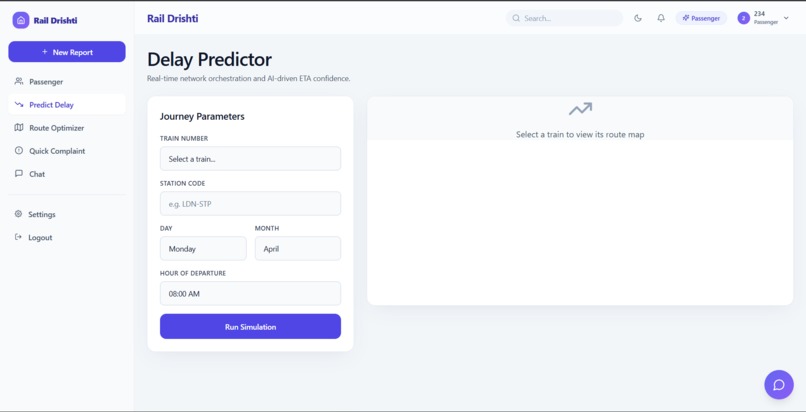
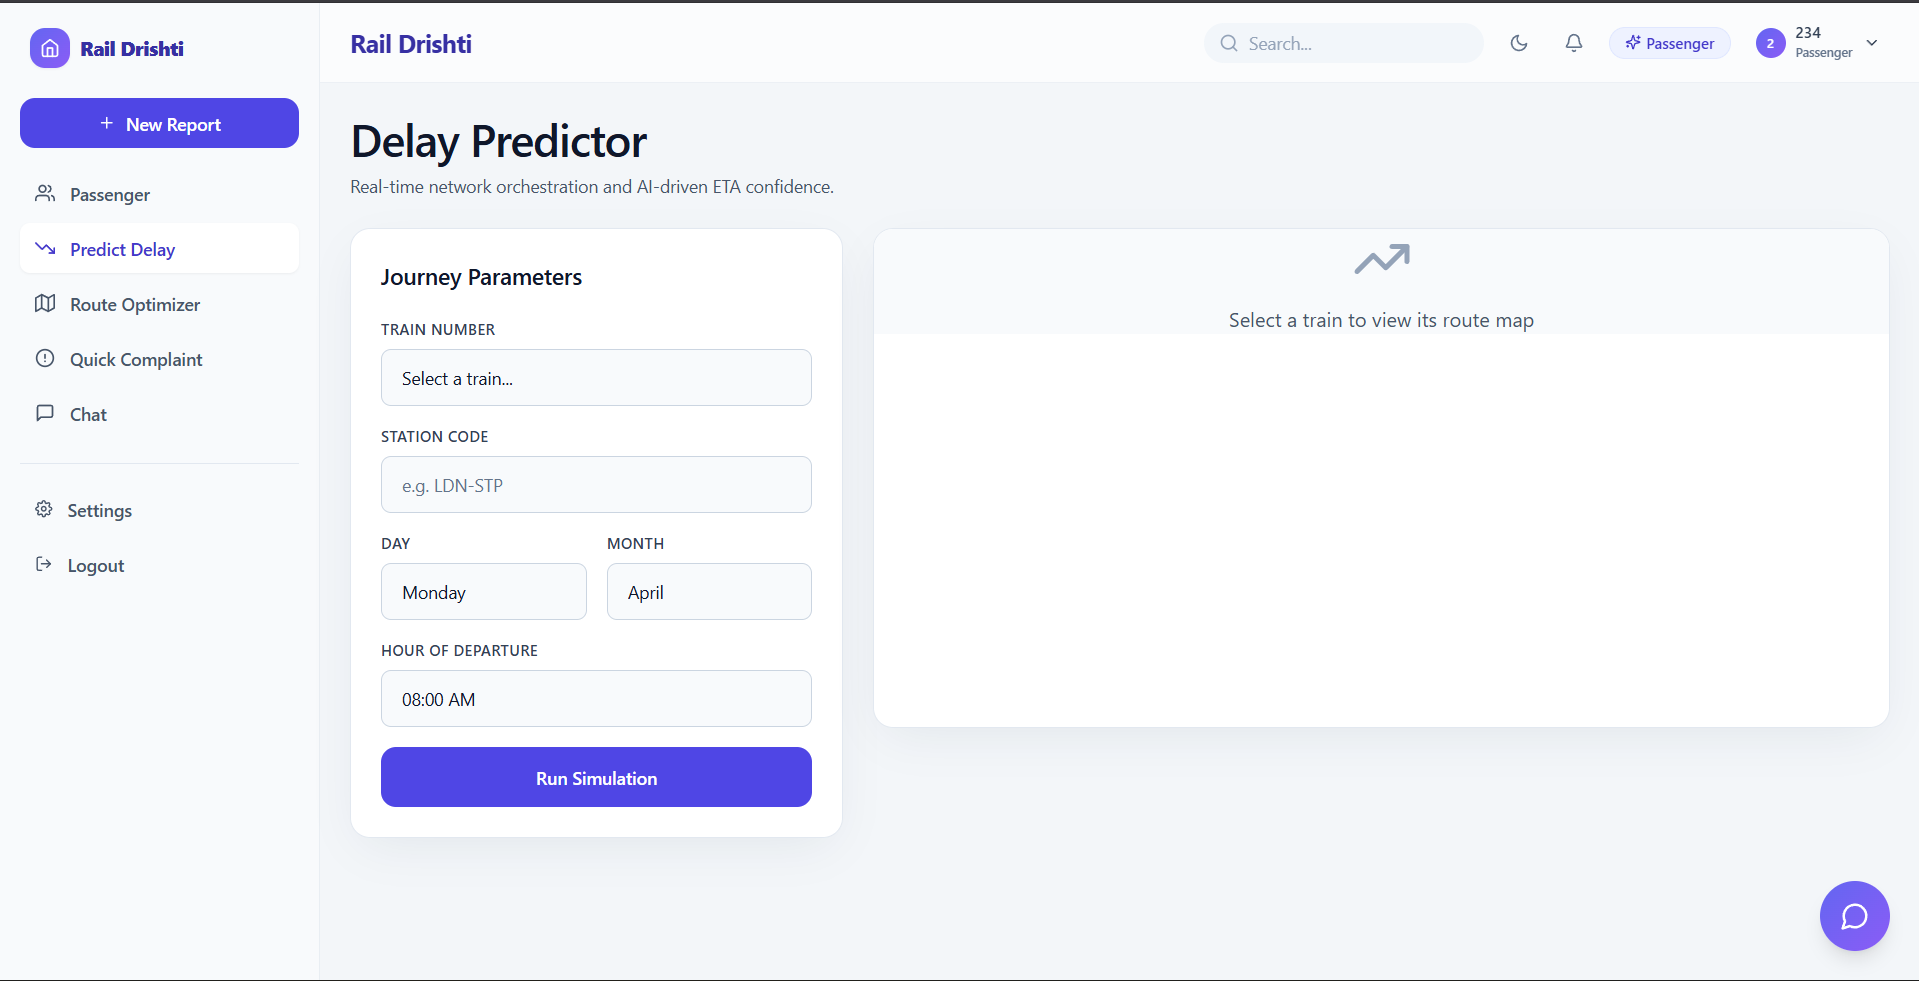
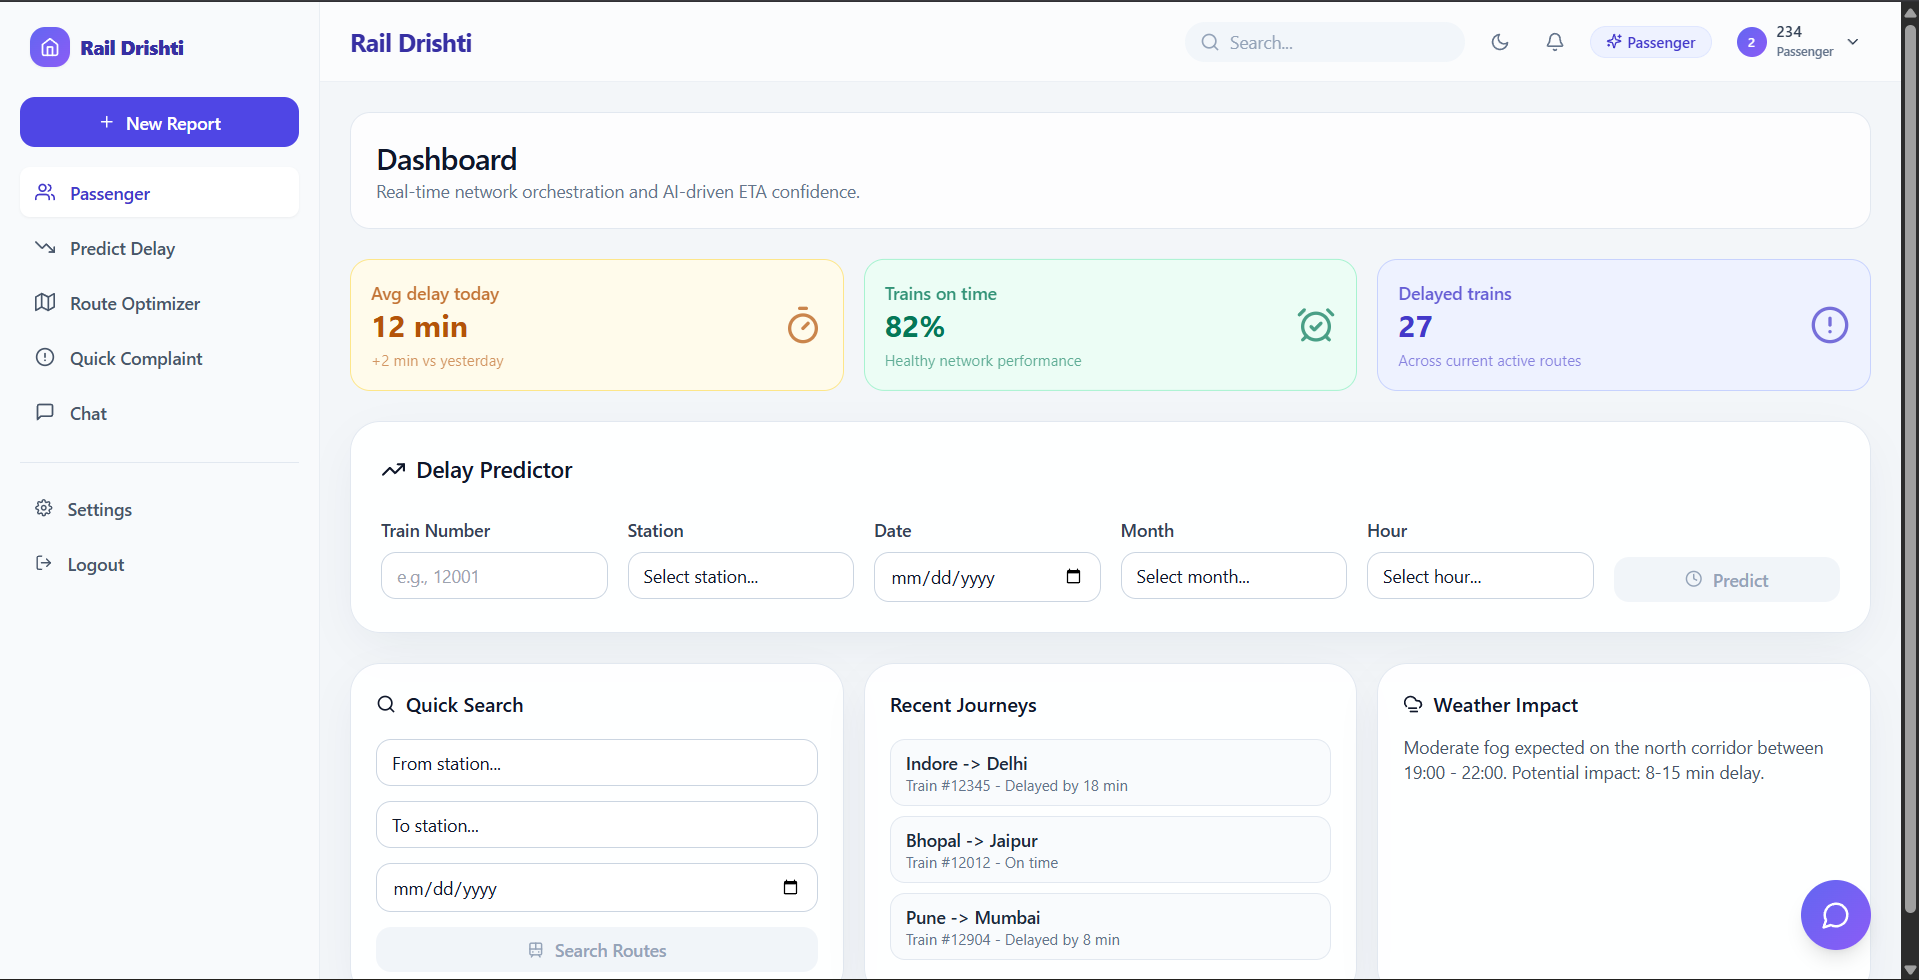
Delay Predictor Page
-
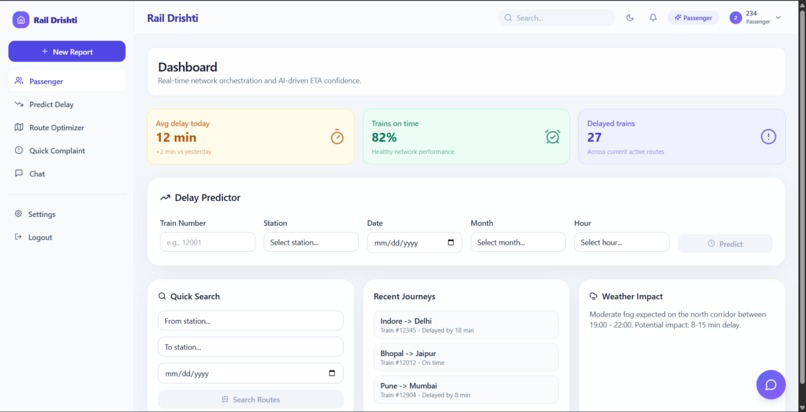
Home Page
-
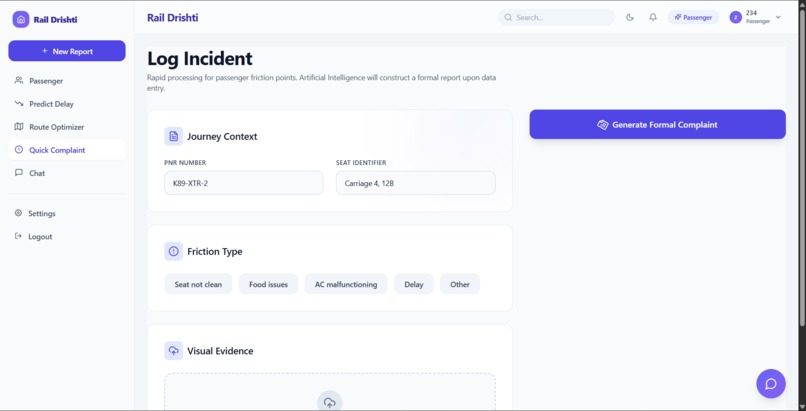
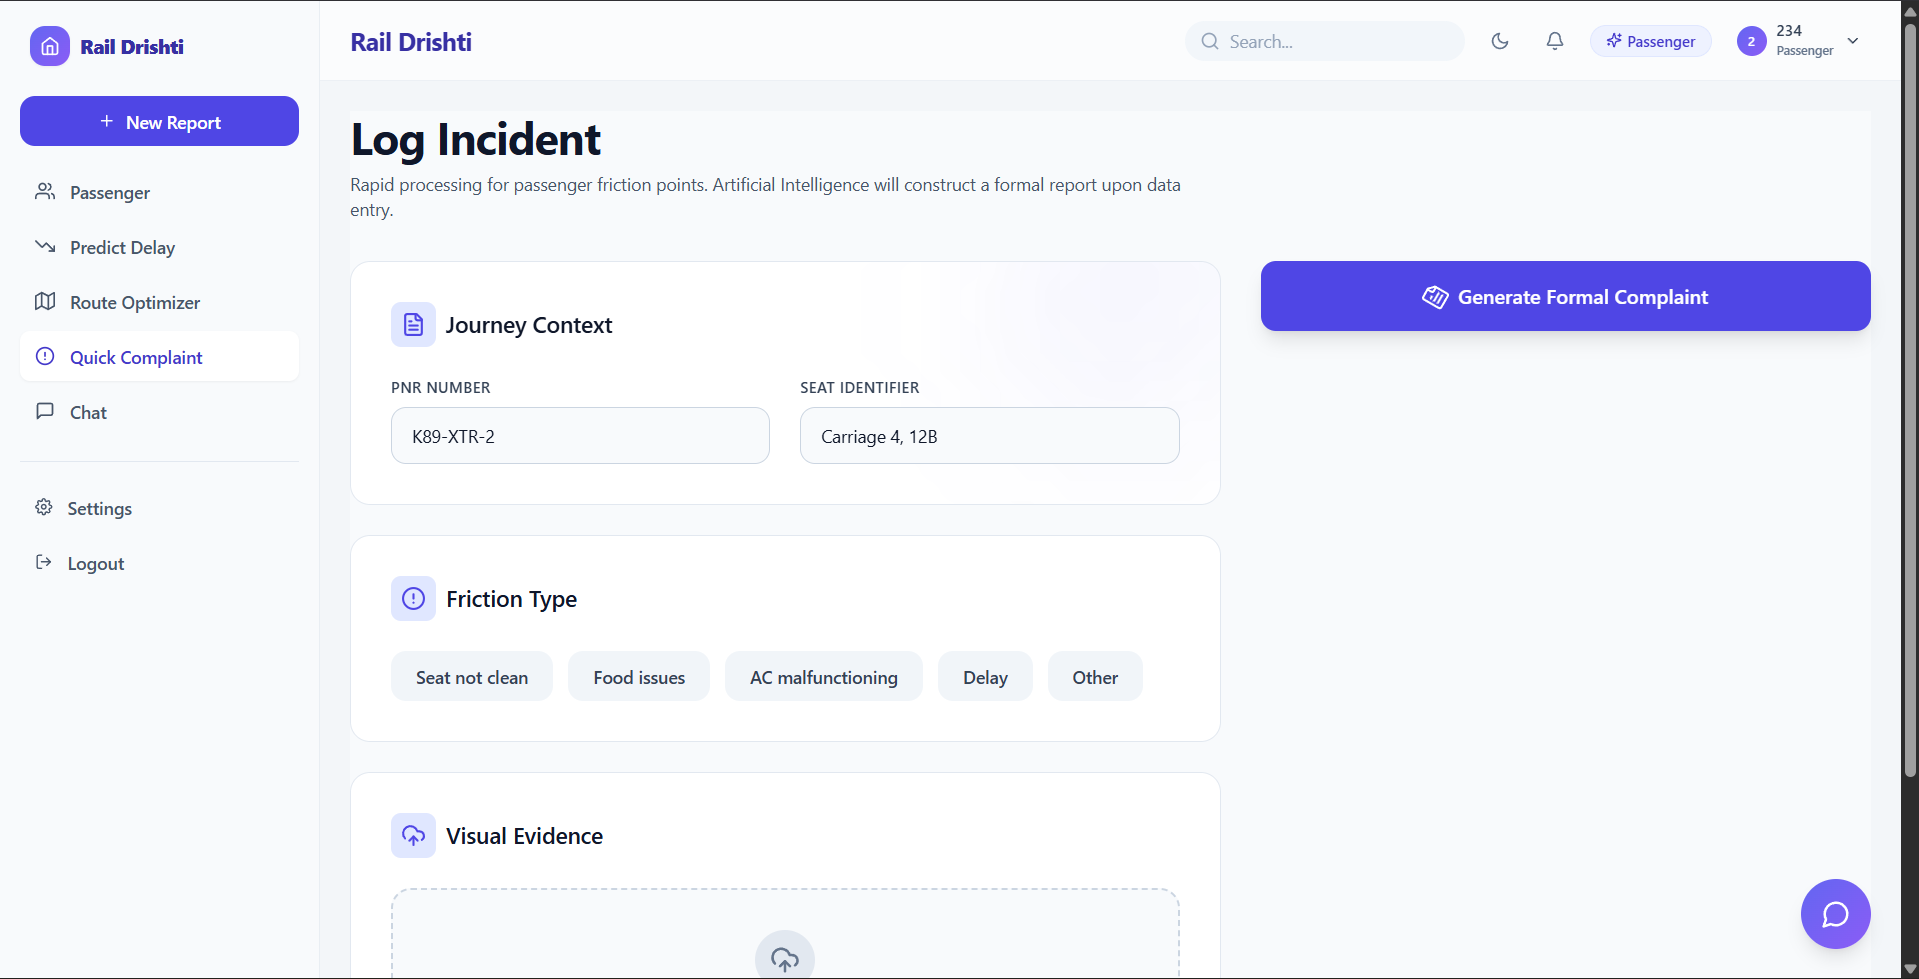
Other Features
-
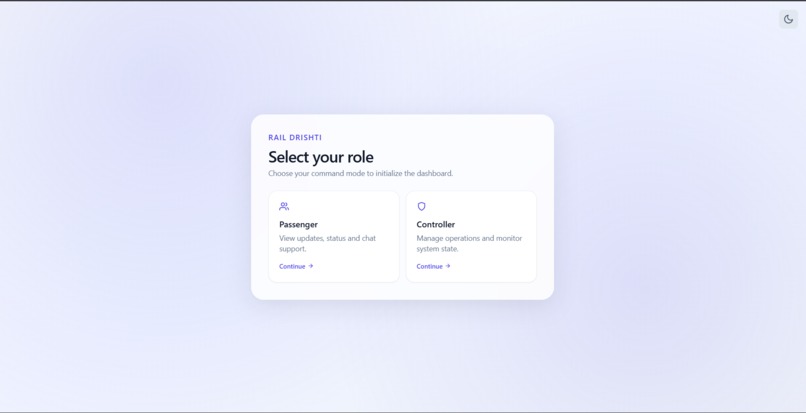
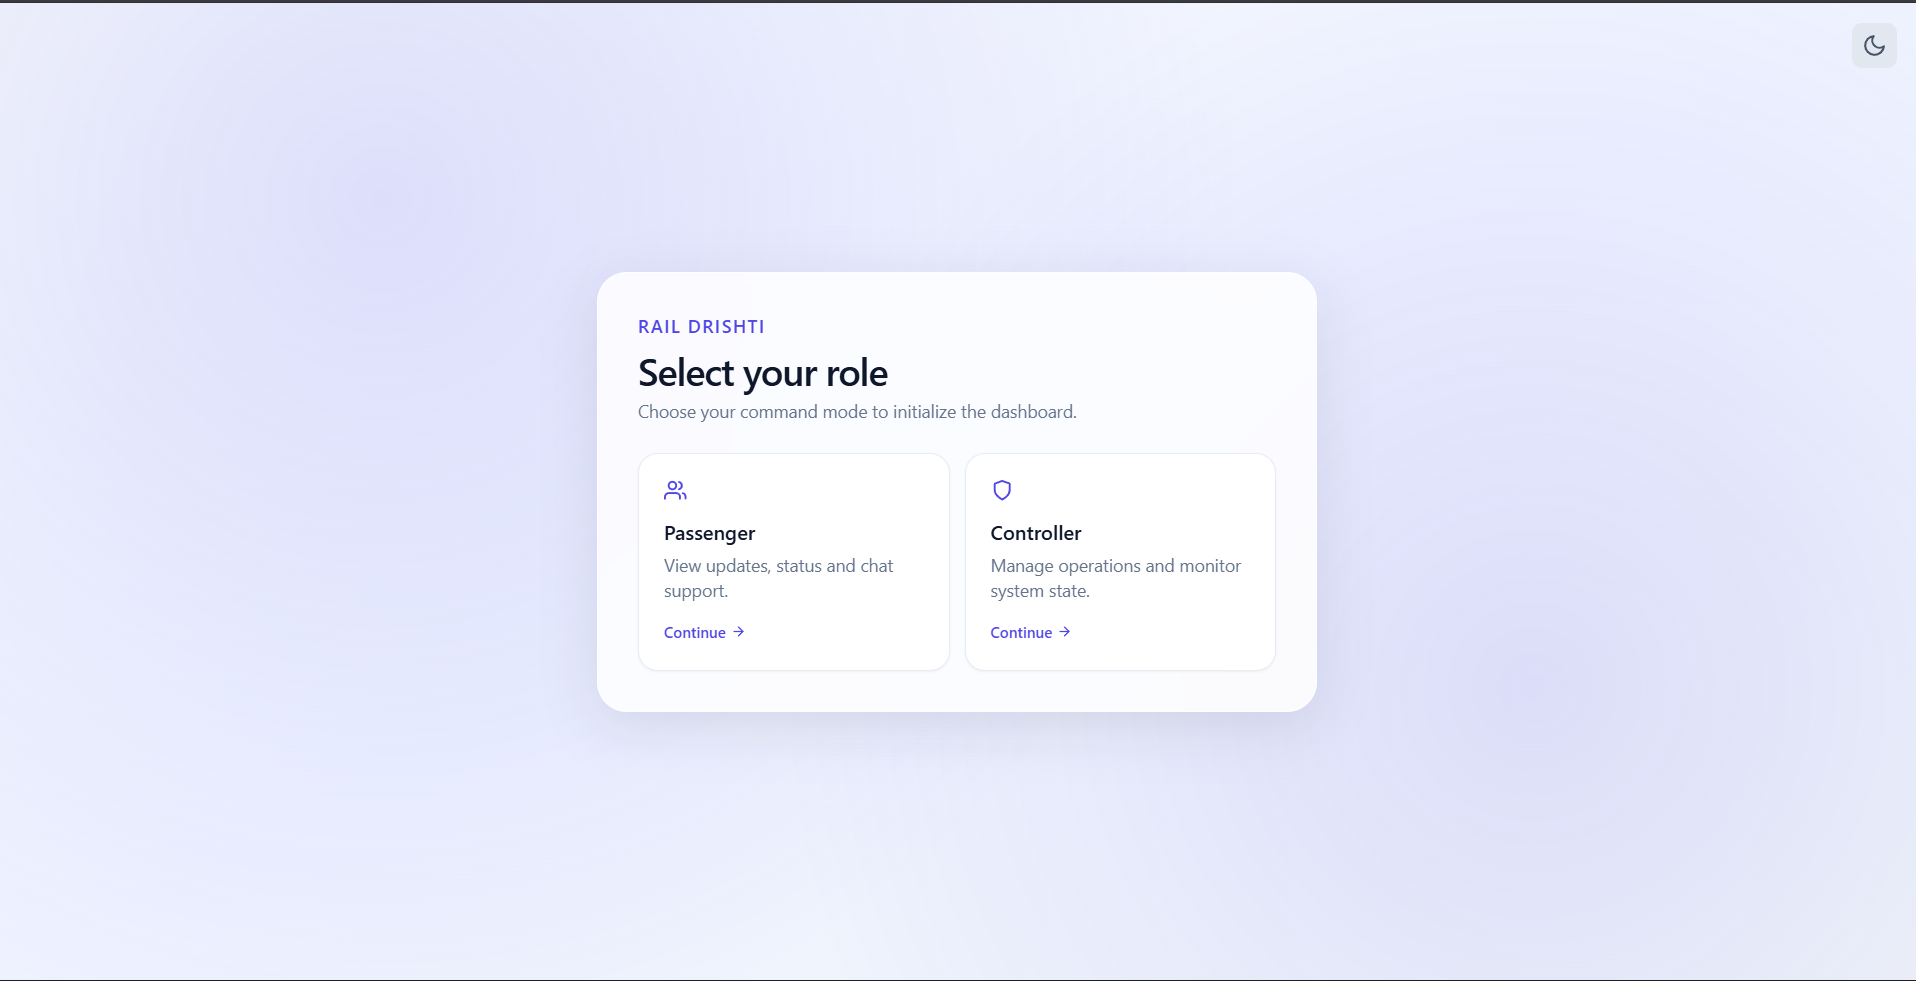
Landing Page
-
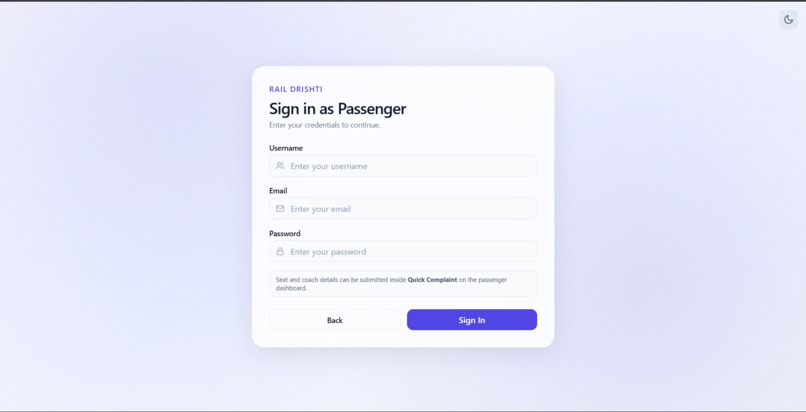
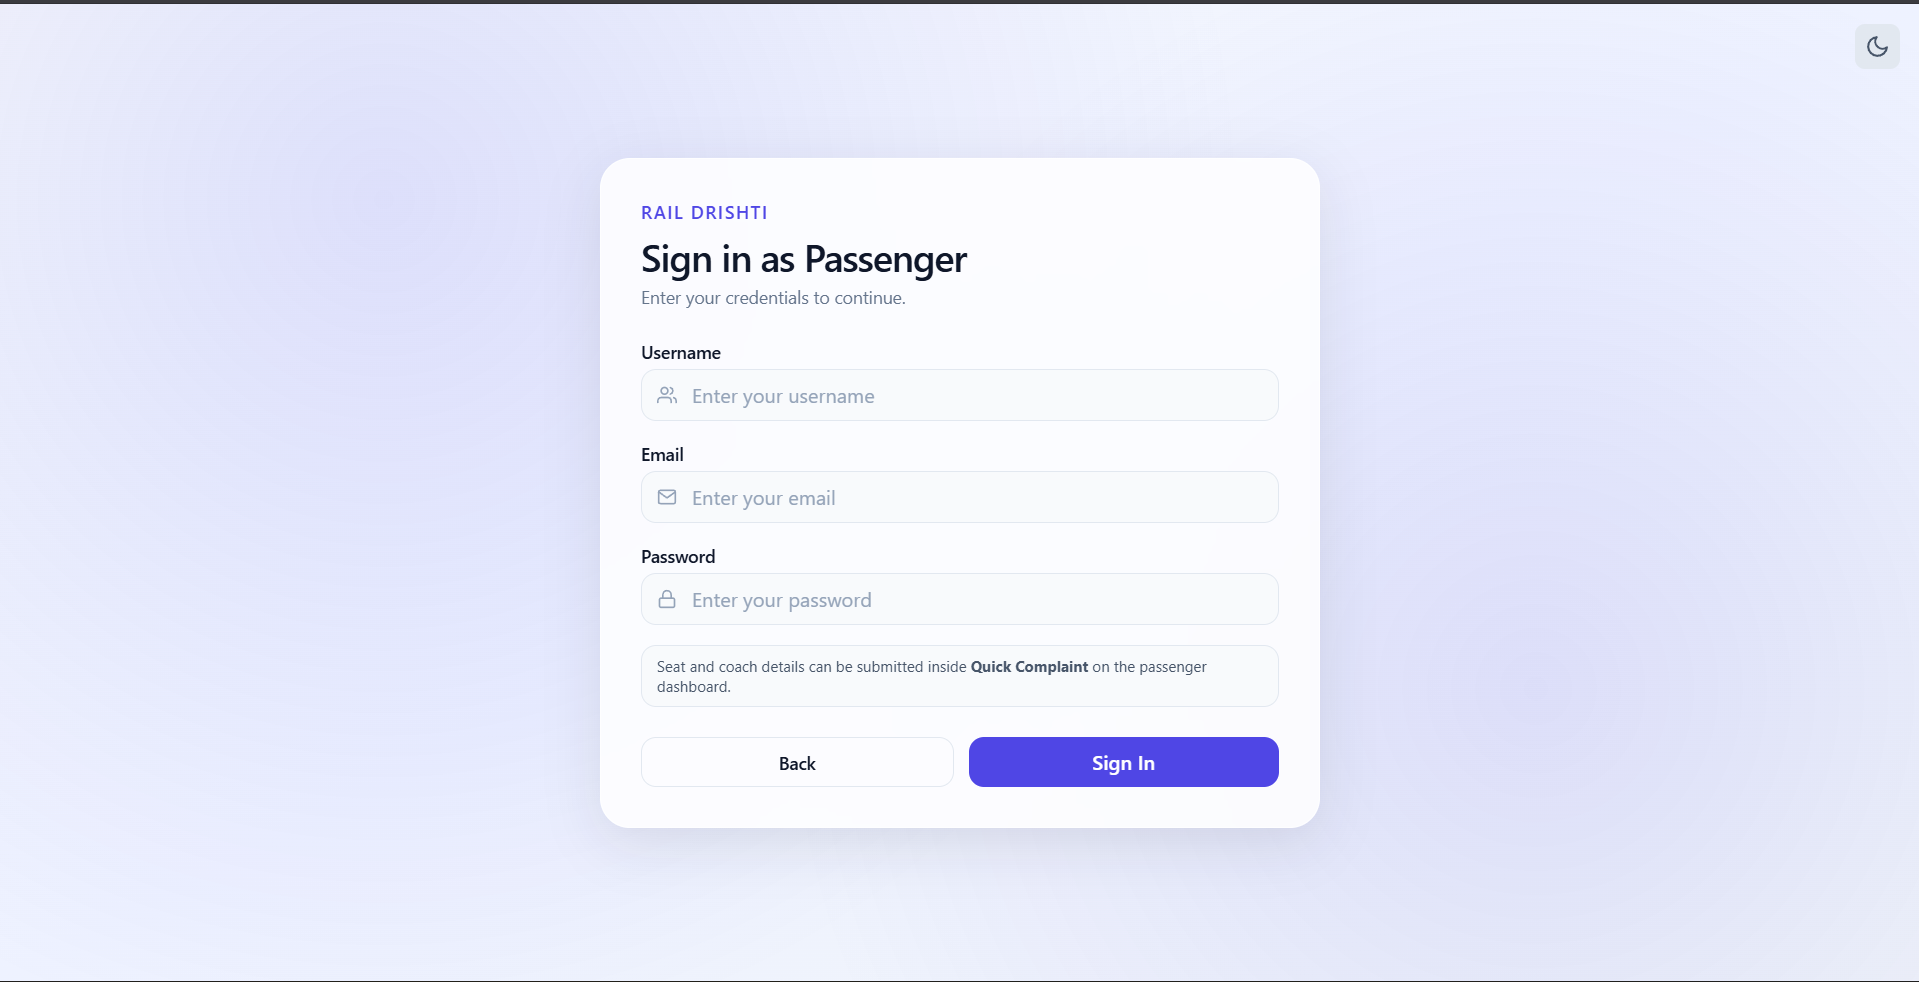
Sign Up Page
Rail-Drishti — Project Story
Inspiration
Every year, India's railways carry over 8 billion passengers — the fourth-largest network on Earth. Yet anyone who has ever waited on a platform in Indore, Kanpur, or Mumbai knows the same sinking feeling: the departure board flips to "Late", no reason is given, and you have no idea whether to wait 20 minutes or two hours.
We were that passenger. Three engineers who regularly travel between Tier-2 Indian cities, perpetually refreshing NTES on slow mobile data, doing mental arithmetic on whether a 40-minute delay will blow a connecting bus. The frustration is universal — and entirely unnecessary. The data to predict delays already exists. The Railways Running History dataset on data.gov.in contains millions of rows of historical running patterns. Weather APIs expose live fog and rainfall data. And yet none of it was ever woven into a passenger-facing tool.
The second spark came from the other side of the tracks: station controllers. We spoke to a controller at Indore Junction who manages platform allocation on paper and catches anomalous trains only when someone calls in. No live anomaly feed. No predictive dashboard. Pure firefighting.
That gap between data-rich railways and intelligence-poor passengers is what Rail-Drishti was built to close.
What It Does
Rail-Drishti is a full-stack, AI-first platform that serves two personas through entirely different dashboards:
For passengers:
- An ML-powered delay predictor that forecasts arrival/departure delays in minutes, fused with live weather data (fog, rainfall, wind speed, visibility)
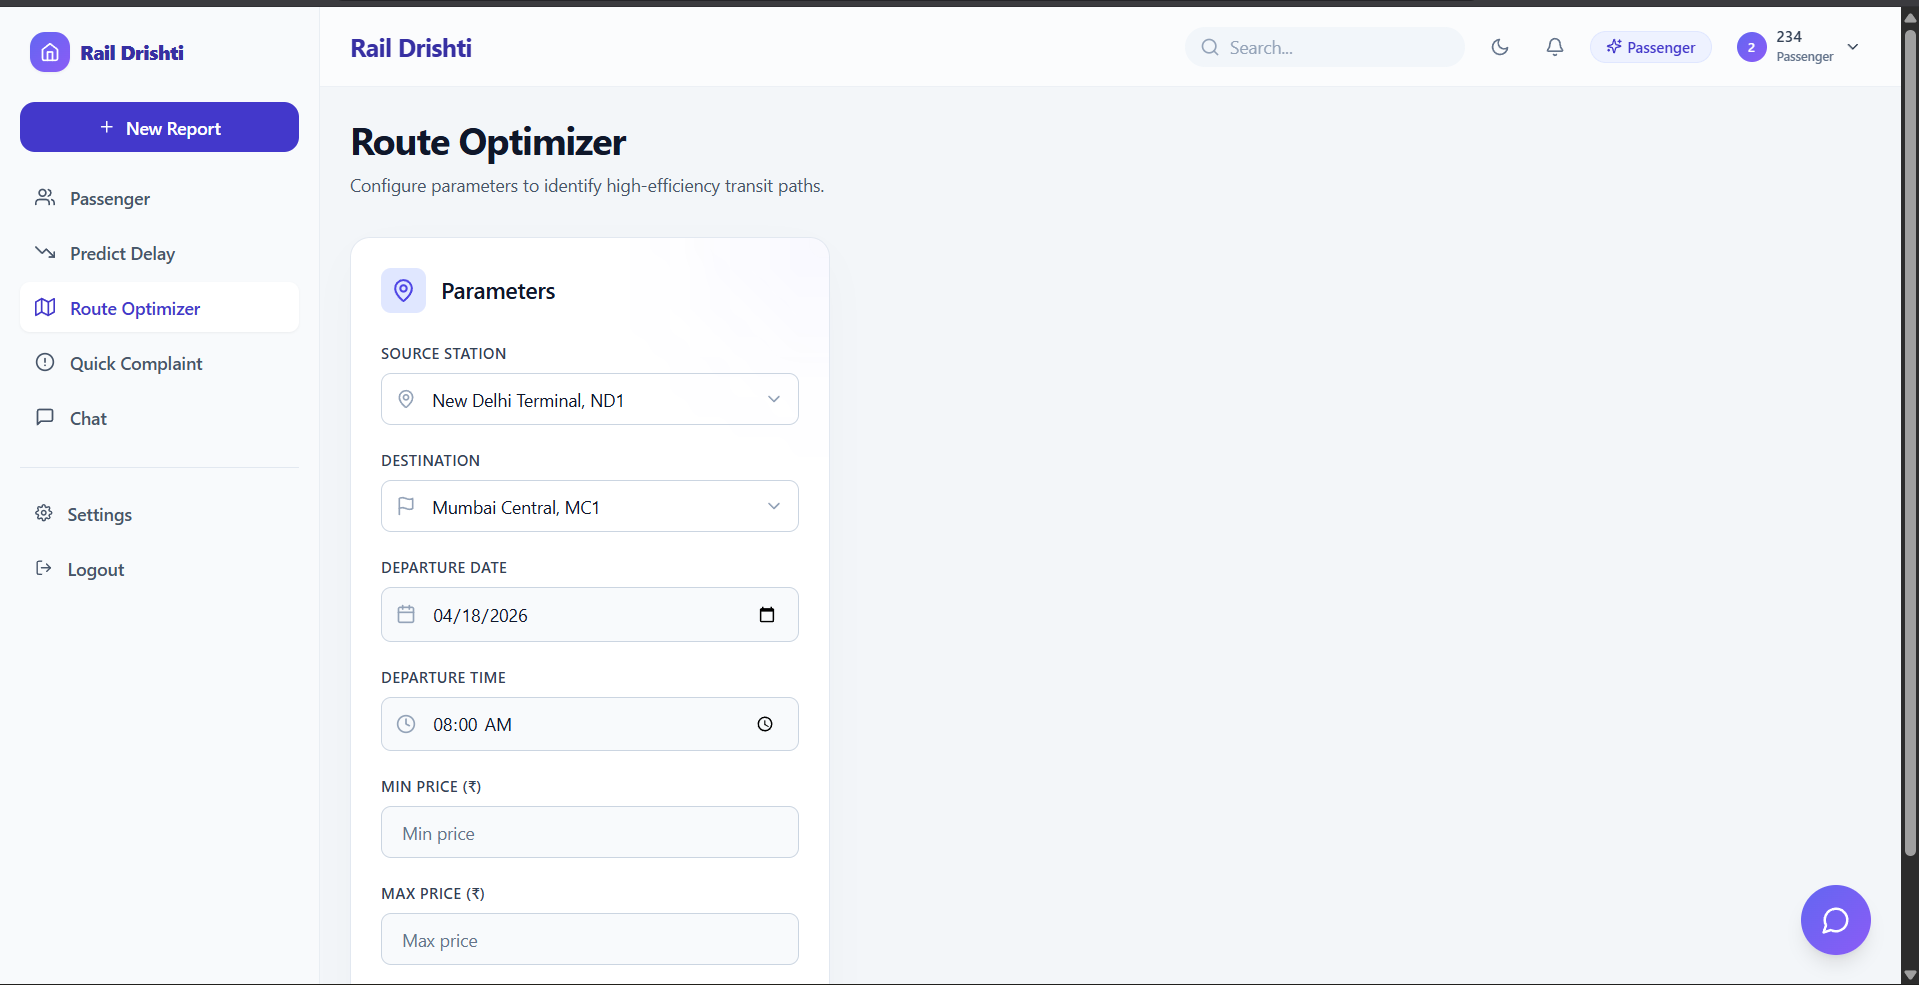
- A Smart Journey Optimisation Bot powered by Claude Sonnet 4 that parses natural language queries like "Indore to Kanpur, 14 hours, Rs. 1,500, sleeper class" and returns a Pareto-ranked list of trains with a plain-language explanation
- A Passenger Rulebook Chatbot built on RAG over the Railway General Rules PDF — every answer cites the exact rule number, eliminating hallucination risk
For station controllers:
- A real-time train map showing approaching and departing trains
- An anomaly alert table powered by Isolation Forest that flags trains whose predicted delay exceeds two standard deviations above the historical mean
- A crowding prediction card and weather impact summary for the station's catchment area
How We Built It
Data pipeline (Databricks)
We started by ingesting the Railways Running History CSVs from data.gov.in into Delta Lake on Databricks. Storing as Delta tables gave us time-travel semantics — critical for building training splits that respect temporal order and avoid future data leakage.
Feature engineering ran in PySpark across the full multi-year history. For each (train_number, date) pair we computed:
$$\mu_7(t) = \frac{1}{7}\sum_{i=1}^{7} d_{t-i}, \quad \sigma_{30}(t) = \sqrt{\frac{1}{30}\sum_{i=1}^{30}(d_{t-i} - \bar{d})^2}$$
where $d_t$ is the delay in minutes on day $t$. These rolling statistics become the core lag features for the LSTM input.
We tracked every training run in MLflow, logging MAE and RMSE per epoch, and used the MLflow Model Registry to version and promote the best ensemble checkpoint.
Delay prediction — two-stage ensemble
Stage 1 — LSTM (temporal patterns):
A 2-layer LSTM with 128 → 64 units takes a 30-day rolling window of delay values as input:
$$\hat{d}^{\text{LSTM}}t = f{\theta}\bigl([d_{t-30}, d_{t-29}, \ldots, d_{t-1}]\bigr)$$
Training objective is mean absolute error:
$$\mathcal{L}{\text{LSTM}} = \frac{1}{N}\sum{i=1}^{N} \left|\hat{d}^{\text{LSTM}}_i - d_i\right|$$
Stage 2 — XGBoost (exogenous features):
XGBoost ingests tabular features including day-of-week, month, holiday flag, track section congestion index, and live weather signals fetched from OpenWeatherMap:
$$\mathbf{x}t = \bigl[\text{dow}, \text{month}, \mathbb{1}{\text{holiday}}, \mu_7, \sigma_{30}, r_{\text{mm}}, v_{\text{m}}, w_{\text{kmh}}, T_{\text{°C}}, \mathbb{1}_{\text{fog}}\bigr]$$
Stage 3 — Stacking meta-learner:
A lightweight linear regression combines both heads:
$$\hat{d}_t = \alpha \cdot \hat{d}^{\text{LSTM}}_t + (1-\alpha) \cdot \hat{d}^{\text{XGB}}_t$$
where $\alpha$ is learned on a held-out validation set. Our target metrics were $\text{MAE} \leq 12$ minutes and $\text{RMSE} \leq 20$ minutes, with weather fusion delivering roughly a 15% MAE reduction over the no-weather baseline.
Journey optimisation — Pareto scoring
Claude Sonnet 4 first extracts structured constraints from natural language. The Pareto composite score for each candidate train $t$ is:
$$S(t) = \alpha \cdot \frac{T_{\max} - T_t}{T_{\max}} + (1 - \alpha) \cdot \frac{B_{\max} - P_t}{B_{\max}}$$
where $T_t$ is journey duration, $P_t$ is fare, $T_{\max}$ and $B_{\max}$ are the user's hard constraints, and $\alpha = 0.5$ by default (equal time-cost weighting). Only trains satisfying both hard constraints enter the candidate set; the top-5 by score are returned and narrated by Claude.
RAG pipeline — rulebook bot
The Railway General Rules PDF was chunked into 512-token passages with 64-token overlap using LangChain's RecursiveCharacterTextSplitter, embedded with sentence-transformers/all-MiniLM-L6-v2, and stored in ChromaDB. At query time the top-5 nearest chunks are retrieved and passed to Claude with a strict instruction to cite only from the provided context.
Frontend and backend
The React + TypeScript + Vite SPA is deployed on Vercel with role-based routing: /passenger, /controller, /chat, /rules. FastAPI on Render handles all inference endpoints. Redis on Upstash caches weather responses per location per hour and pre-computed delay forecasts for the top 100 trains, keeping p99 latency under 1 second for cached paths.
Challenges We Ran Into
1. Data quality in the running history CSVs
The raw data.gov.in CSVs had inconsistent station code formats, missing delay columns for certain years, and a non-trivial number of negative delay values (trains recorded as arriving before scheduled time by implausible margins). Clipping delays to $[0, 600]$ minutes and normalising station codes across vintages of the dataset consumed nearly two full hours of the 24-hour sprint.
2. LSTM training time vs. sprint clock
A full 50-epoch LSTM on three years of history across all trains would have taken 6–8 hours on CPU. We solved this by limiting the training corpus to the top 500 trains by passenger volume — which covers roughly 80% of total traffic — and using Databricks' GPU-backed cluster to cut wall-clock training time to under 90 minutes.
3. Live train API rate limits
The free tier of RailYatri's API has tight per-minute rate limits. During integration testing, we hit the cap within minutes. The mitigation was to pre-cache station-level train lists in PostgreSQL and serve live status only for trains the user has explicitly bookmarked, falling back to cached data with a freshness timestamp shown in the UI.
4. Grounding the RAG bot
Early versions of the rulebook bot would occasionally blend retrieved context with parametric knowledge, producing confident but uncited answers. We fixed this by tightening the system prompt to "Answer ONLY from the context below. If the answer is not in the context, say so." and adding a post-processing check that rejects any response lacking a rule number citation.
5. Role-based routing and auth in a 24-hour sprint
Building two completely different dashboard experiences from a single React codebase without a proper auth backend meant we needed a lightweight role-selection mechanism that felt real but didn't require standing up a full identity service. We implemented a routeGuards.ts layer that stores role in session storage and redirects unauthenticated users, which was functional enough for the demo while being honest about what a production version would need.
Accomplishments That We're Proud Of
- The journey bot demo — typing "Indore to Kanpur, 14h, Rs. 1500" and getting a ranked, narrated response in under 3 seconds — worked on the first live run in front of the team. That moment felt like the project had become real.
- Every rulebook bot answer cites a specific rule number. In a domain where hallucinated medical or legal information can cause real harm, getting grounding right mattered to us.
- Two completely separate dashboard experiences — passenger and controller — from a single React codebase, with no shared component leaking between roles.
- Weather fusion reducing MAE by ~15% over the baseline is a concrete, measurable result we can point to, not just an architectural claim.
- The full stack was deployed and publicly accessible before hour 22.
What We Learned
MLflow is non-negotiable for time-boxed ML sprints. Without experiment tracking we would have lost track of which hyperparameter run produced which checkpoint within the first training session. The ability to diff two runs in the Databricks UI saved us from re-training models we'd already discarded.
Delta Lake's time-travel semantics are genuinely useful for ML, not just marketing. Being able to query the dataset as it existed on a specific date meant our train/val/test split was reproducible across team members without serialising a snapshot to disk.
Claude is better as a structured extractor than a free-form generator — until you want the free-form part. Using Claude to parse journey constraints into JSON first, then running deterministic Pareto scoring, then handing the ranked list back to Claude for narration, produced far more consistent results than asking Claude to do everything in one prompt.
Fog is the single biggest weather variable for Indian railway delays. Rainfall matters, but the binary fog_flag (visibility < 500 m) showed the highest feature importance in the XGBoost model by a significant margin. This matches domain knowledge but seeing it validated in SHAP values was satisfying.
UI role-splitting is an underrated engineering discipline. Designing two dashboards that share a component library but expose completely different information hierarchies forced us to think carefully about what each persona actually needs — and cut a lot of features that seemed exciting but weren't justified by either user story.
What's Next for Rail-Drishti
Real-time retraining pipeline. The Databricks Workflow currently runs on a daily schedule with batch data. The next step is a streaming ingestion path using Spark Structured Streaming over a Kafka topic fed by NTES, enabling the model to update its rolling features in near-real-time.
Per-station and per-route personalisation. The current model treats all trains uniformly. A natural extension is a hierarchical model where a global prior is fine-tuned per route using the last 90 days of that route's specific delay history.
Multimodal alerts. Push notifications to passengers' phones when the predicted delay for their bookmarked train crosses a threshold — powered by the same Isolation Forest anomaly detector already running on the controller dashboard.
Fare optimisation across dates. The journey bot currently optimises within a single travel date. Extending the Pareto scorer to a 7-day window would let it recommend "travel Thursday instead of Friday — same budget, 2 hours faster" — a qualitatively different class of insight.
Open-sourcing the delay dataset pipeline. The data cleaning and feature engineering work we did on the Railways Running History CSVs is reusable by anyone building rail ML in India. We plan to publish the preprocessing notebooks as a standalone open dataset on the Databricks Marketplace.
Built With
- chromadb
- claudesonnet4
- databricks
- deltalake
- fastapi
- langchain
- lstm
- mlflow
- openweathermapapi
- postgresql
- pyspark
- python
- pytorch
- react
- redis
- render
- scikitlearn
- sentencetransformers
- tensorflow
- typescript
- upstash
- vercel
- vite
- xgboost
