-
-
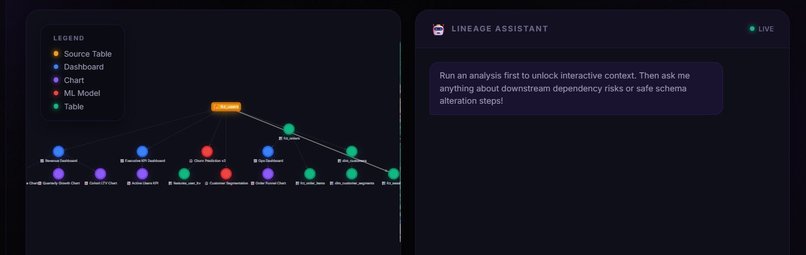
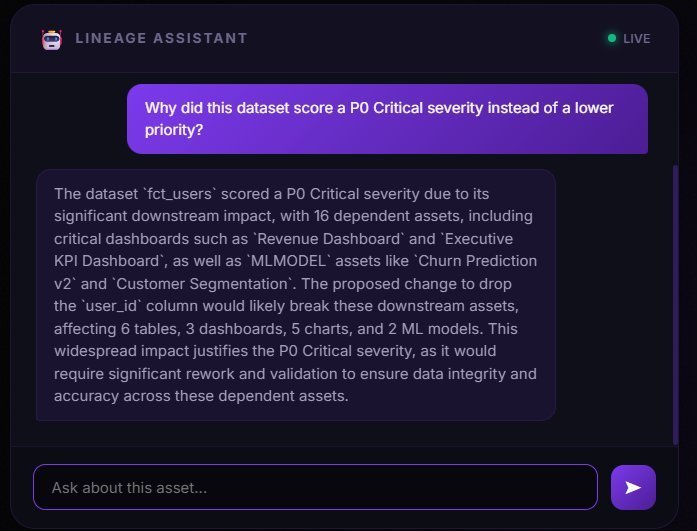
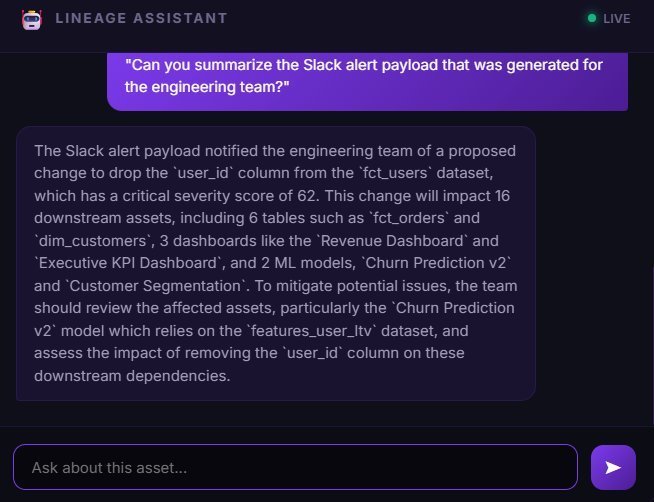
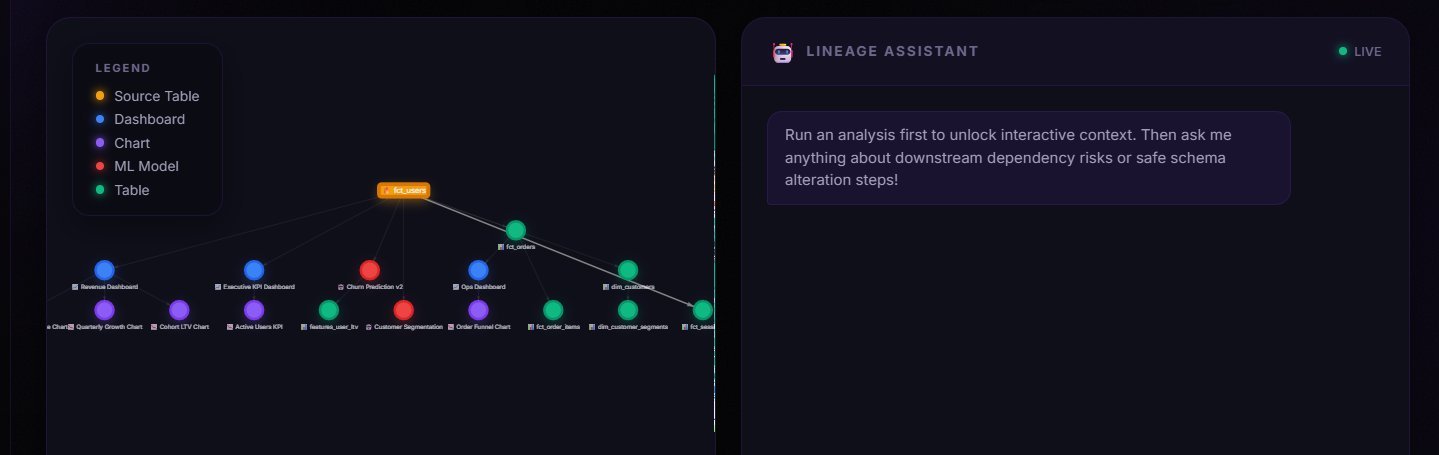
live chatbot and lineage map
-
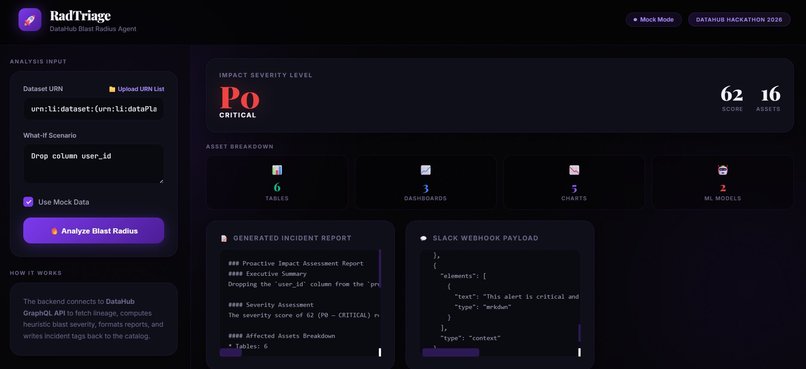
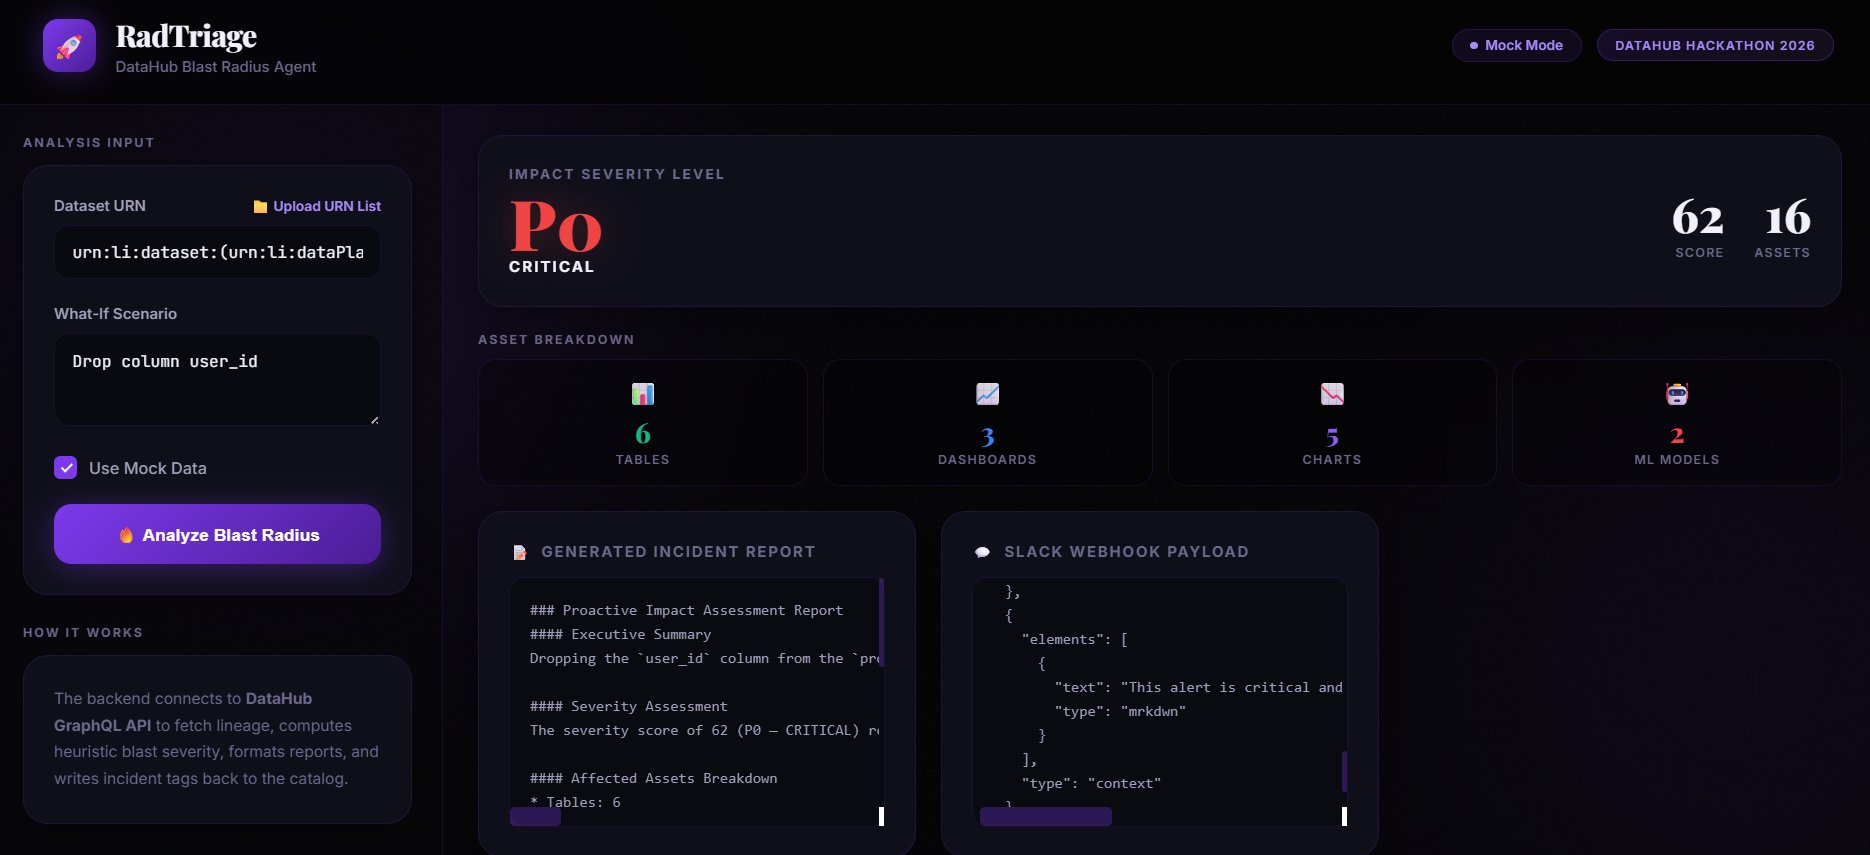
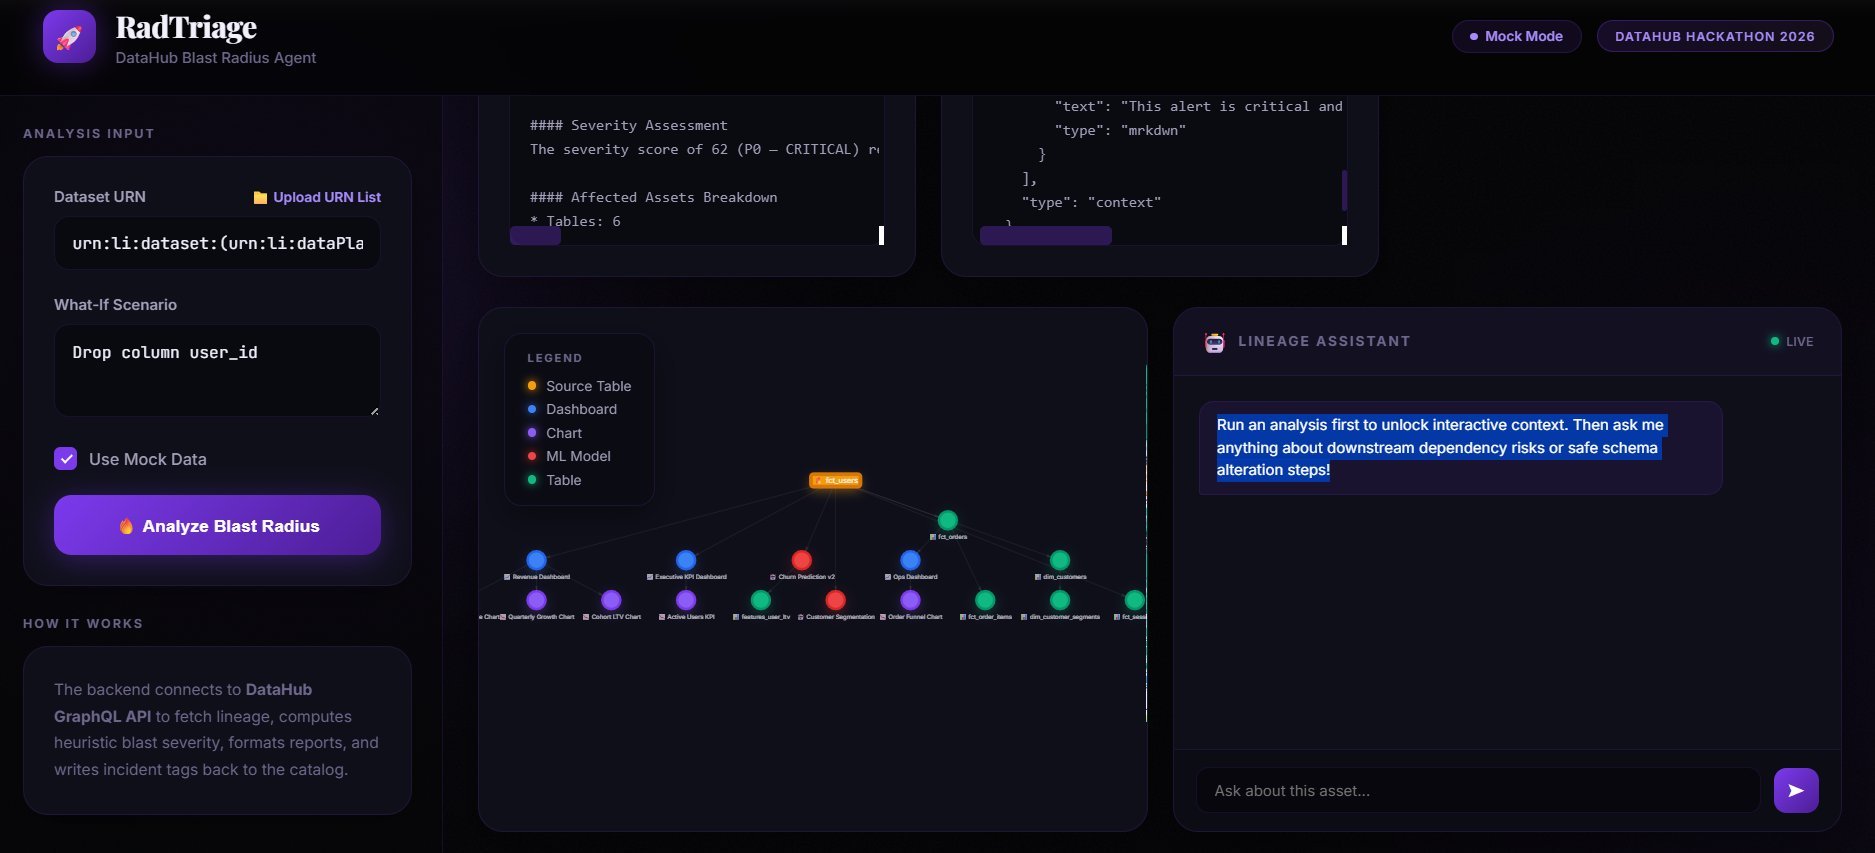
landing page
-
-
-
Inspiration
A single change in a data table can silently break dashboards, reports, and machine learning models across an organization. We were inspired by the frustration data engineers face when they discover the impact only after something goes wrong. We wanted to build a tool that could answer one important question: “What will break before I deploy this change?”
What it does
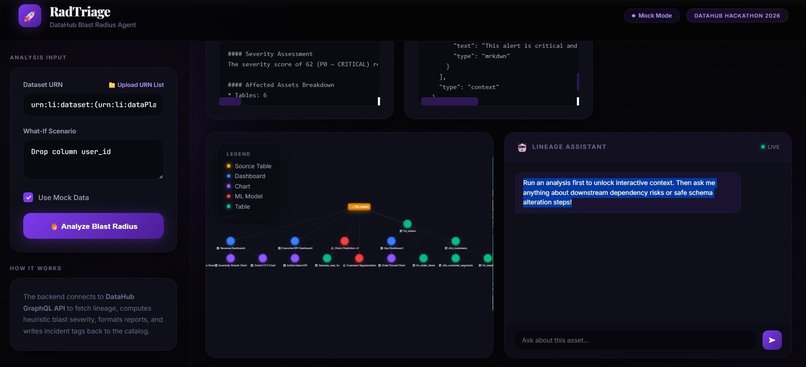
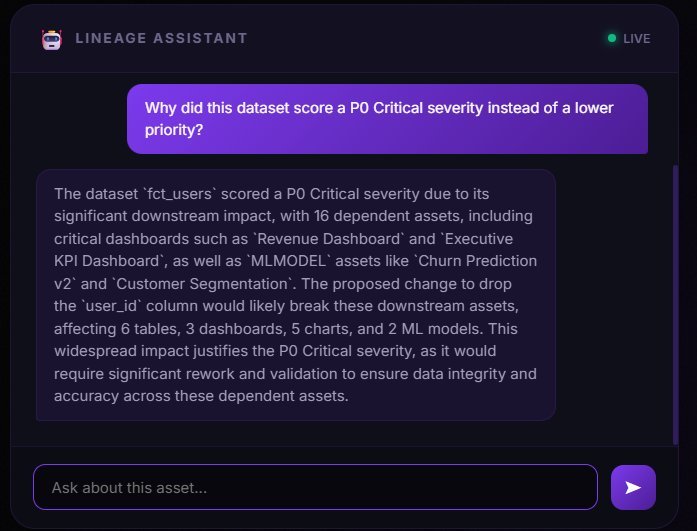
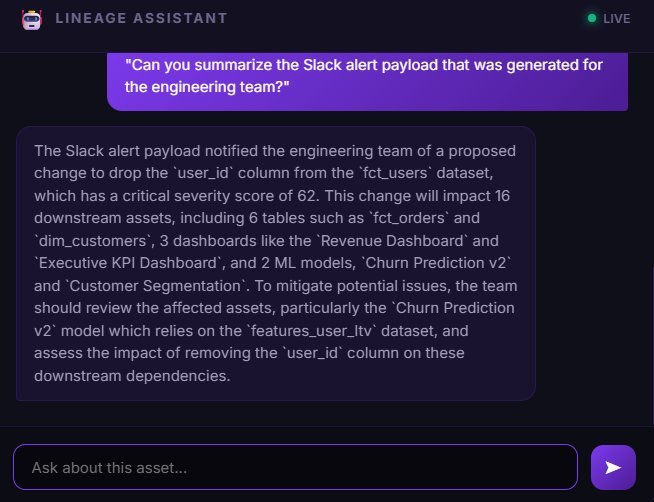
RadTriage is a command-line tool that connects to DataHub’s metadata graph, fetches downstream lineage, calculates the blast radius of a dataset change, and generates a clear impact report. It visualizes affected assets as an ASCII tree, assigns a severity score (P0–P3), creates AI-generated incident or what-if reports, prepares Slack-ready alert payloads, and can optionally write warning tags back into DataHub.
How we built it
We built RadTriage using Python and GraphQL to communicate with DataHub. The tool recursively fetches downstream lineage, converts the graph into a terminal-friendly tree, counts affected tables, dashboards, charts, and ML models, computes a heuristic severity score, and uses OpenAI to generate professional reports and alerts. We also added an optional write-back step that tags the source asset inside DataHub.
Challenges we ran into
The biggest challenge was handling recursive lineage data and turning a complex dependency graph into a readable tree structure. We also needed the tool to remain useful even if external services such as OpenAI or DataHub were temporarily unavailable. Designing a severity-scoring system that felt realistic while still being simple enough for a hackathon was another challenge.
Accomplishments that we're proud of
We are proud that RadTriage works end-to-end: it fetches lineage, visualizes dependencies, calculates risk, generates reports, and can write warnings back into the metadata catalog. The ASCII tree made the impact immediately understandable, and the DataHub tagging created a strong “wow” moment during demos.
What we learned
Through this project, we learned how metadata graphs and data lineage work in practice, how to integrate GraphQL APIs, how to traverse recursive structures, and how to build resilient CLI tools. We also improved our prompt engineering skills for structured AI outputs and learned the importance of communicating technical risk clearly.
What's next for RadTriage
Next, we want to add owner-aware alerts, CI/CD integration, historical impact analysis, and support for multiple metadata catalogs. We also plan to make the severity scoring smarter by incorporating usage frequency and business criticality. Our goal is to turn RadTriage into a proactive safety layer for modern data platforms, helping teams prevent outages before they happen.

Log in or sign up for Devpost to join the conversation.