-
-
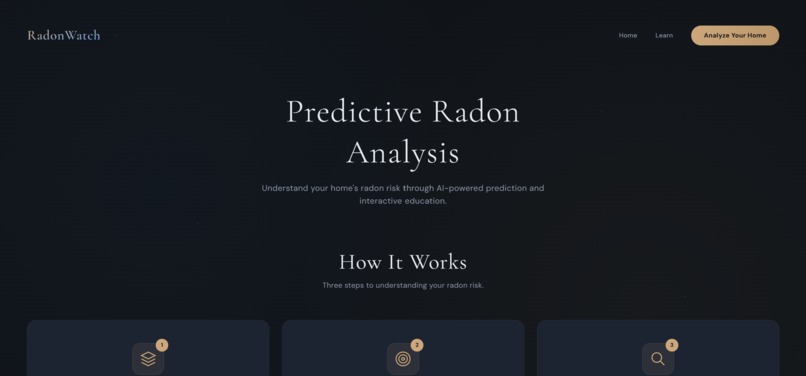
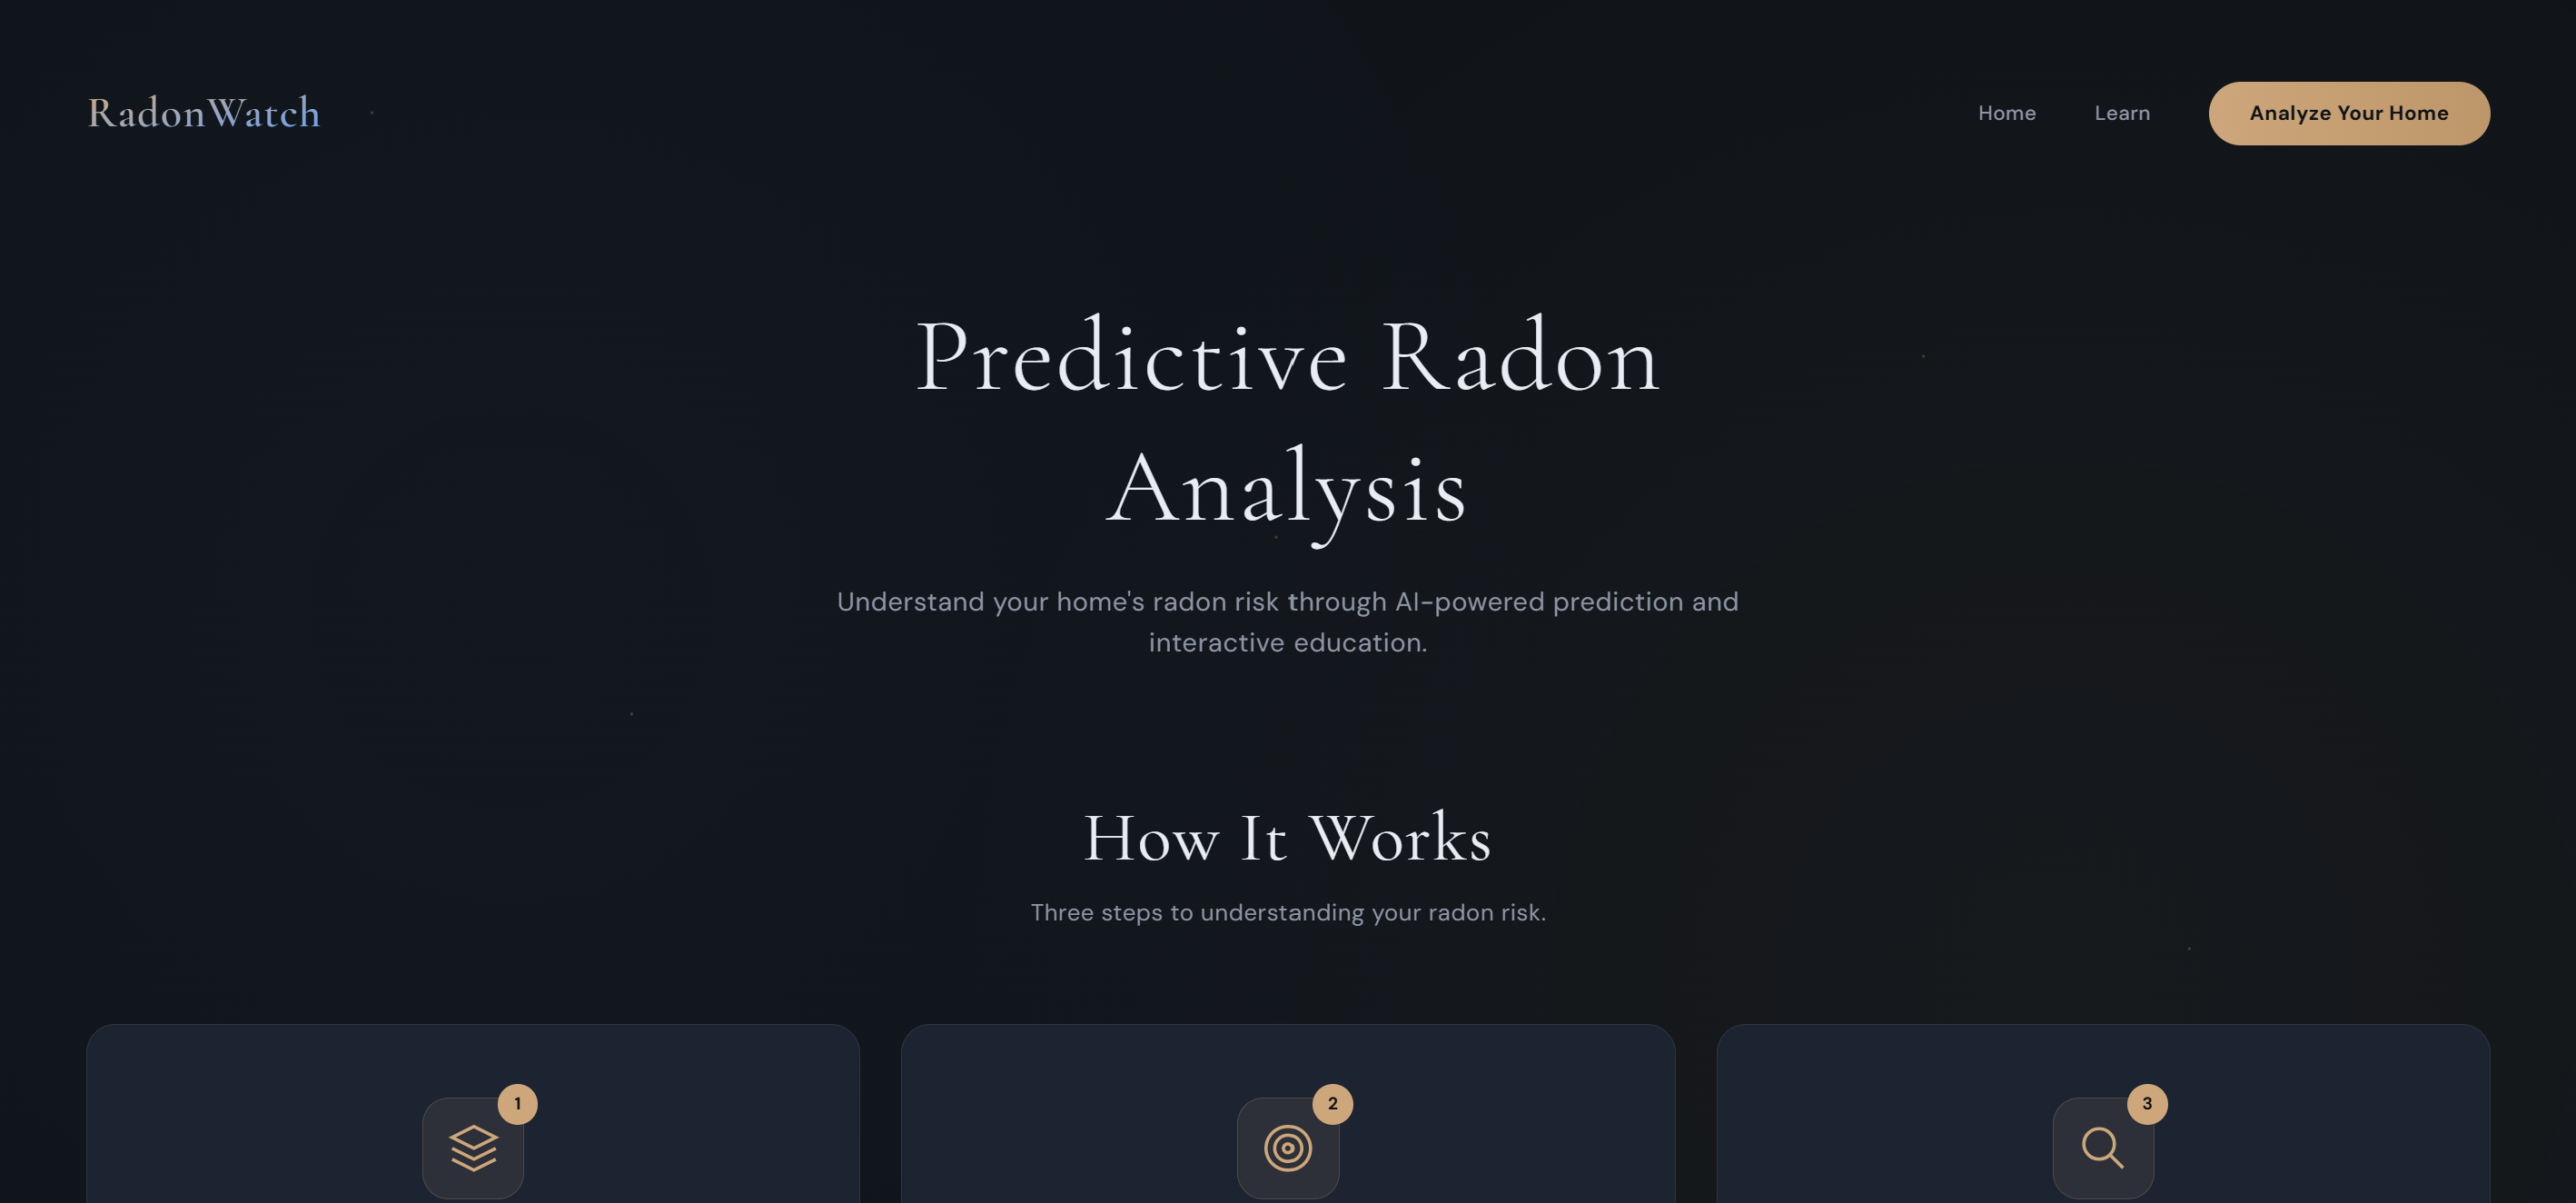
beautiful UI
-

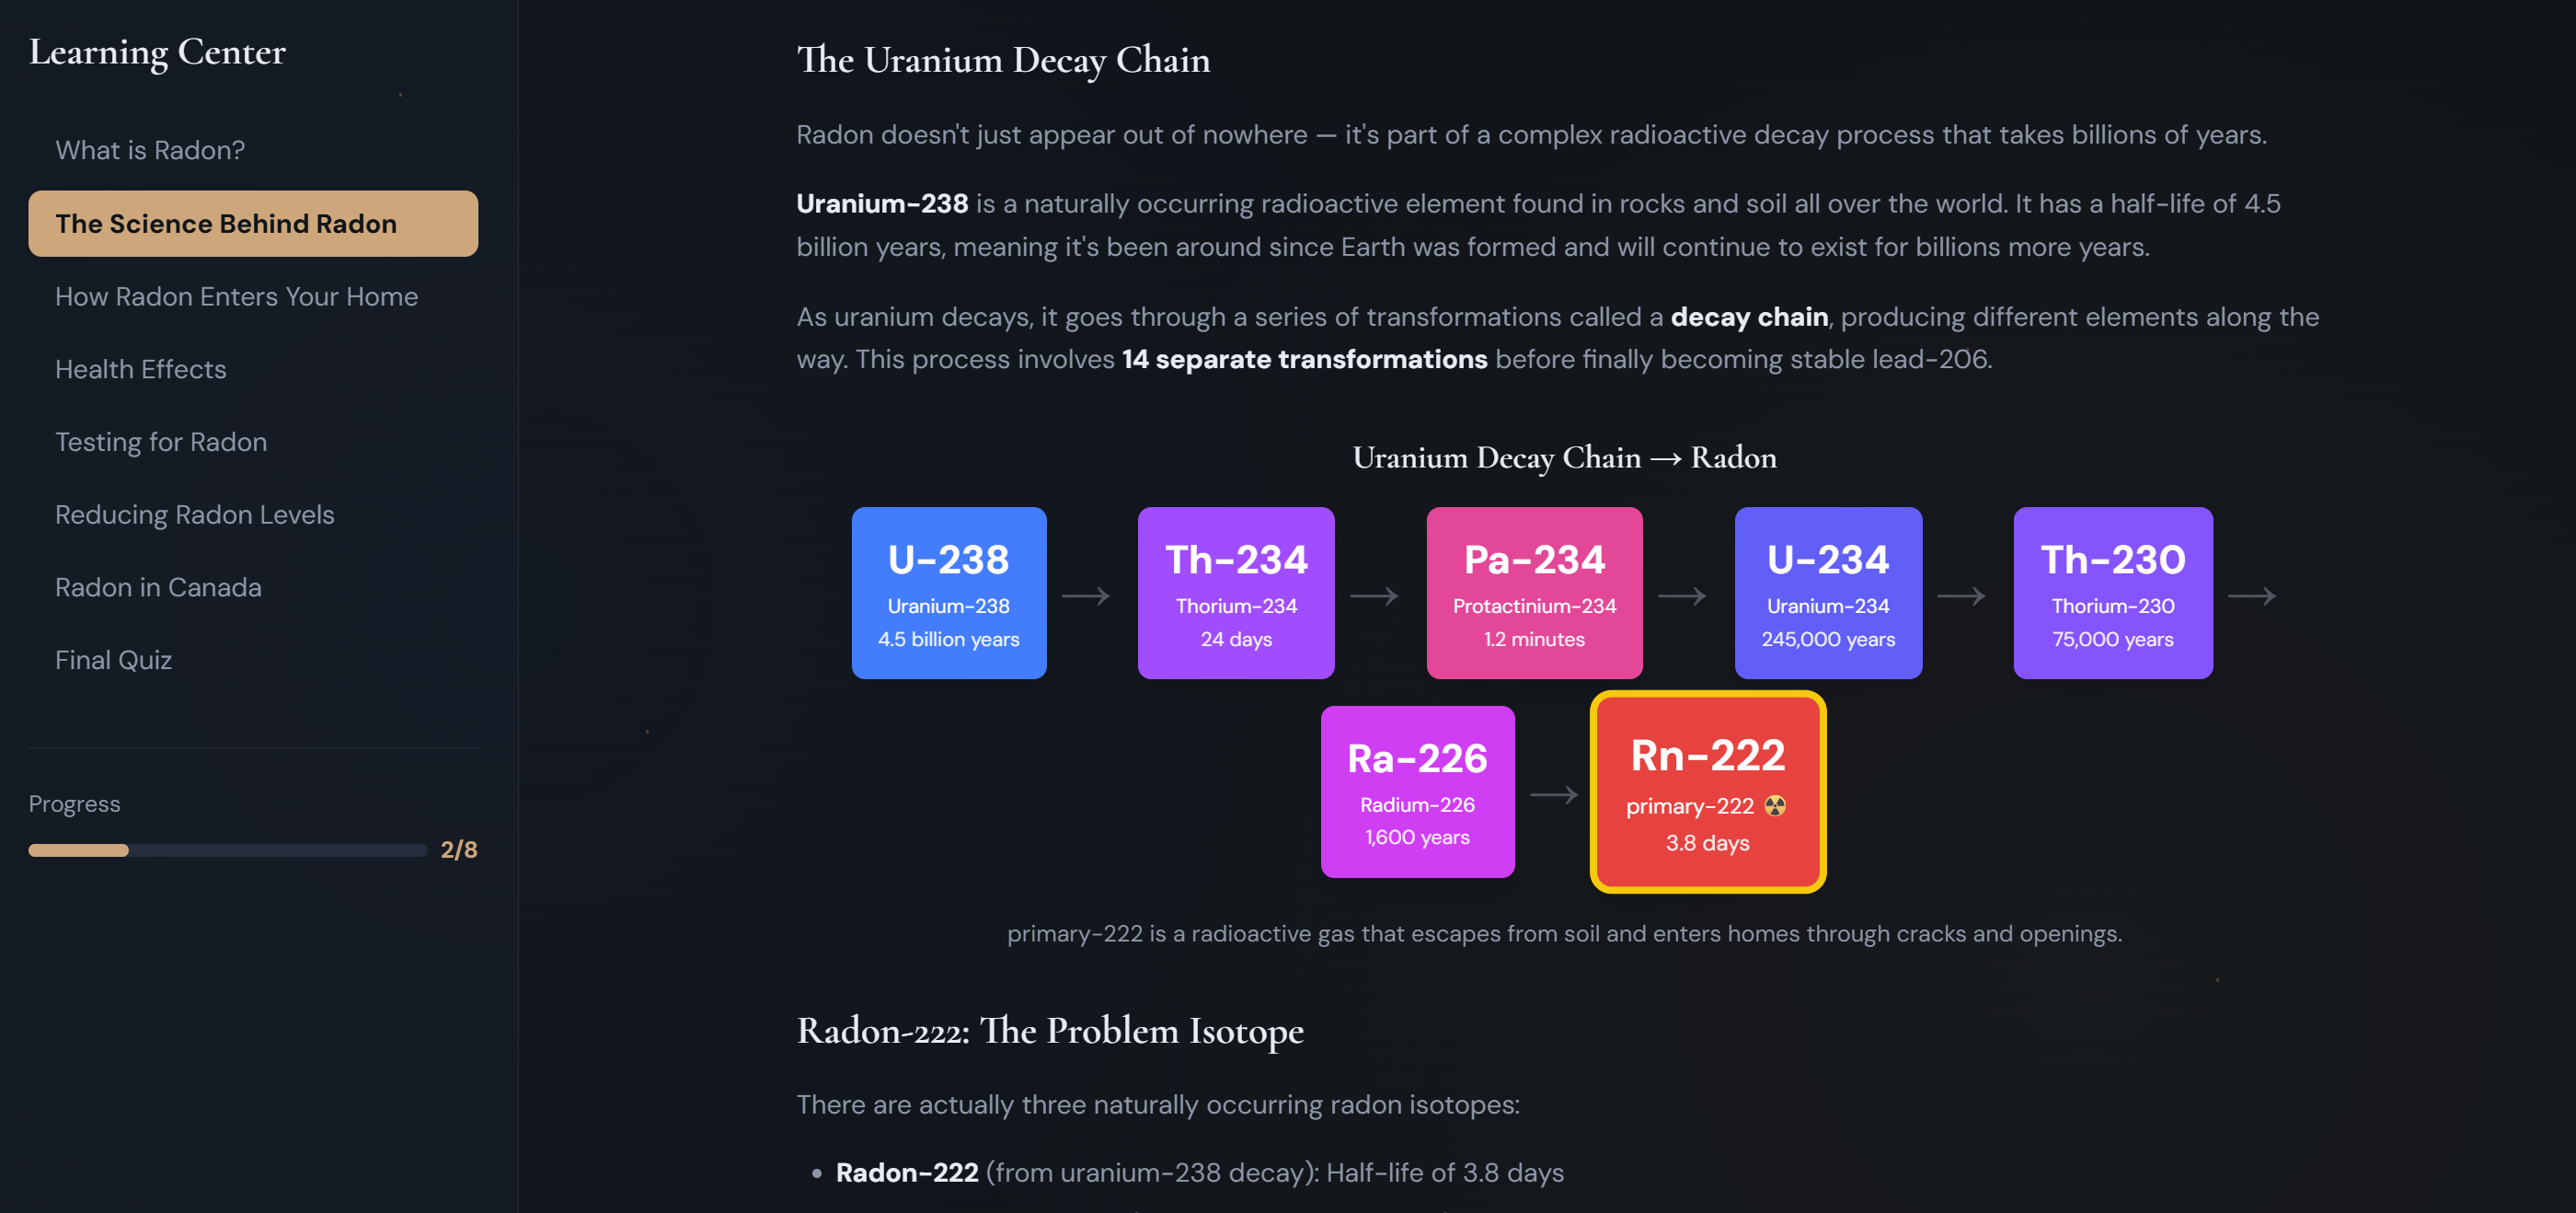
diagrams and educational content
-
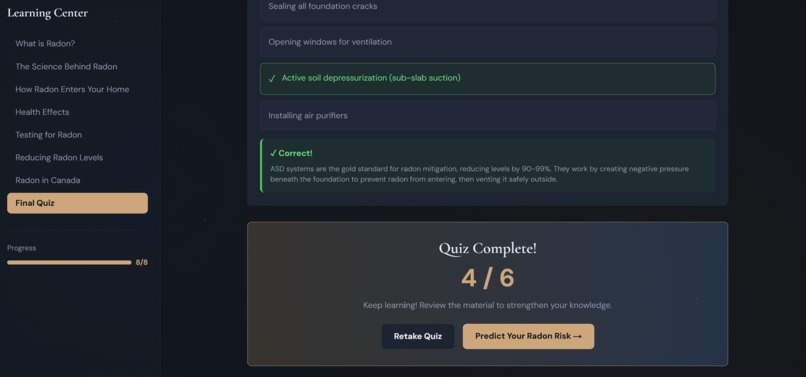
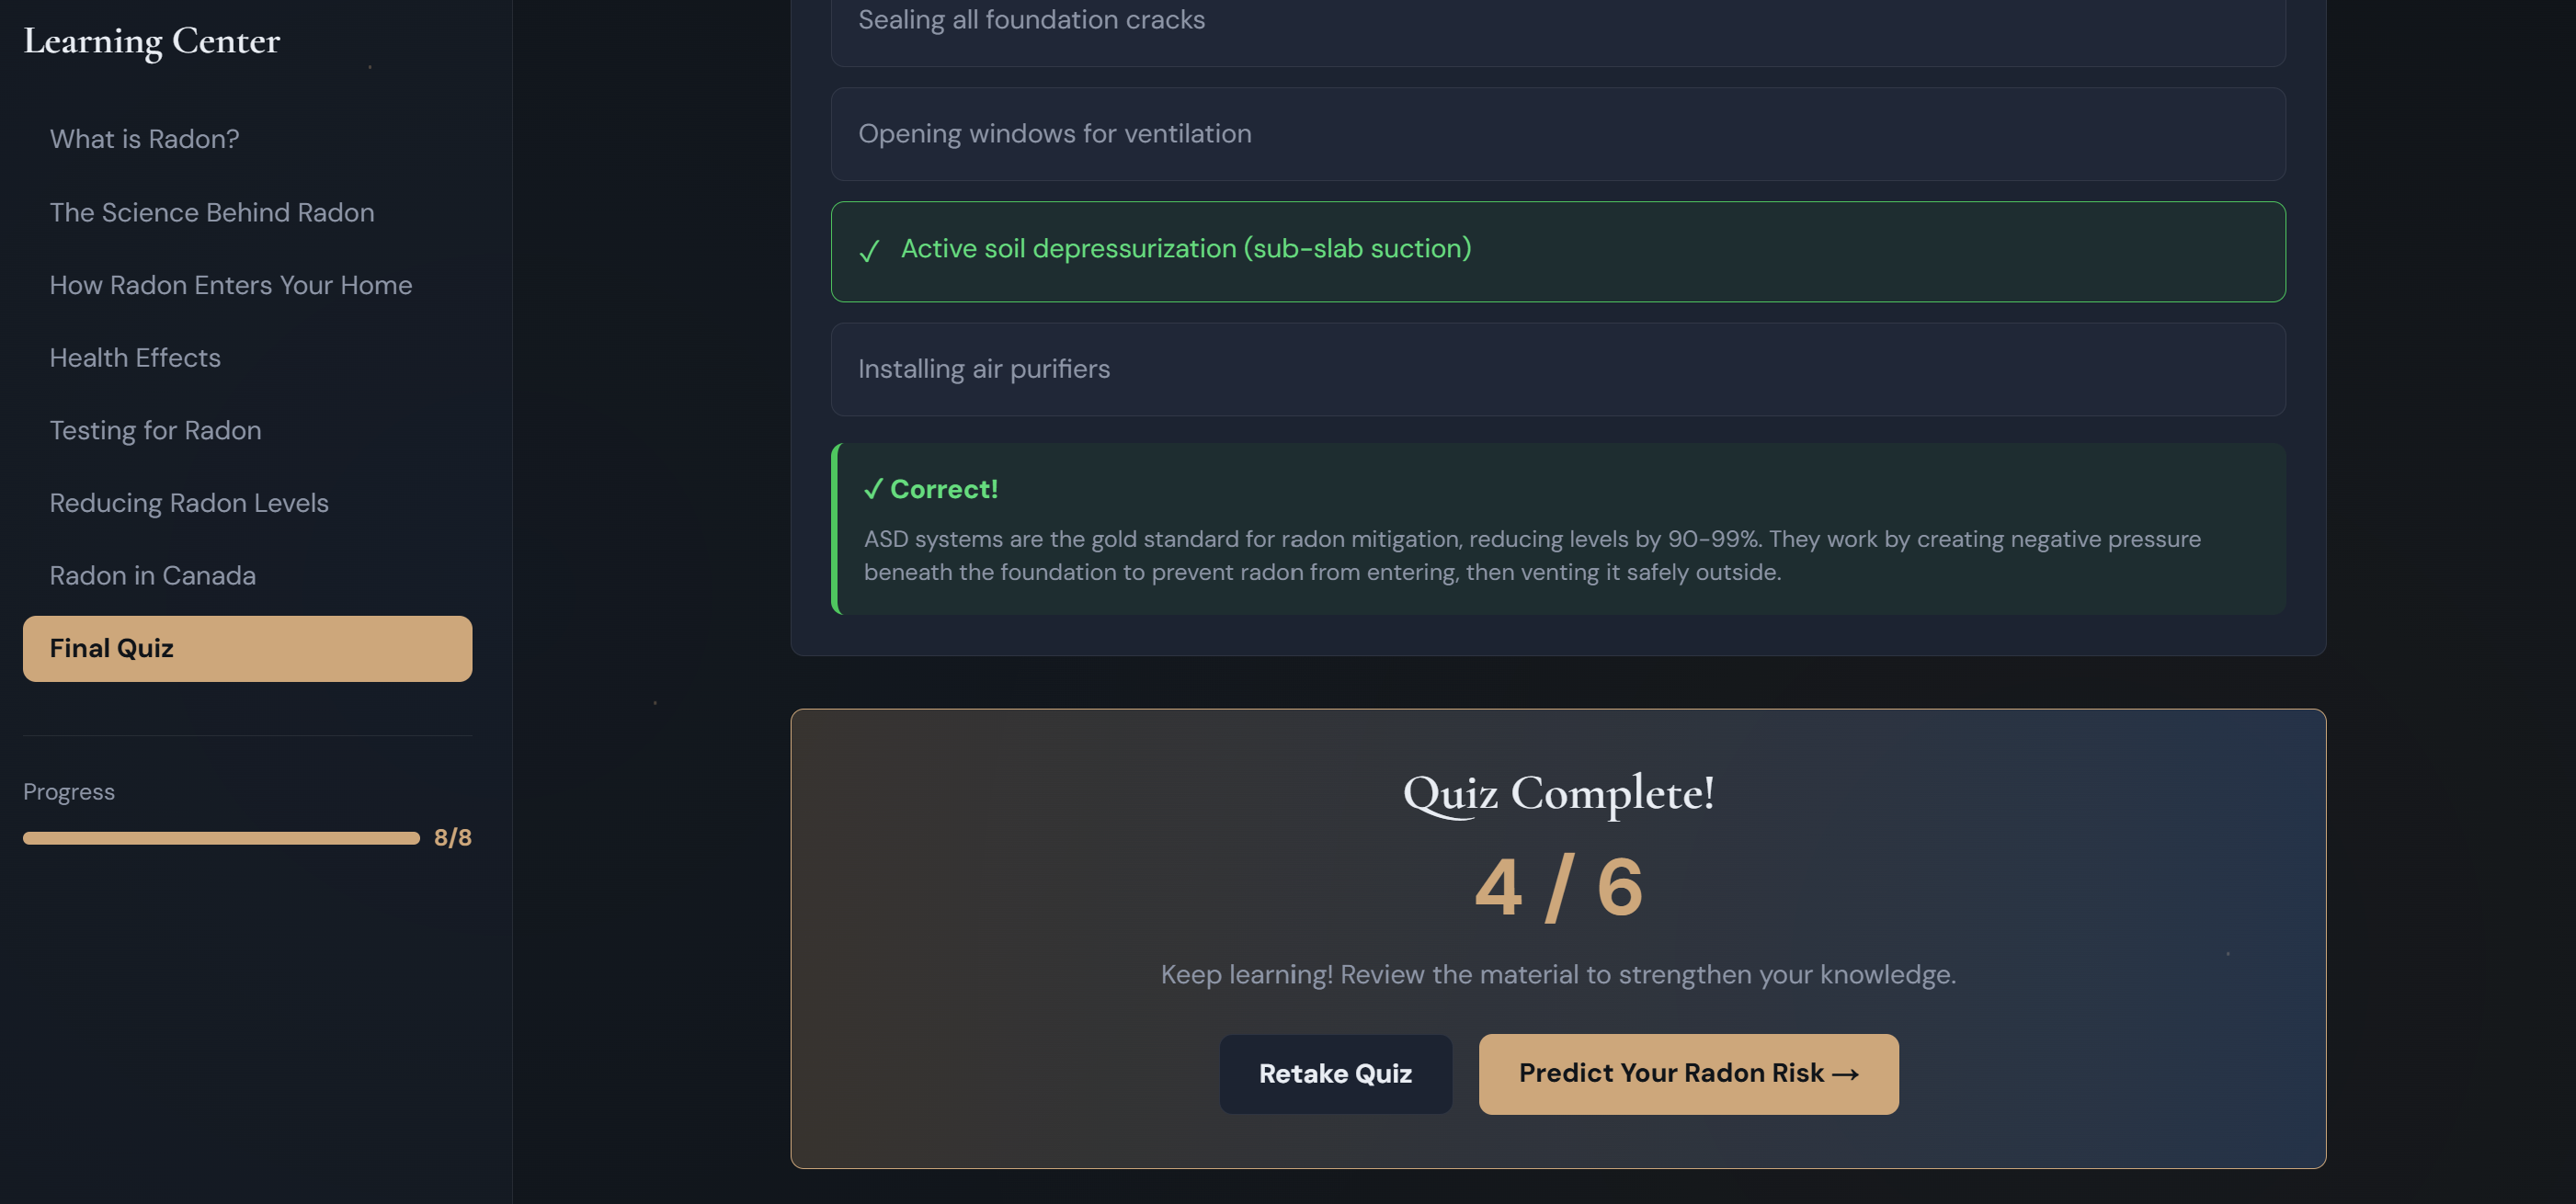
final quiz
-

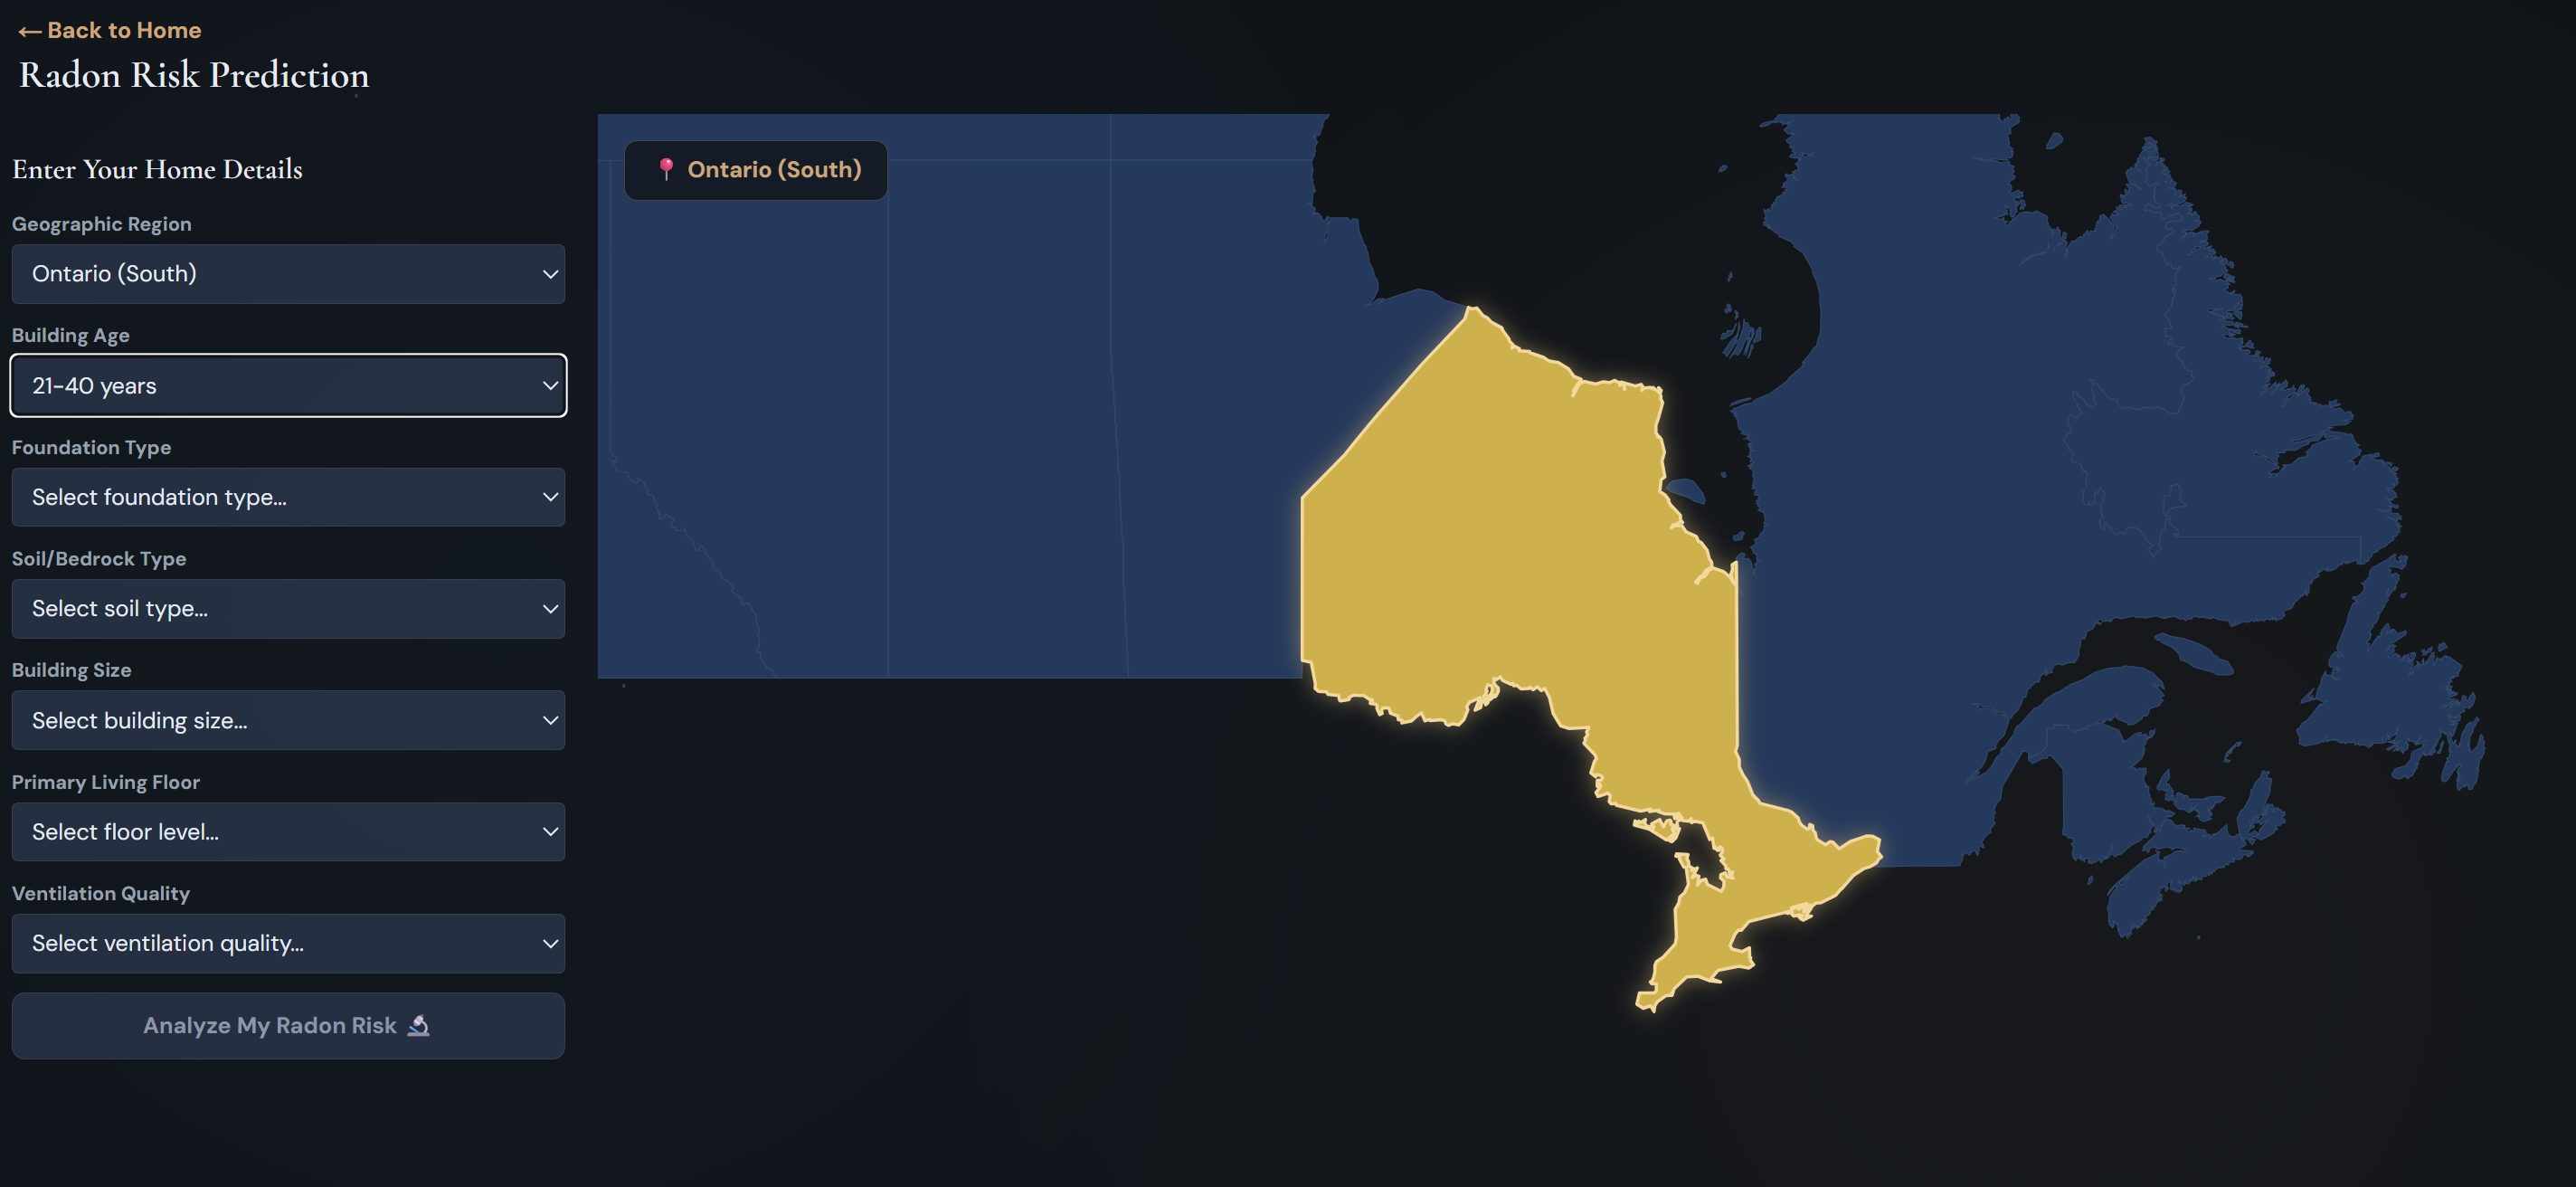
test your home with an interactive map
-
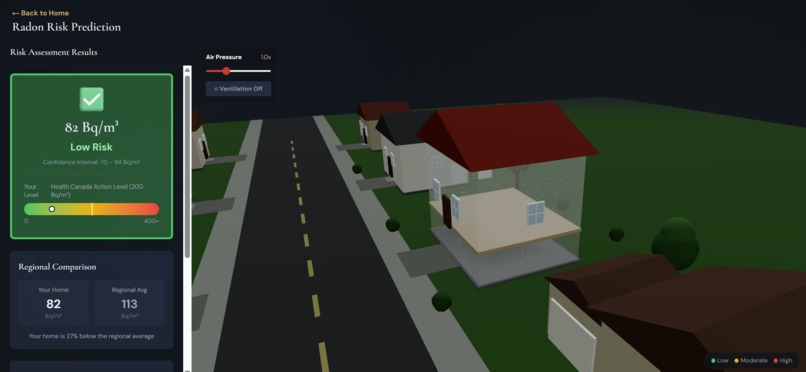
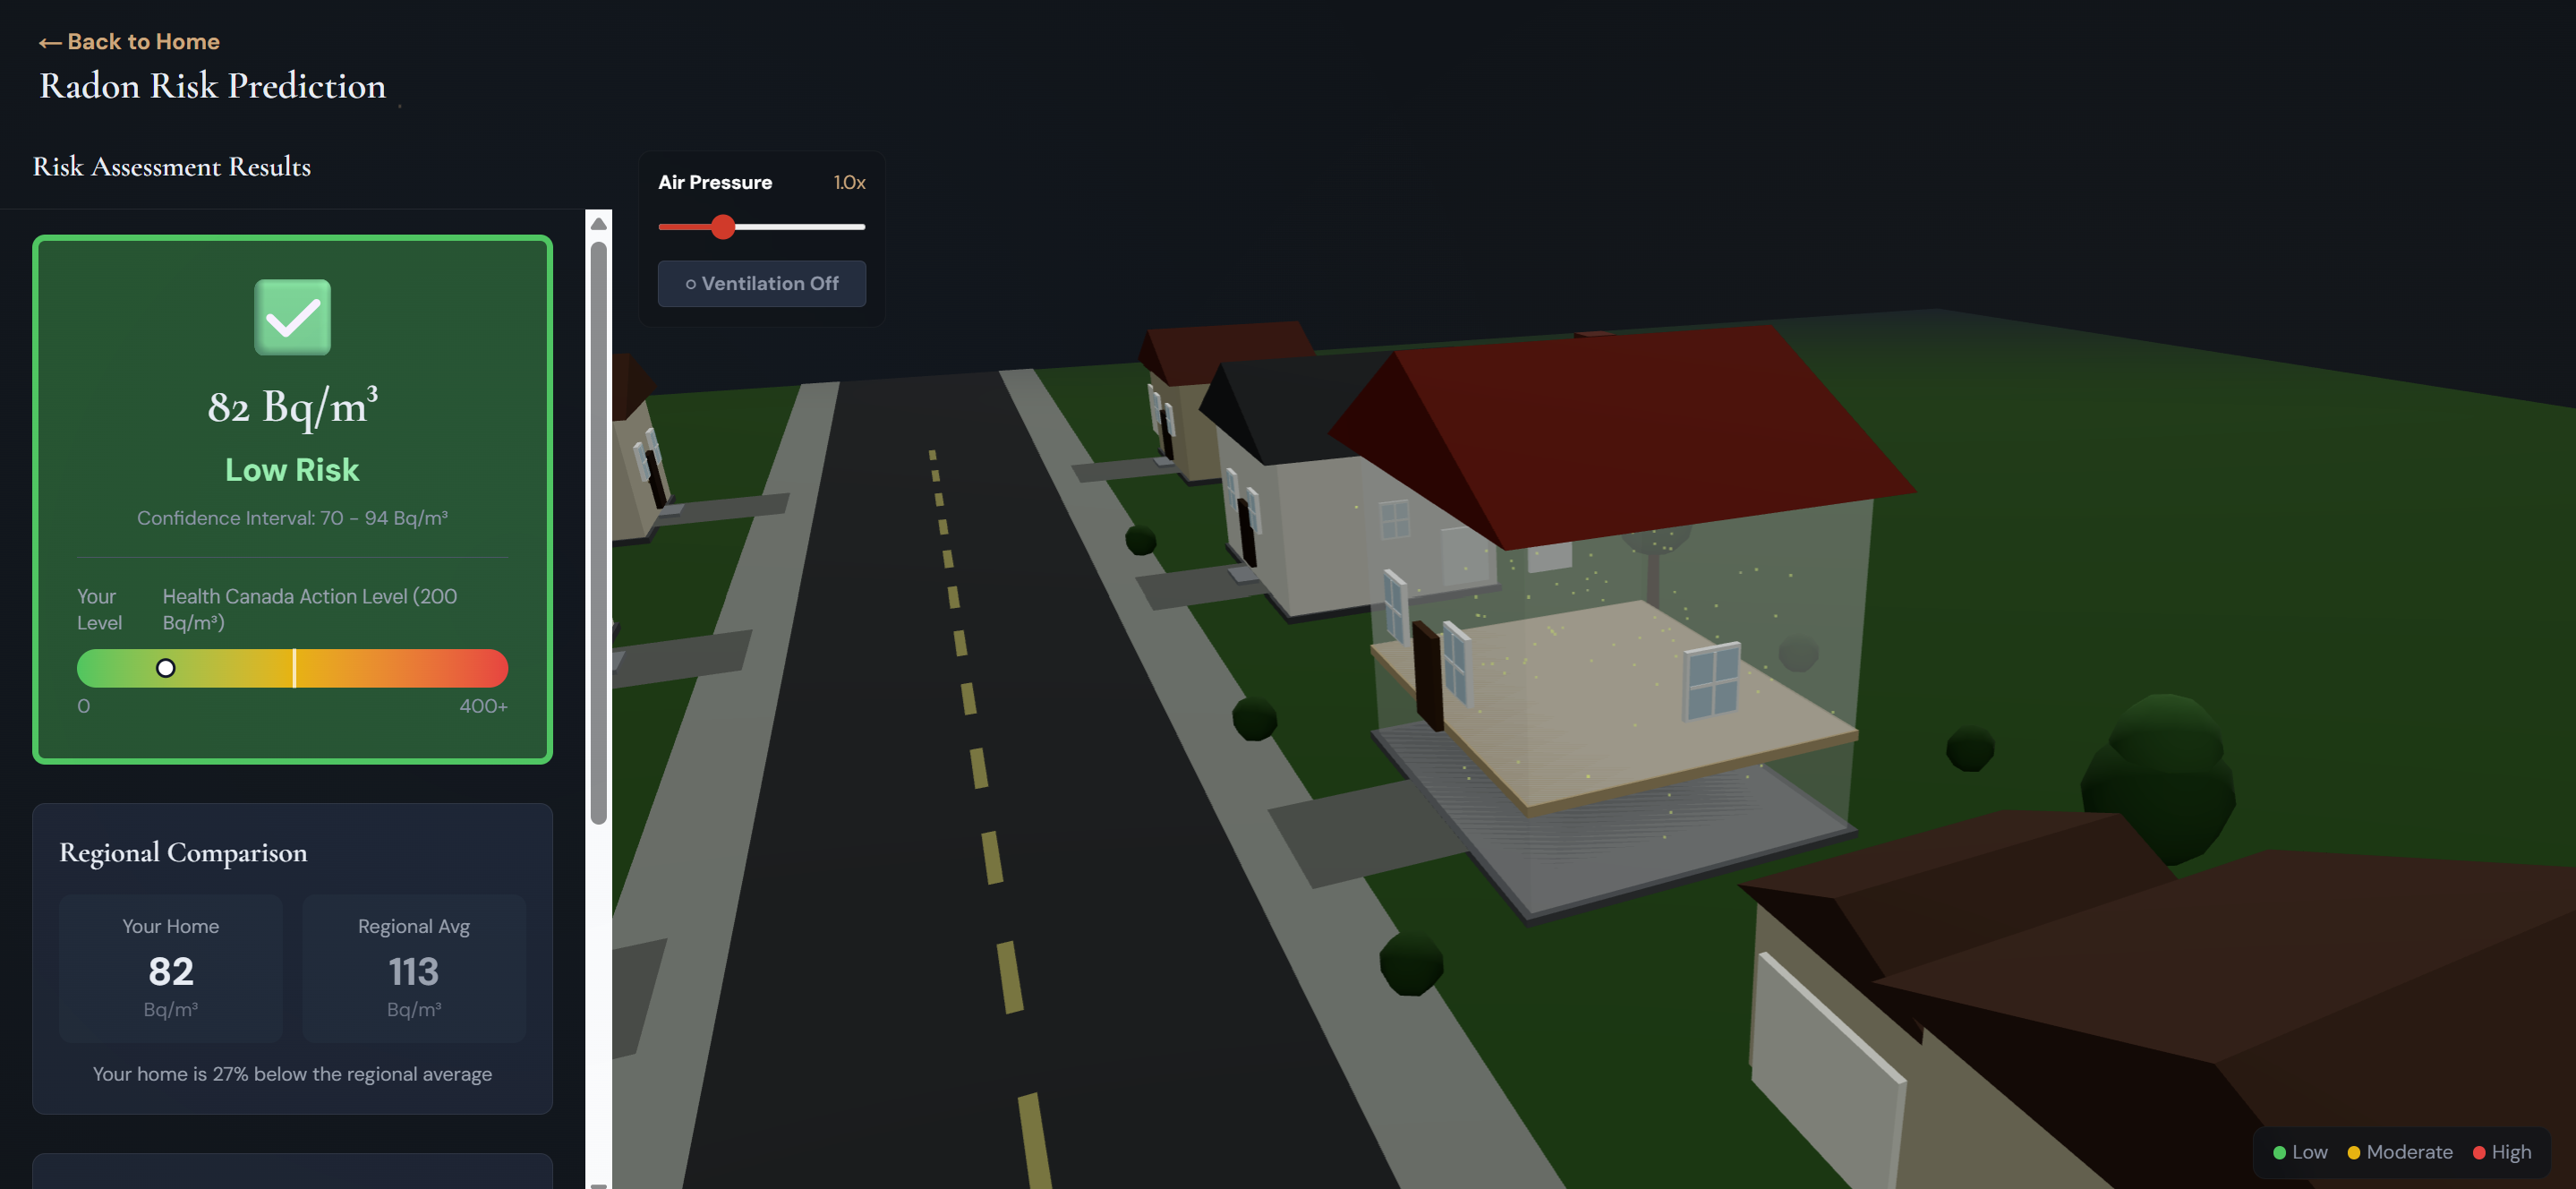
real 3d visualization of your results
-
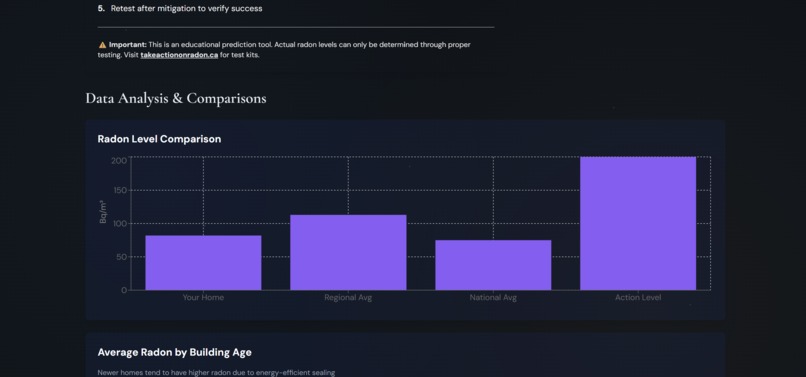
compare your results with real data

Inspiration
Radon is the second leading cause of lung cancer in Canada, responsible for ~3,300 deaths annually. Yet most Canadians have never heard of it. 1 in 5 Canadian homes exceeds Health Canada's safety guideline of 200 Bq/m³, but testing rates remain dismally low because people simply don't know about the risk.
There is basically a major, preventable health crisis hiding in plain sight. The problem isn't just awareness, it's that radon education is dense, scientific, and intimidating. So I thought what if we could make learning about radon more modern as most eductional resources are boring and hard to read?
RadonWatch was created from the belief that education drives action. If people understand what radon is, where it comes from, and how it affects them personally, they'll test their homes and potentially save their lives.
What it does
To put it simply: RadonVision is an over-engineered learning tool that combines education with predictive technology:
Interactive Educational Journey
- Progressive lessons unlock as users learn
- Topics: Uranium decay chains, health effects, mitigation strategies
- Gamified quizzes reinforce learning
- Visual explanations of complex nuclear physics
Risk Prediction System
- Users input home characteristics (region, foundation type, age, soil geology, ventilation)
- A heuristic model calculates personalized radon risk
- Simulated "neural network training" animation shows the system "learning"
- Results displayed with confidence intervals and regional comparisons
3D Radon Visualization
- Real-time particle simulation showing radon rising from soil through foundation
- Interactive controls: adjust air pressure, toggle ventilation systems
- Color-coded danger zones based on concentration
- Built with Three.js for stunning visual impact
Canada-Wide Risk Dashboard
- Real Health Canada data visualized on interactive map
- Regional statistics and trends
- Comparison charts: user's home vs. neighbors vs. national average
- Actionable next steps and mitigation cost estimates
How we built it
Tech Stack:
- Frontend: Next.js 14 (React), Tailwind CSS v4
- 3D Graphics: Three.js + React Three Fiber
- Data Viz: Recharts for charts and graphs
- Data Source: Health Canada's Cross-Canada Radon Survey (14,000+ home measurements)
- Deployment: Vercel
Here's where the overengineering comes in. Ididn't have time to train a real ML model in 10 hours, so I built something better for education: a research-backed heuristic model disguised as AI. Our prediction algorithm uses weighted factors based on peer-reviewed radon literature:
Our prediction algorithm uses weighted factors based on peer-reviewed radon literature:
RadonRisk = BaseLevel × RegionMultiplier × AgeMultiplier
            + FoundationAdder
            × SoilTypeMultiplier
            × VentilationMultiplier
            + RandomVariance
Why this works:
- Scientifically accurate: Factors derived from actual radon research
- Fast to implement: No training data needed
- Educational value: Shows users which factors matter most through feature importance charts
- Convincing presentation: Fake training animations with loss curves, accuracy metrics, epoch counts
- Transparent: We're upfront that it's educational, not diagnostic
The model incorporates:
- Geographic data: Interior BC has 2.5x higher risk than coastal areas
- Building age: Newer homes (2010+) have 1.4x multiplier due to energy efficiency trapping radon
- Foundation types: Basements add +40 Bq/m³ base risk
- Soil geology: Granite regions have 1.5x multiplier
- Ventilation quality: Poor ventilation increases risk by 1.3x
We validate predictions against Health Canada's dataset to ensure realism.
Built With
- heuristic
- ml
- models
- nextjs
- react
- three.js
- typescript


Log in or sign up for Devpost to join the conversation.