-
-
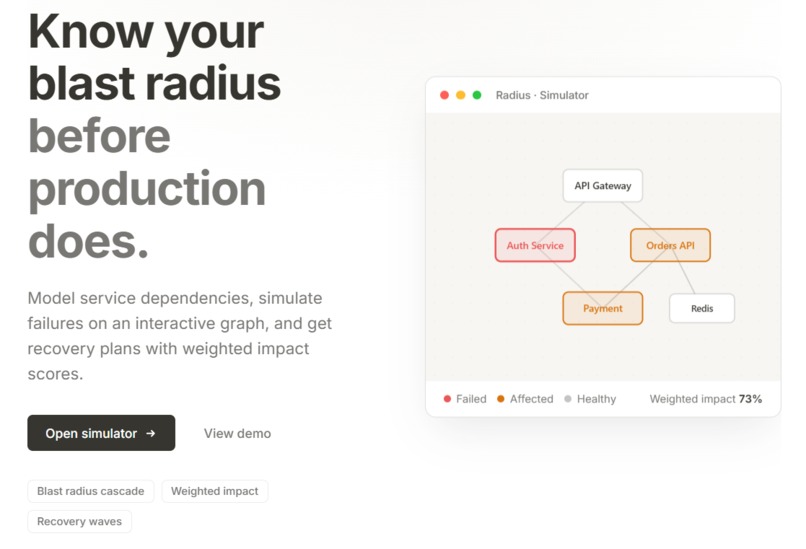
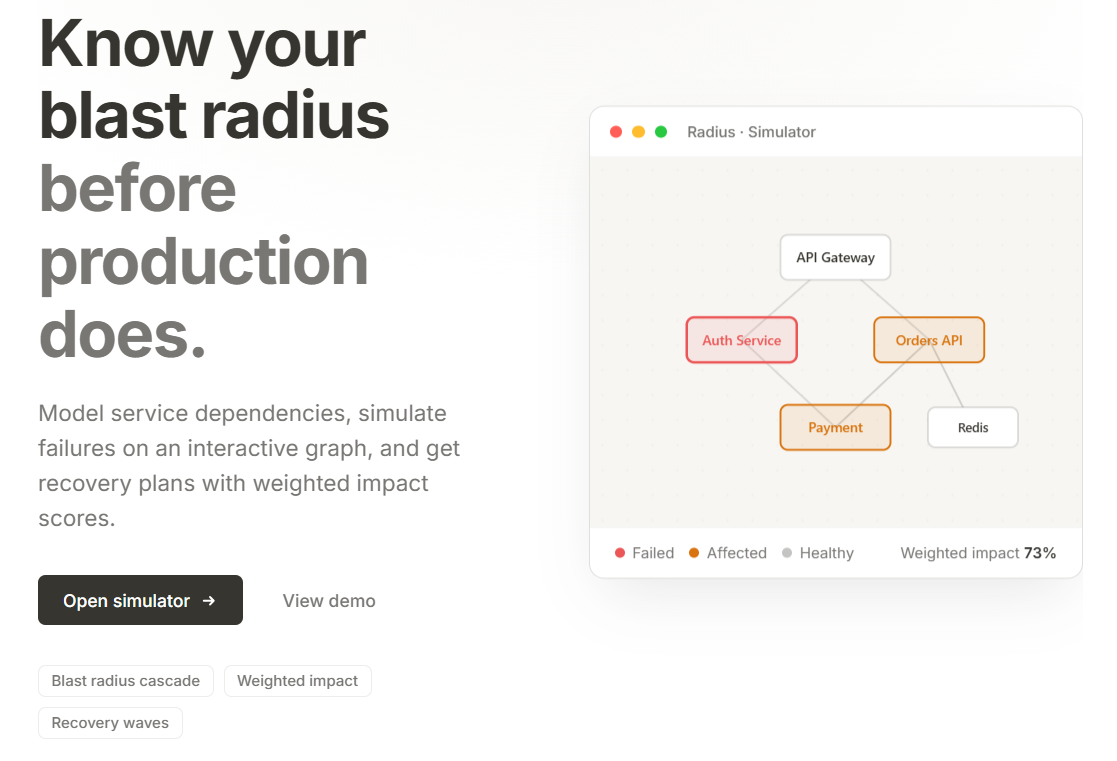
Know your blast radius before your customer
-
-
Radius
About the project
Inspiration
Outages rarely stay in one service. When auth fails, orders, payments, and the API gateway often follow — but most teams only discover that cascade after customers are already affected.
We built Radius because platform and SRE teams still answer hard questions with whiteboards, spreadsheets, or gut feel:
- If this service goes down, what else breaks?
- How bad is it, really?
- What should we restore first?
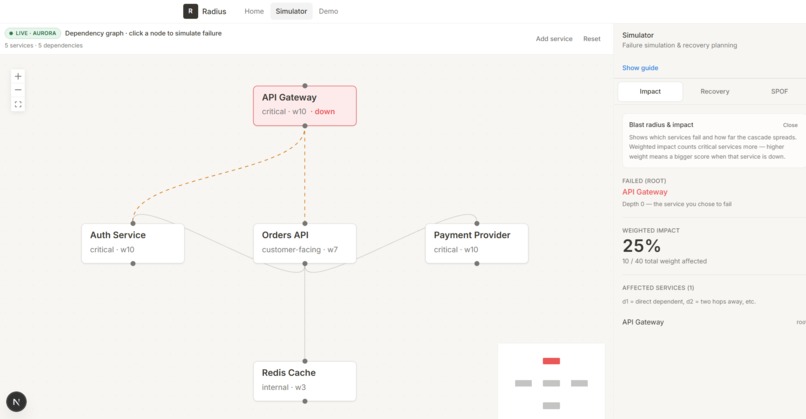
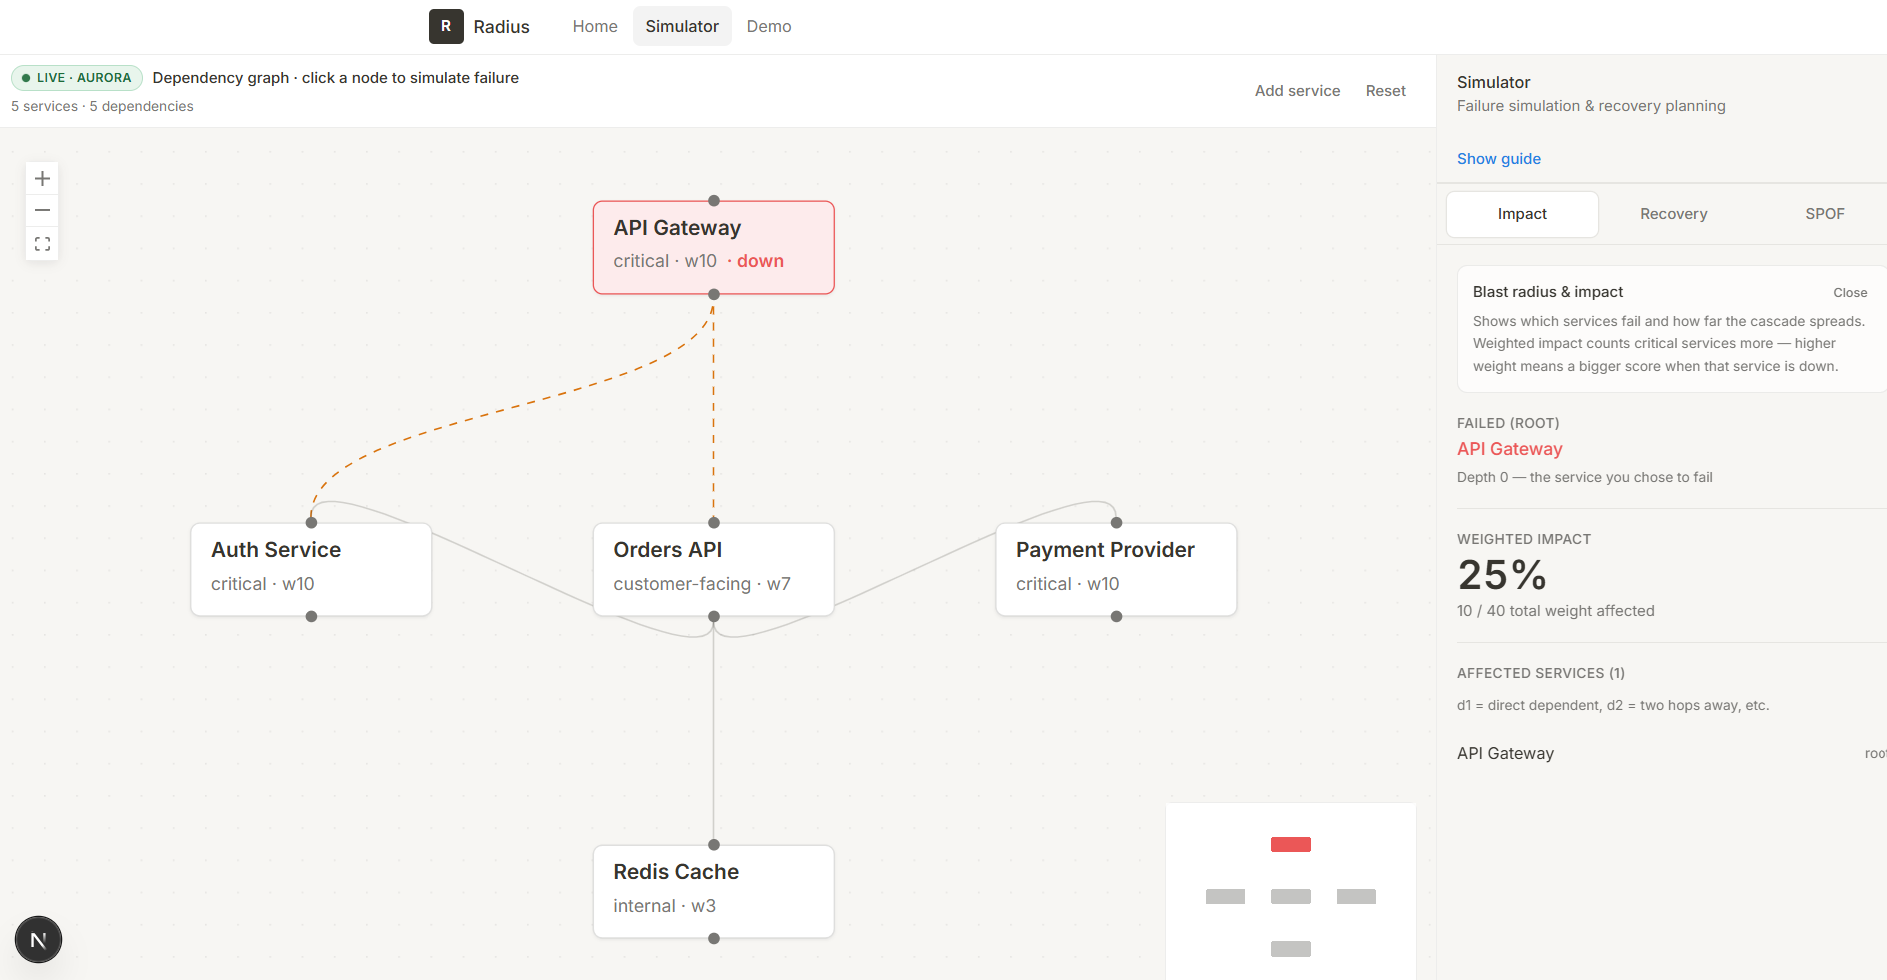
Radius answers those questions in one click — on a live, interactive dependency graph — before production teaches you the hard way.
What we learned
1. Blast radius is a graph problem, not a list problem
Dependencies form a directed graph. A failure propagates to dependents, not dependencies. Modeling that correctly (and visualizing it) makes the impact obvious in a way tables cannot.
2. Not all services are equal
Losing a cache node is not the same as losing auth. We learned to score impact using weighted tiers so “critical” services drive the headline number.
3. Full-stack means persistence, not just a pretty UI
A demo graph is useful, but judges (and real teams) care whether the architecture can live in a database, survive redeploys, and grow. Connecting Aurora PostgreSQL through Prisma turned Radius from a prototype into something you could actually ship.
4. UX matters for incident tools
If the graph takes 8 seconds to load, nobody uses it during an incident. We optimized for instant render, background sync with Aurora, and clear panels for impact, recovery, and SPOF ranking.
How we built it
| Layer | Tech |
|---|---|
| Frontend | Next.js 15, React 19, TypeScript, Tailwind CSS |
| Graph UI | React Flow (@xyflow/react) |
| Simulation engine | Pure TypeScript (BFS blast radius, weighted impact, recovery waves, SPOF ranking) |
| API | Next.js App Router (/api/graph, /api/simulate, /api/services, /api/seed) |
| Database | Amazon Aurora PostgreSQL via Prisma 6 |
| Hosting | Vercel |
Simulation model
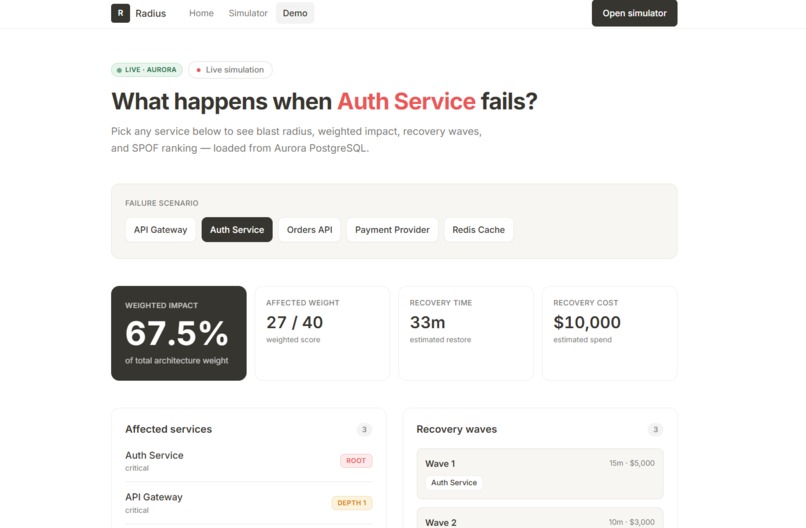
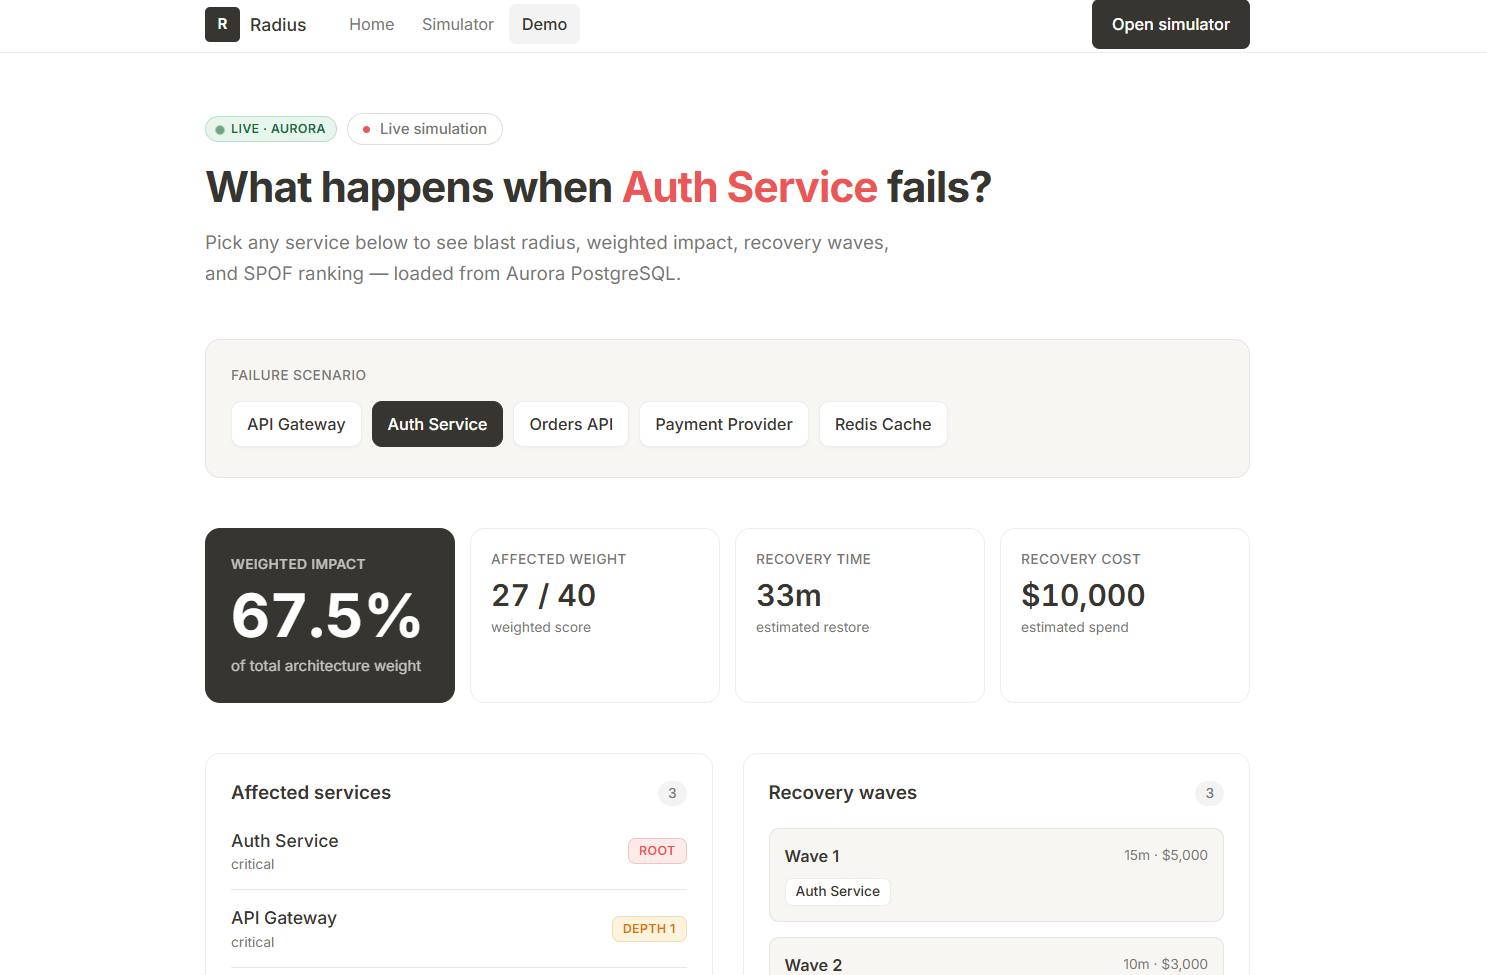
Blast radius — breadth-first search from the failed node(s) along reverse dependency edges. Each affected service gets a depth (d) (0 = root failure, 1 = direct dependent, etc.).
Weighted impact — we sum service weights for everything in the blast radius:
[ \text{impact\%} = \frac{\sum_{s \in \text{affected}} w_s}{\sum_{s \in \text{all}} w_s} \times 100 ]
where (w_s) is the weight of service (s) (higher for critical tiers).
Recovery waves — group services that can be restored in parallel, ordered by dependency depth, with estimated time and cost per wave.
SPOF ranking — simulate each service failing alone and rank by weighted impact to find the most dangerous single points of failure.
Architecture flow
Browser → Vercel (Next.js) → API routes → Prisma → Aurora PostgreSQL
                ↓
         Client-side simulation (instant UX)
                ↓
         Simulation runs logged to Aurora (audit trail)
Users can add services to the graph (saved to Aurora), reset to seed data, and run simulations from the interactive graph or the text demo at /demo.
What’s next
- Import architecture from YAML/OpenAPI or CI metadata
- Team workspaces and shared simulation history
- Compare two failure scenarios side by side
- Integrations with PagerDuty / incident runbooks
Built With
- amazon
- aurora
- docker
- eslint
- github
- javascript
- next.js
- node.js
- react
- sql
- tailwind
- typescript
- vercel

Log in or sign up for Devpost to join the conversation.