RadioGenomics Bridge — turning plain-English cancer research questions into matched patient cohorts, survival curves, and governed SQL in seconds, not weeks.
Inspiration
Cancer research runs on a cruel bottleneck: the data already exists, but it lives in separate silos that don't talk to each other. Imaging sits in one archive, genomics in another, and clinical outcomes in a third. To ask a simple question like "Do IDH1-mutant gliomas survive longer?", a researcher has to pull from each source by hand, reconcile patient identifiers, filter cohorts manually, and stitch it all into an analysis-ready table. That takes one to two weeks per question, and most of it is plumbing, not science. We kept coming back to one idea: what if the interface to this data were a question, not a pipeline? A researcher shouldn't have to learn SQL, DICOMweb, and three schema dialects to test a hypothesis. They should just ask.
What it does
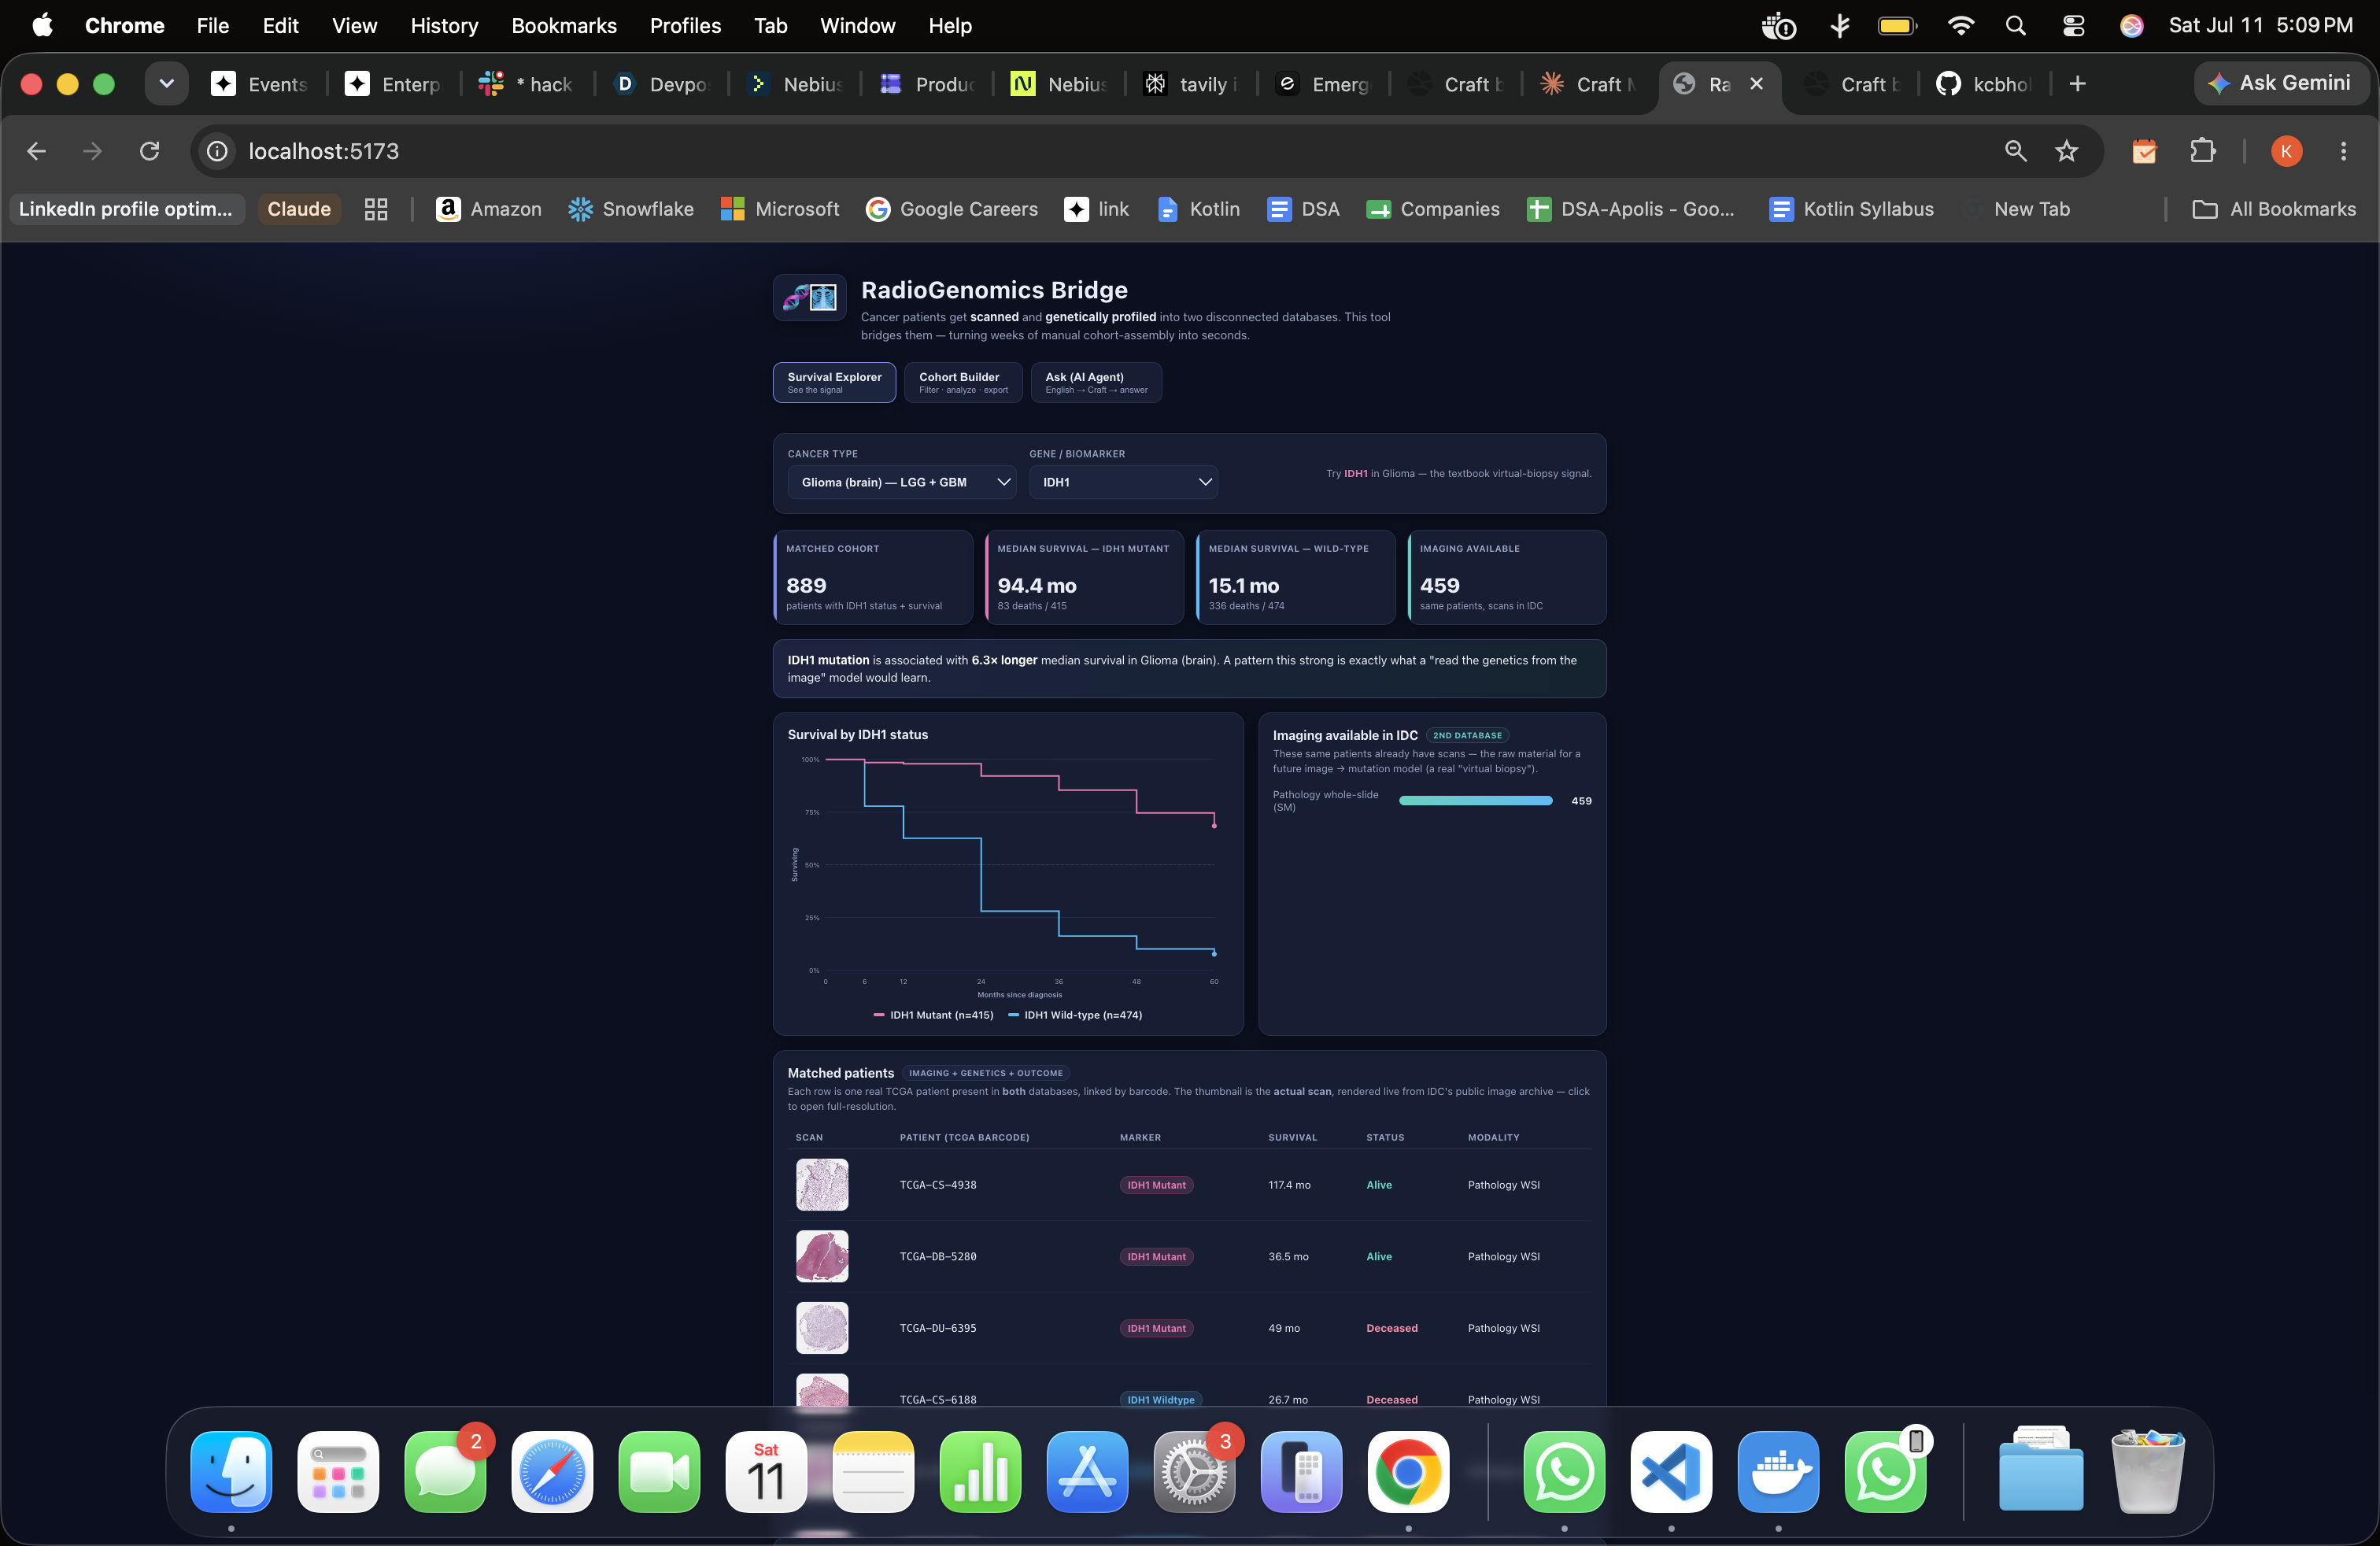
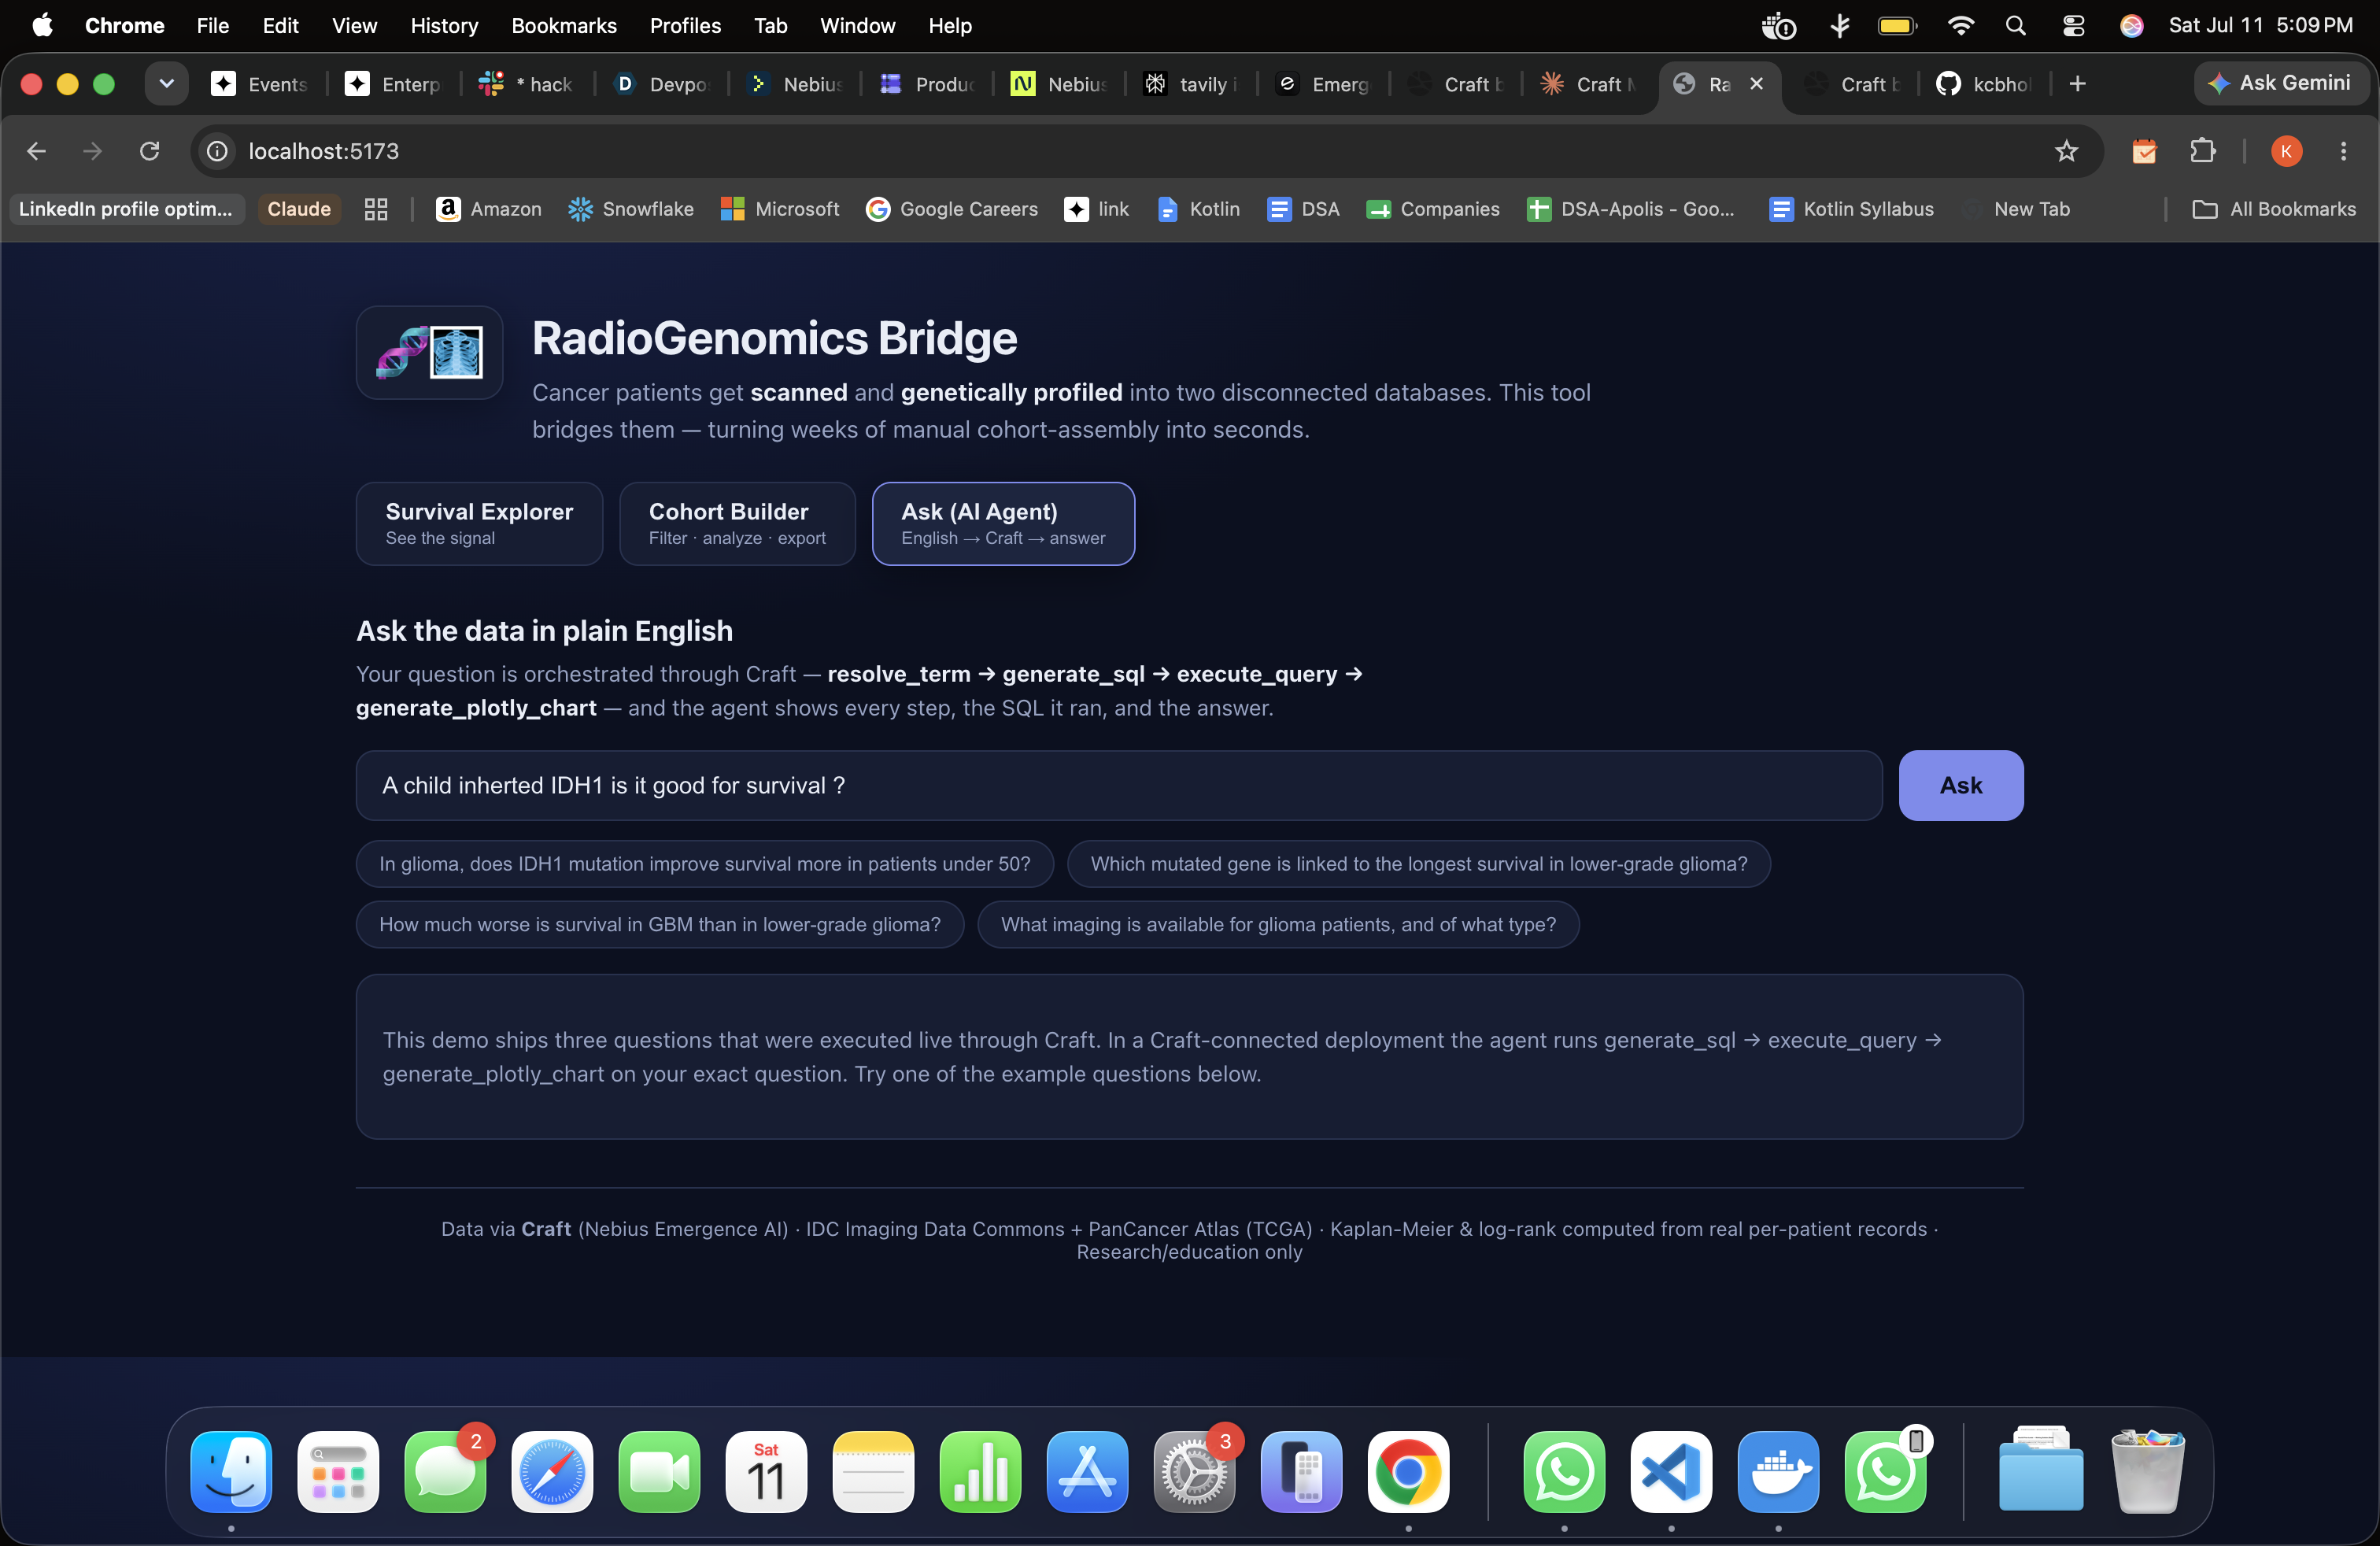
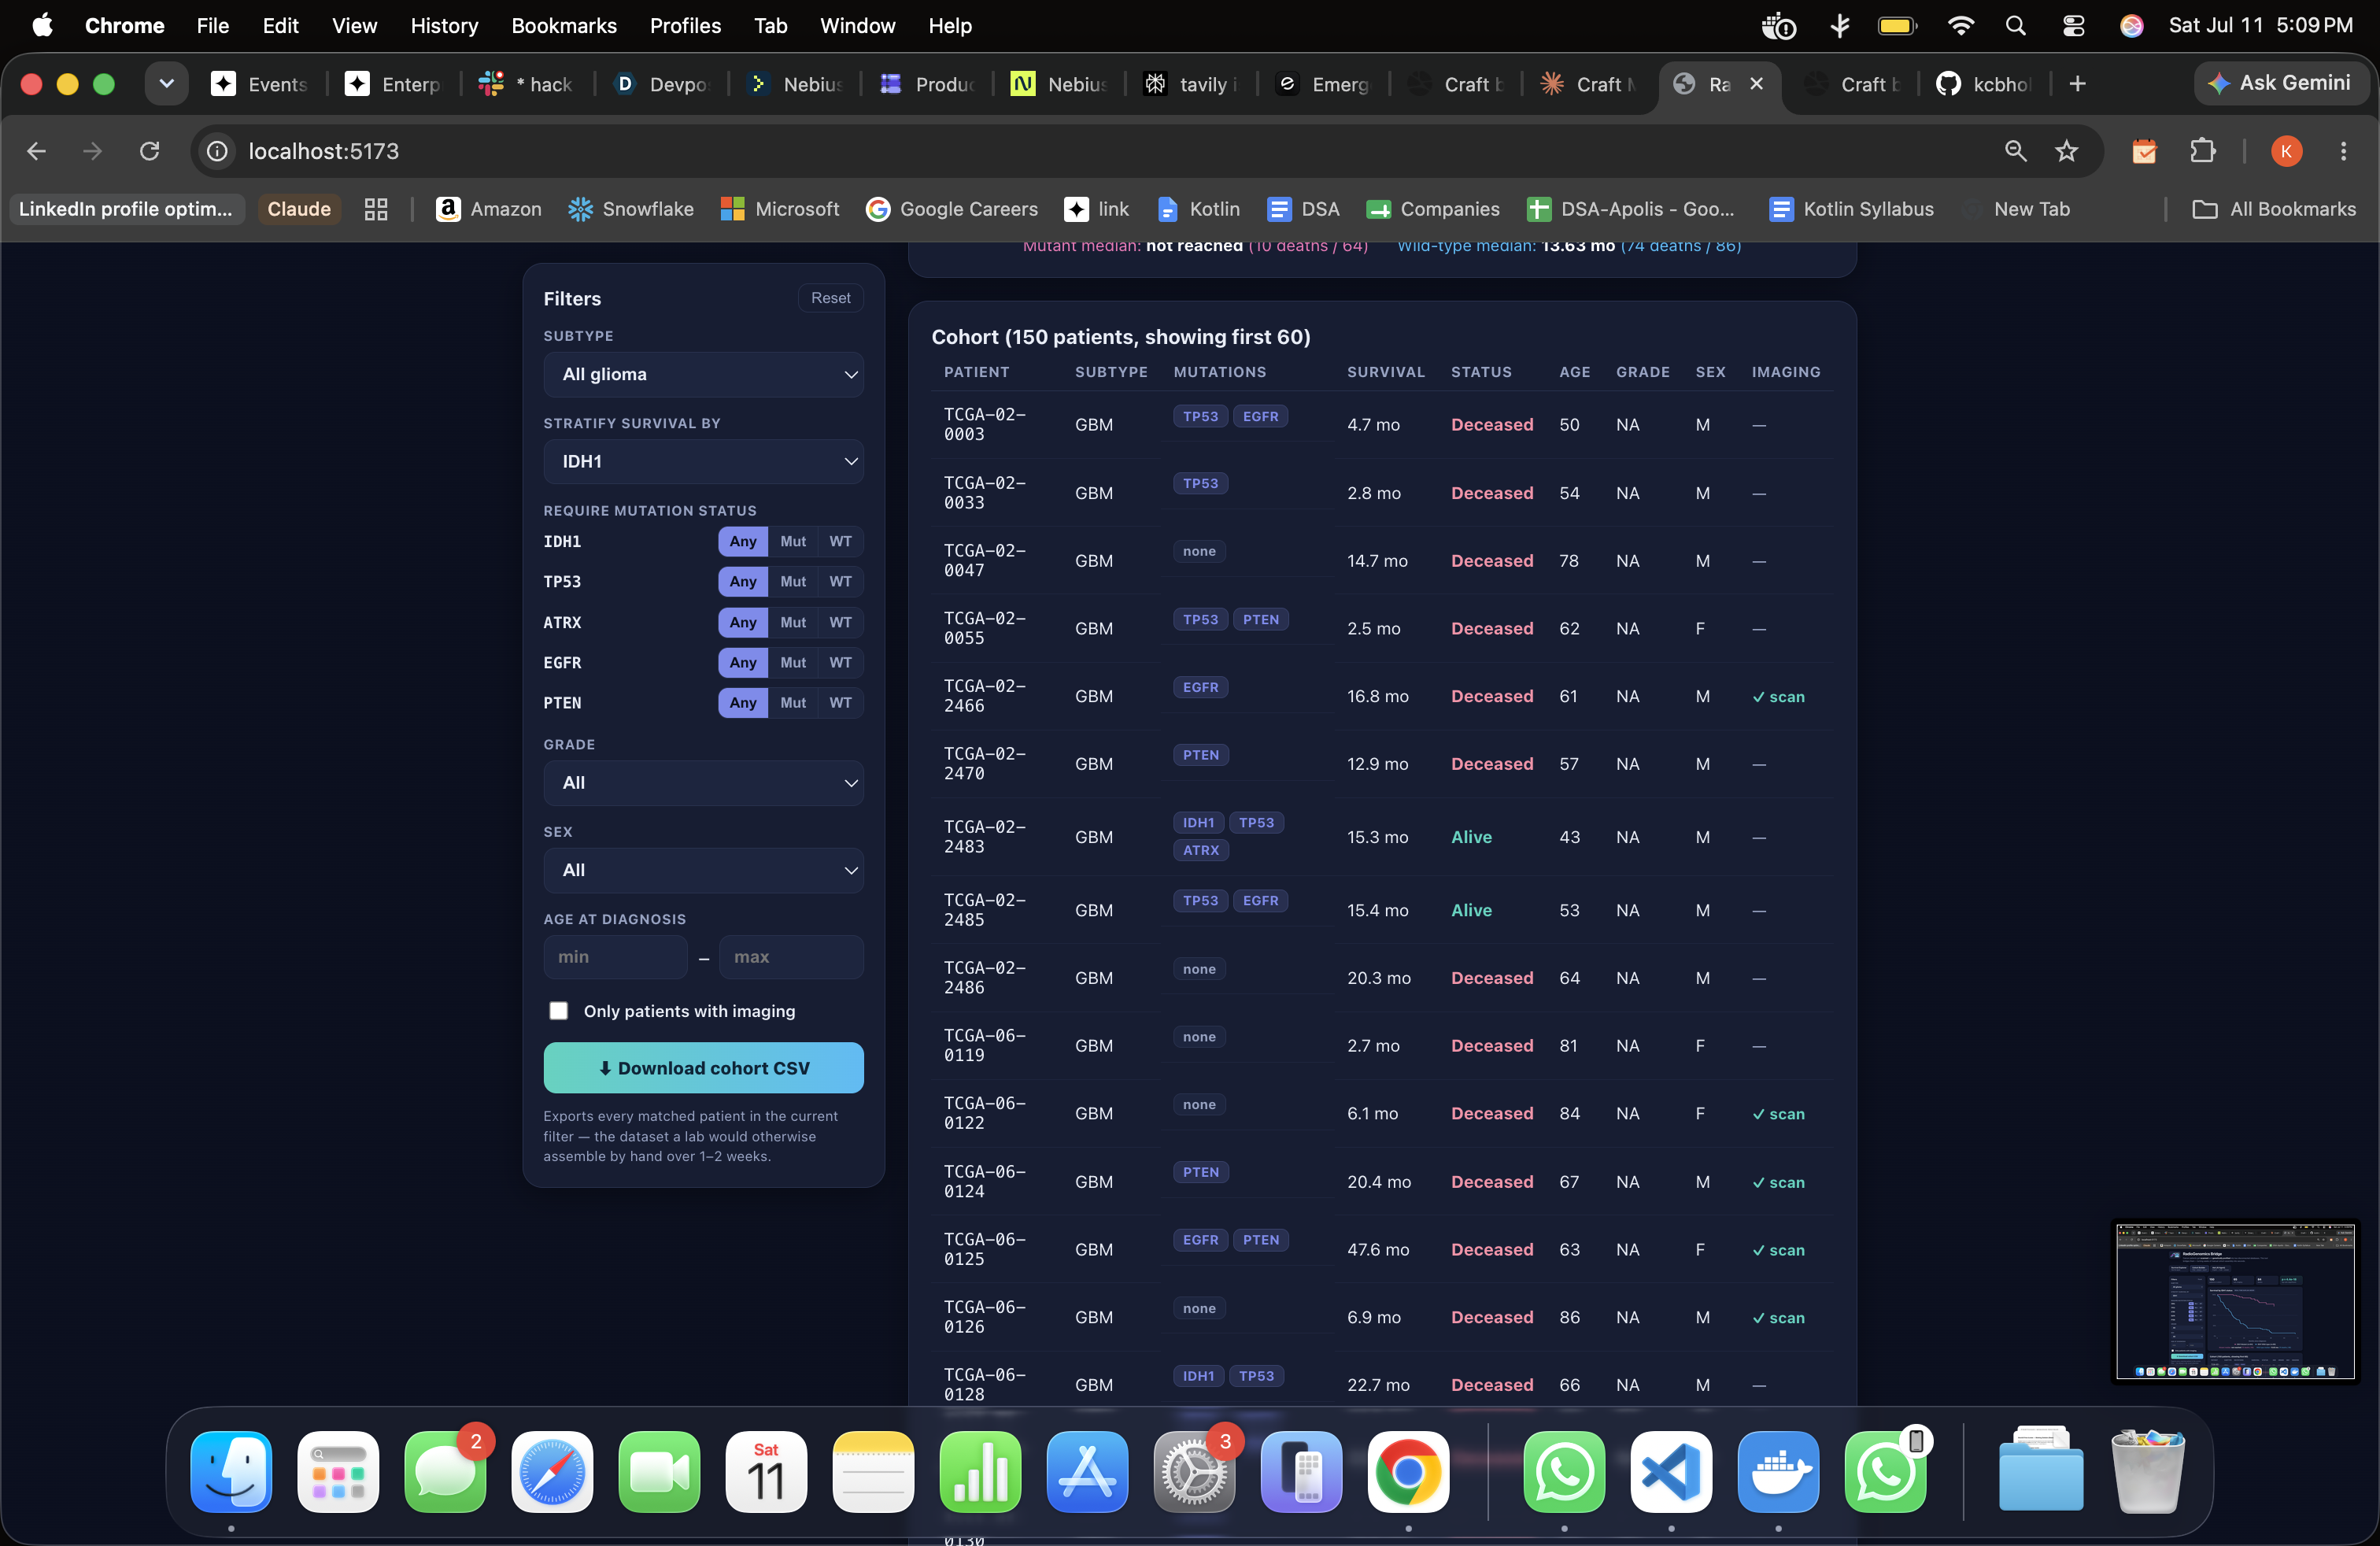
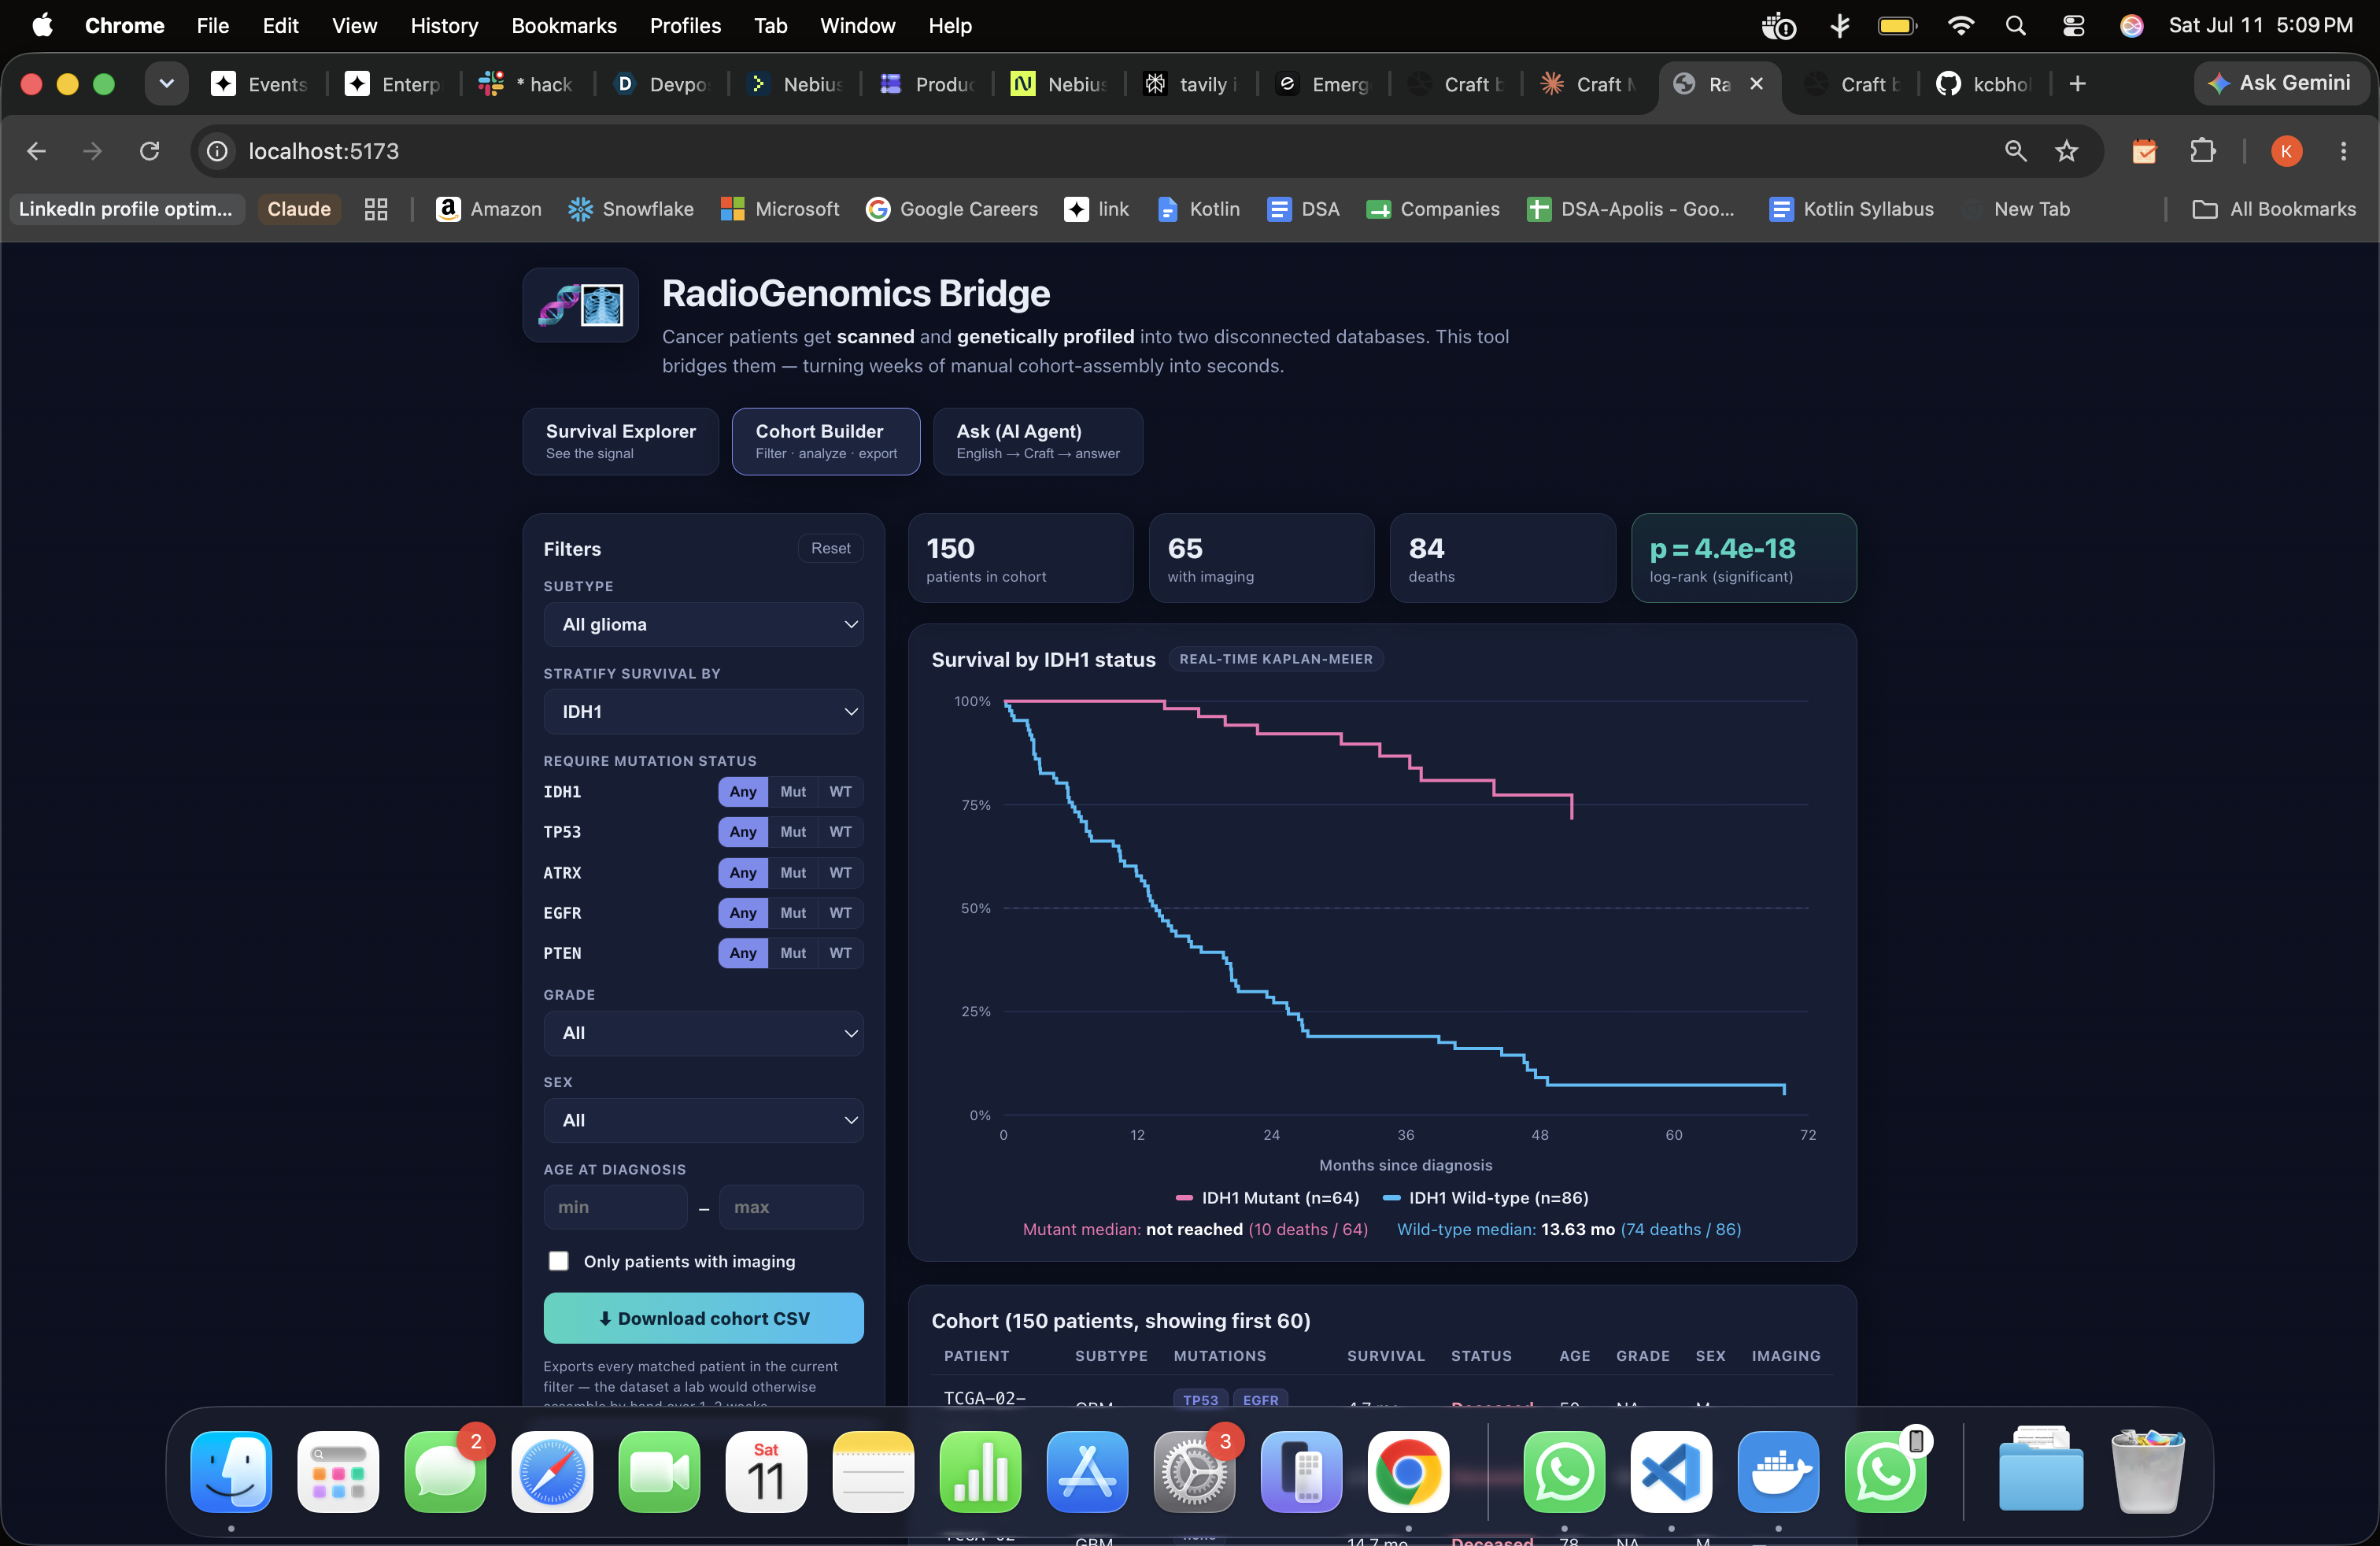
RadioGenomics Bridge is a full-stack app with three connected tools. The Cohort Builder lets you filter 150 glioma patients across genomic and clinical dimensions, with real Kaplan-Meier survival curves and log-rank p-values computed live, plus one-click export to an analysis-ready CSV. The Survival Explorer offers cascading selection with automated insight generation for fast hypothesis scanning. And the Ask tab lets you type a research question in plain English; a Craft-orchestrated agent translates it into governed Snowflake SQL, runs it live, and returns an answer, a chart, and a full provenance trail spanning both genomics and imaging datasets.
What we learned
What we learned
Governance is a feature, not a tax. We assumed "AI writes SQL" would be the scary part for a research audience, but the opposite was true: the moment queries became governed and auditable, with every step from question to SQL to result visible, trust went up. Provenance is what makes an AI answer usable in science. We also learned that the hard problem is semantic, not syntactic. Translating a question to SQL is easy; translating "overall survival" into the right columns, join keys, and censoring logic across two schemas is the actual work. And bridging silos is mostly about identifiers. The unglamorous truth of radiogenomics is that most of the effort is matching a patient across an imaging collection and a genomic table.
How we built it
The stack is a React frontend talking to an Express backend, which calls Craft over MCP, which queries live Snowflake data from TCGA and IDC. The frontend uses a tab-based container to route the three exploration modes, with survival curves and results rendered through a dark-theme Plotly component. The backend exposes cohort-builder and natural-language agent endpoints, backed by an agent service that matches questions to Craft-executed runs and serves results with full provenance. Craft does the heavy lifting through its MCP tools: resolving terms, searching the schema, generating governed SQL, executing queries, and generating charts. Survival statistics are computed for real from the live data using the Kaplan-Meier estimator, and strata are compared with a genuine log-rank test that produces the p-value shown next to every curve. Asking "Does IDH1 mutation improve survival in glioma?" produced governed SQL, executed live, and returned a clean signal: IDH1 mutation is associated with improved survival across age groups.
Challenges we faced
Term resolution returned nothing for "overall survival," a reminder that clinical vocabulary rarely maps one-to-one onto columns, so we fell back to schema search and explicit column selection. Imaging modalities were sparser than expected: the glioma collections turned out to contain only Slide Microscopy across 459 patients, not the radiology modalities we assumed, so we adapted the bridge narrative to the data that actually exists. Wiring the Craft MCP client into a live governed Snowflake database meant handling OAuth tokens, short-lived expiries, and token refresh before a single query could run. And throughout, we refused to fake the demo: every survival curve, p-value, and chart comes from a live query against real data with visible provenance. Making that both trustworthy and fast enough to feel instant was the central engineering tension.
What's next
Expanding beyond glioma to more TCGA cohorts and true radiology modalities as imaging coverage grows, surfacing multi-gene and multi-modal cohort queries directly in the Ask tab, and building shareable, reproducible cohort permalinks that freeze a question, its governed SQL, and its result together for citation.
Built With
- cancer
- gene
- genomic

Log in or sign up for Devpost to join the conversation.