-
-
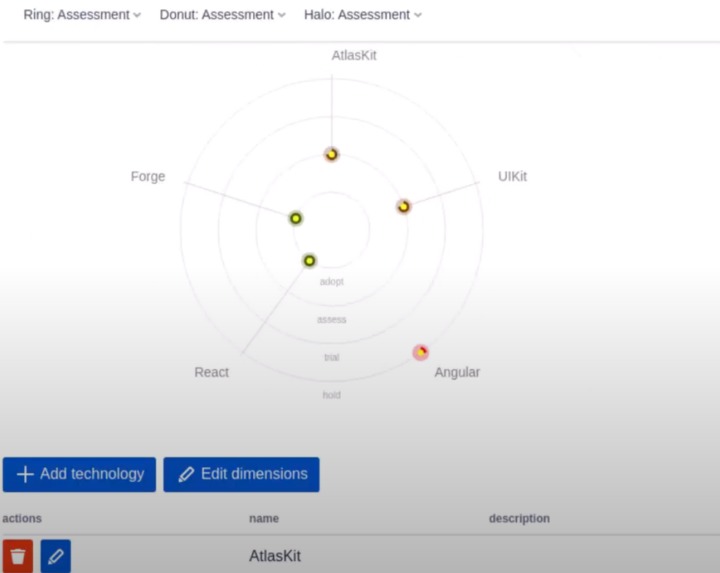
TechnologyRadar
-

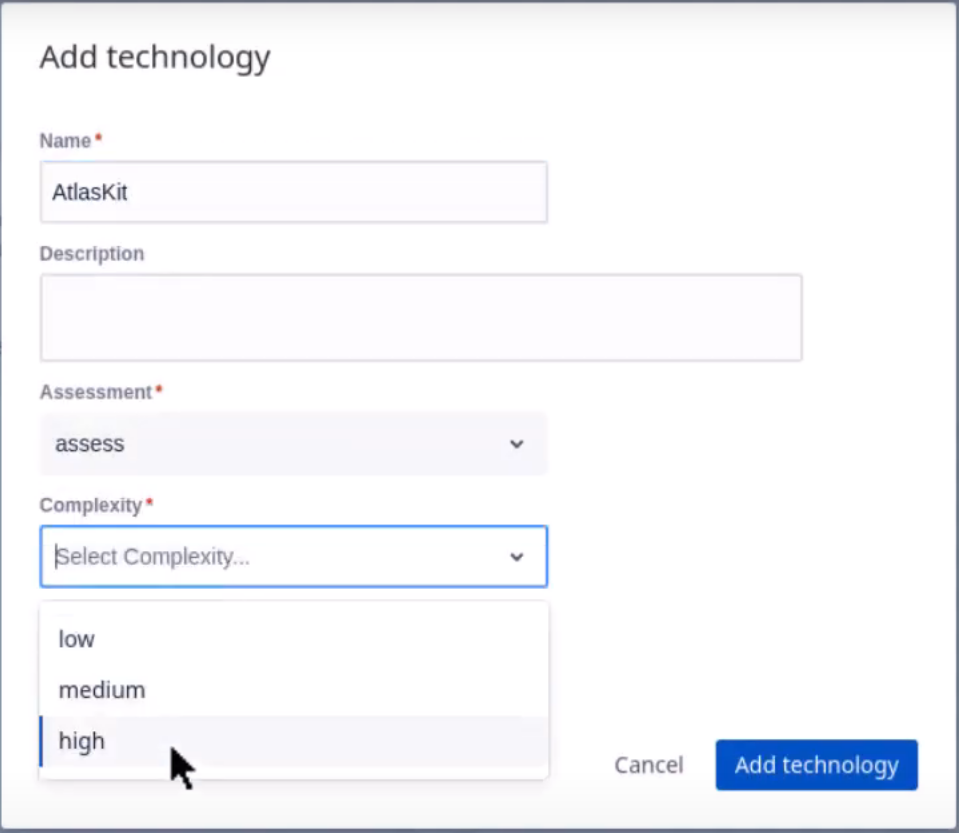
Add technology dialog
-

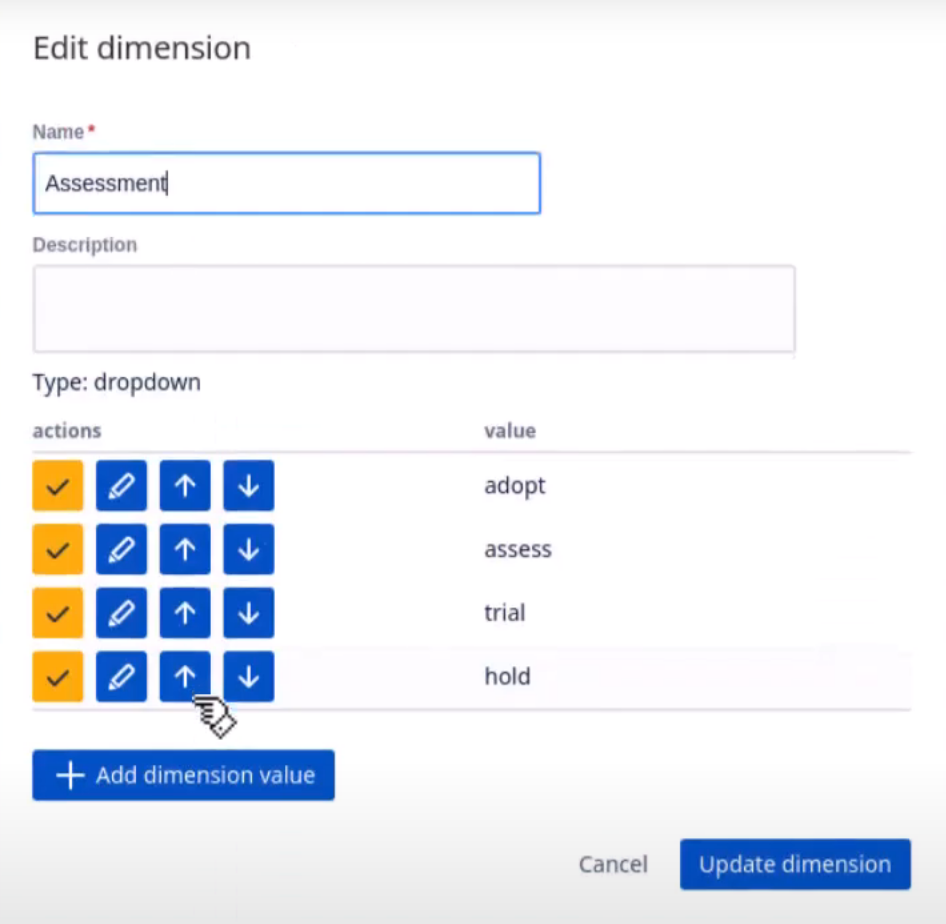
DimensionEditor
-
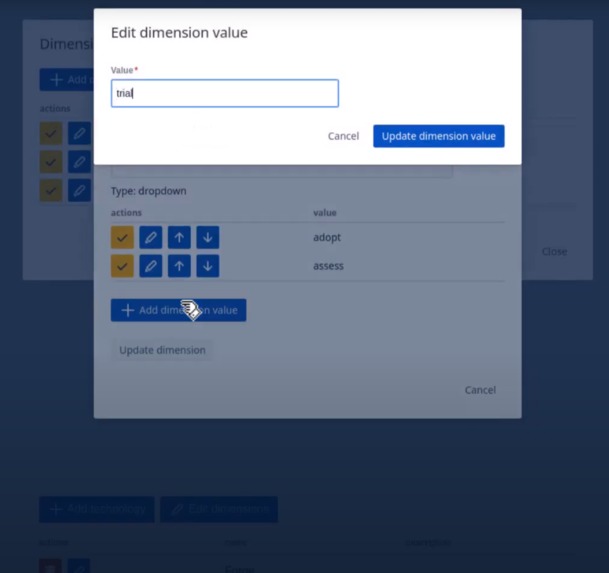
Edit dimension value dialog


Inspiration
"How do you know what the state of all technologies company-wide is?"
"Which technologies to use or avoid in our next project?"
"I am new to the company, where to get an overview of the state of technology in the company?"
The larger companies grow the more complex it gets to keep a consistent view on the state of technologies. Technologies on the market evolve with high velocity and thus make it hard for IT Teams to grasp the current state.
What it does
The TechnologyRadar for Confluence provides an easy and fun way to manage technology state company-wide.
First define your structure (your dimensions) you would like to see for every technology (e.g. Assessment, Complexity, Cost, ...) in the flexible DimensionEditor.
Then add technologies using the TechnologyEditor, which uses your defined dimensions to display dynamic editing dialogs.
Now you are ready to make use of the TechnologyRadar, which is also based on your defined dimensions and displays your available options accordingly. It displays a radar visualization which can be configured using the defined dimensions.
How we built it
We built it with a combination of Forge, JavaScript, UIKit, AtlasKit, React and d3.js and a lot of love and passion.
Lets break it down a little further:
Everywhere: Forge, JavaScript
DimensionEditor: UIKit
TechnologyEditor: UIKit
TechnologyRadar: React, AtlasKit, d3.js
Challenges we ran into
Storing and retrieving complex and related data structures is more difficult than we expected. We evaluated and implemented storing the data of the TechnologyRadar using the Forge Storage API and as Confluence page attachments. Both had several benefits and drawbacks. In the end we settled with storing the data as Confluence page attachments which worked out pretty well.
We also tried to integrate with CQL-queries to gain more flexibility in retrieving data, but could not overcome the inconsistent delay between "add data" and "query for the data".
Designing a flexible data-model which works well for the very different requirements and read/write patterns of the DimensionEditor, TechnologyEditor and TechnologyRadar was difficult.
While implementing the DimensionEditor with UIKit we came to the conclusion that UIKit is too limited for our use-case, but had to stick with it, since no time was left to start from scratch using CustomUI combined with AtlasKit.
Getting the integration right between Forge,React,AtlasKit and d3.js can be hard at times, but is very rewarding, when it finally works smoothly from end to end. Especially making sure redrawing the d3.js visualization does not trigger the retrieval of data is very important to get right.
Accomplishments that we're proud of
We really like how well the data-model behind the DimensionEditor worked out, essentially it makes the whole application "tick".
We also like the integration with d3.js, which is one of the core components.
What we learned
TL;DR: A LOT!
We used both UIKit and AtlasKit. UIKit is (in the current state, which might change over time) too limited for more complex scenarios, but fits well for simple scenarios. If we would start over from the start, we would focus on AtlasKit.
Storing/Retrieving complex data structures led us to the conclusion that there is a lot of space for improvement in this area. We really miss some sort of database (SQL/NoSQL) or at least more flexible options to store and retrieve data.
We also learned a lot about CQL and the flexibility it can bring along, even though we do not currently use it in the app. CQL has potential, so it will be revisited in a future iteration.
What's next for Radars for Confluence
We are developing towards a version to publish on the marketplace and would love to hear your feedback.
Among many things we would like to improve these are the most prominent:
- add far more options to the visualization, like displaying the details of a hovered/clicked technology
- add grouping/filters/multi-level to the visualization
- add the ability to add colors / color-ranges which can be applied automatically
- rewrite the editor using AtlasKit (dropping UIKit completely)
- add templates for the data-model for give customers a quick-start
- store individual settings for customers for the radar visualization

Log in or sign up for Devpost to join the conversation.