-
-
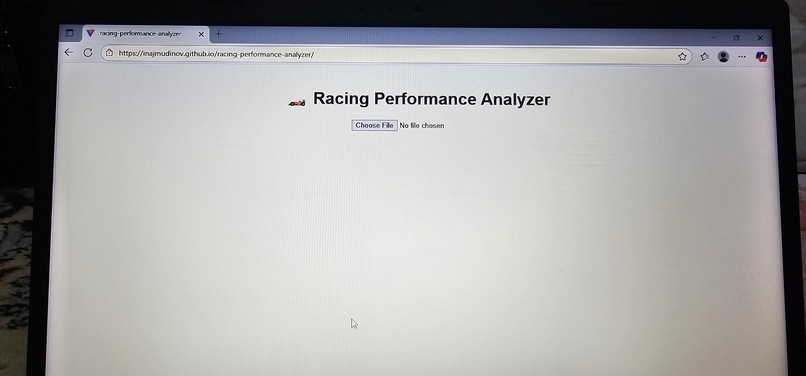
Photo of web applicatiob

Inspiration
Racing has always fascinated me, not just for speed but for the data-driven decisions that teams make to optimize performance. I wanted to build a tool that allows anyone — from hobbyists to aspiring racers — to analyze racing data easily and gain meaningful insights from CSV files.
What it does
The Racing Performance Analyzer lets users: Upload CSV files containing race data. Calculate key metrics like average speed, maximum/minimum speed, and lap consistency. Visualize performance trends using tables and interactive charts. Many calculations use basic racing formulas, for example: v_{\text{avg}} = \frac{d}{t}, \quad \sigma = \sqrt{\frac{1}{N}\sum_{i=1}^{N}(x_i - \mu)^2} Where is distance, is time, are lap times, is mean lap time, and is standard deviation.
How we built it
Frontend: React + Vite for a fast, modern web experience. CSV Parsing: PapaParse for robust, client-side CSV processing. Charts & Tables: Interactive data visualization using Recharts. Deployment: Continuous deployment via GitHub Actions to GitHub Pages.
Challenges we ran into
Handling large CSV files efficiently without slowing the browser. Making charts and tables responsive on all devices.
Accomplishments that we're proud of
Fully functional web app that processes CSV files and shows meaningful metrics. Auto-deploy setup via GitHub Actions — no manual steps needed. Clean, interactive charts and tables for performance analysis. Strong foundation for future extensions like AI lap predictions or multi-user collaboration.
What we learned
How to handle file uploads and CSV parsing in React. Building dynamic visualizations with real-time calculations. Continuous deployment and workflow automation with GitHub Actions. Practical experience with Git, rebases, merge conflict resolution, and version control best practices.
What's next for Racing Performance Analyzer
Will use ML and AI in the future

Log in or sign up for Devpost to join the conversation.