-
-
we envision a future of....
-
Computer Vision
-
Vision Insights
-

streamlit
-
AI Decision Reviewer for Race Engineer
-

Chatbot for Race Engineer
-
race engineer real-time insights
-
visualization
-
jupyter
-
tkinter
-

jupyter
-

jupyter
-
jupyter
-
jupyter
-
visualization
-
predict


Inspiration
In modern motorsport, races are often decided by fractions of a second and one pit call. A mistimed stop or a slow reaction to a Safety Car can cost multiple positions and tens of seconds of race time, even when the driver’s pace is strong.
At the same time, a single car can generate millions of telemetry data points per race (speed, throttle, brake, tyres, weather, timing, gaps, etc.). Race engineers have to digest all of this under pressure, in real time, while talking to the driver and coordinating with the team.
We wanted to build a tool that acts like an AI co-engineer: watching the data continuously, surfacing only what matters (“box now”, “tyre cliff in 3 laps”, “caution window coming”), and turning RAW NUMBERS 🔜 DECISIONS.
What it does
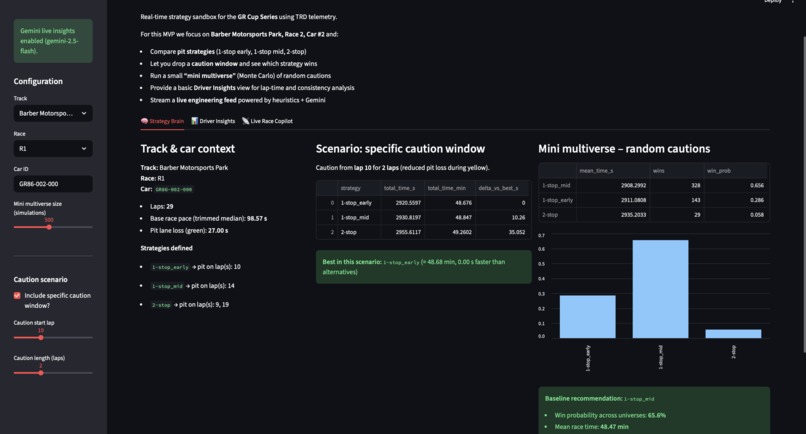
Our project turns real GR86 GR Cup data into an interactive race-strategy cockpit for Barber Motorsports Park:
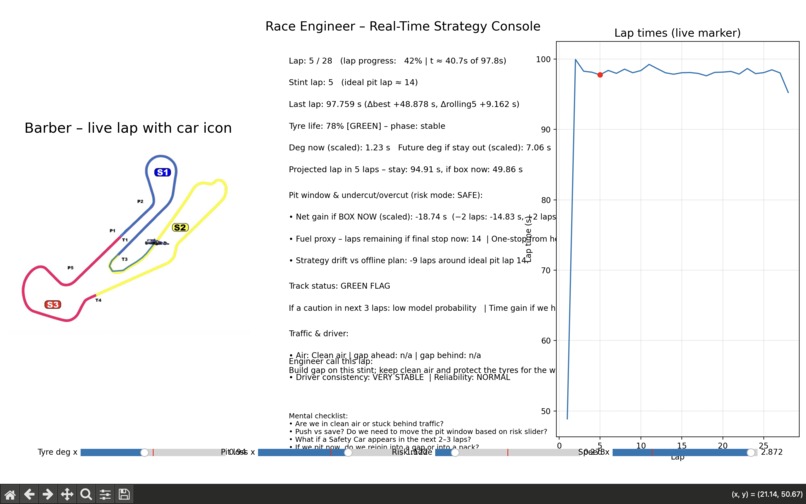
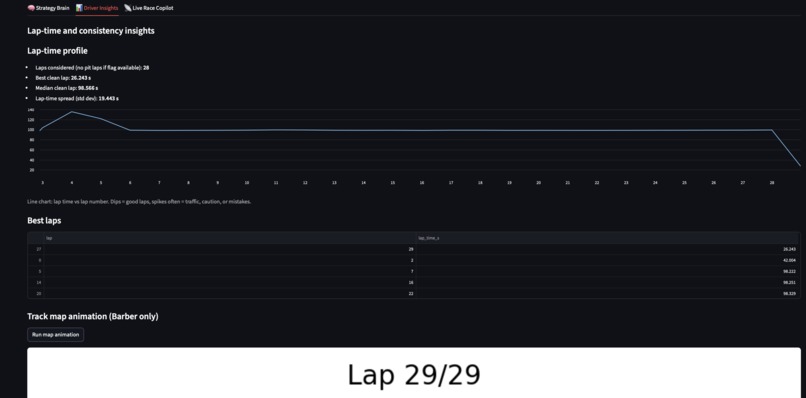
- 🏁 Live track sim – a car icon runs around a digitised Barber circuit map based on lap timing and stint logic.
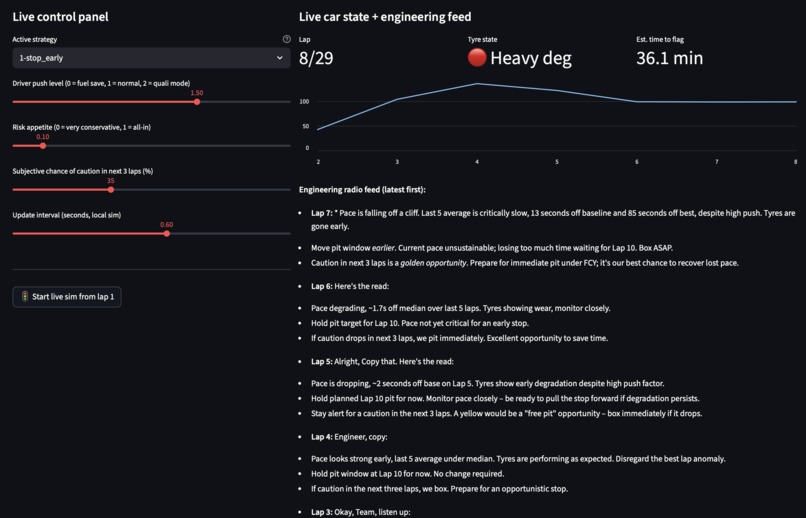
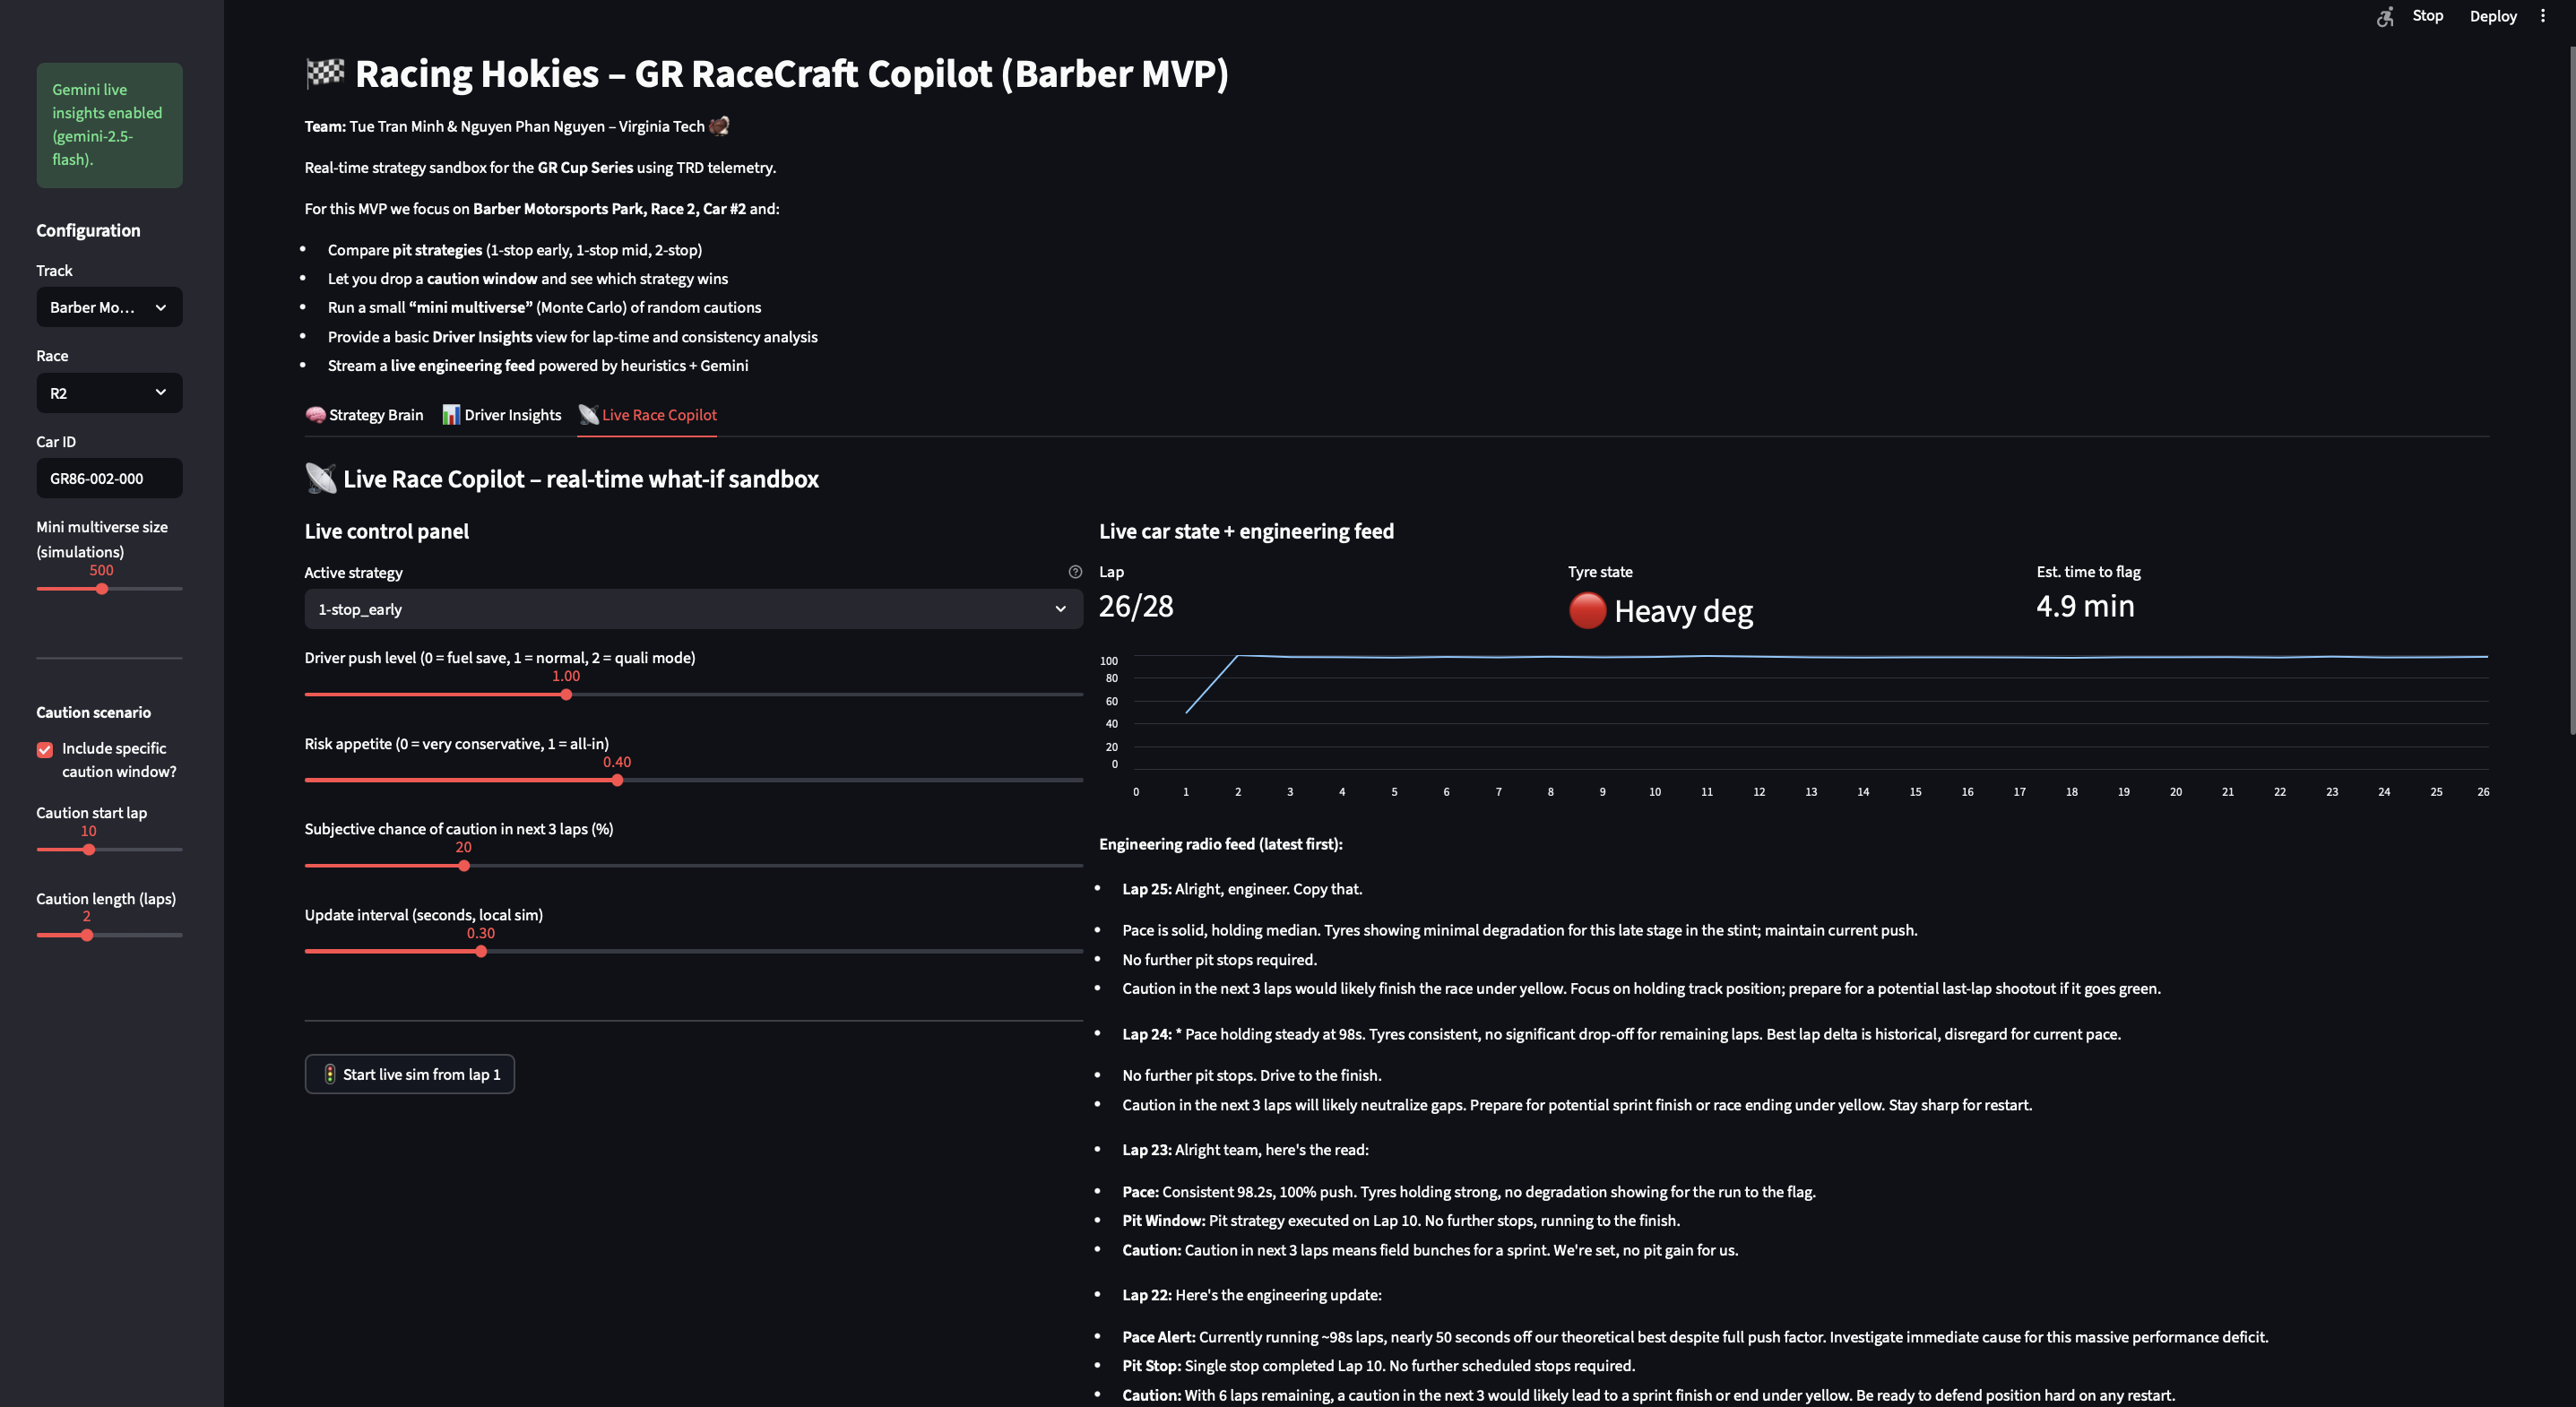
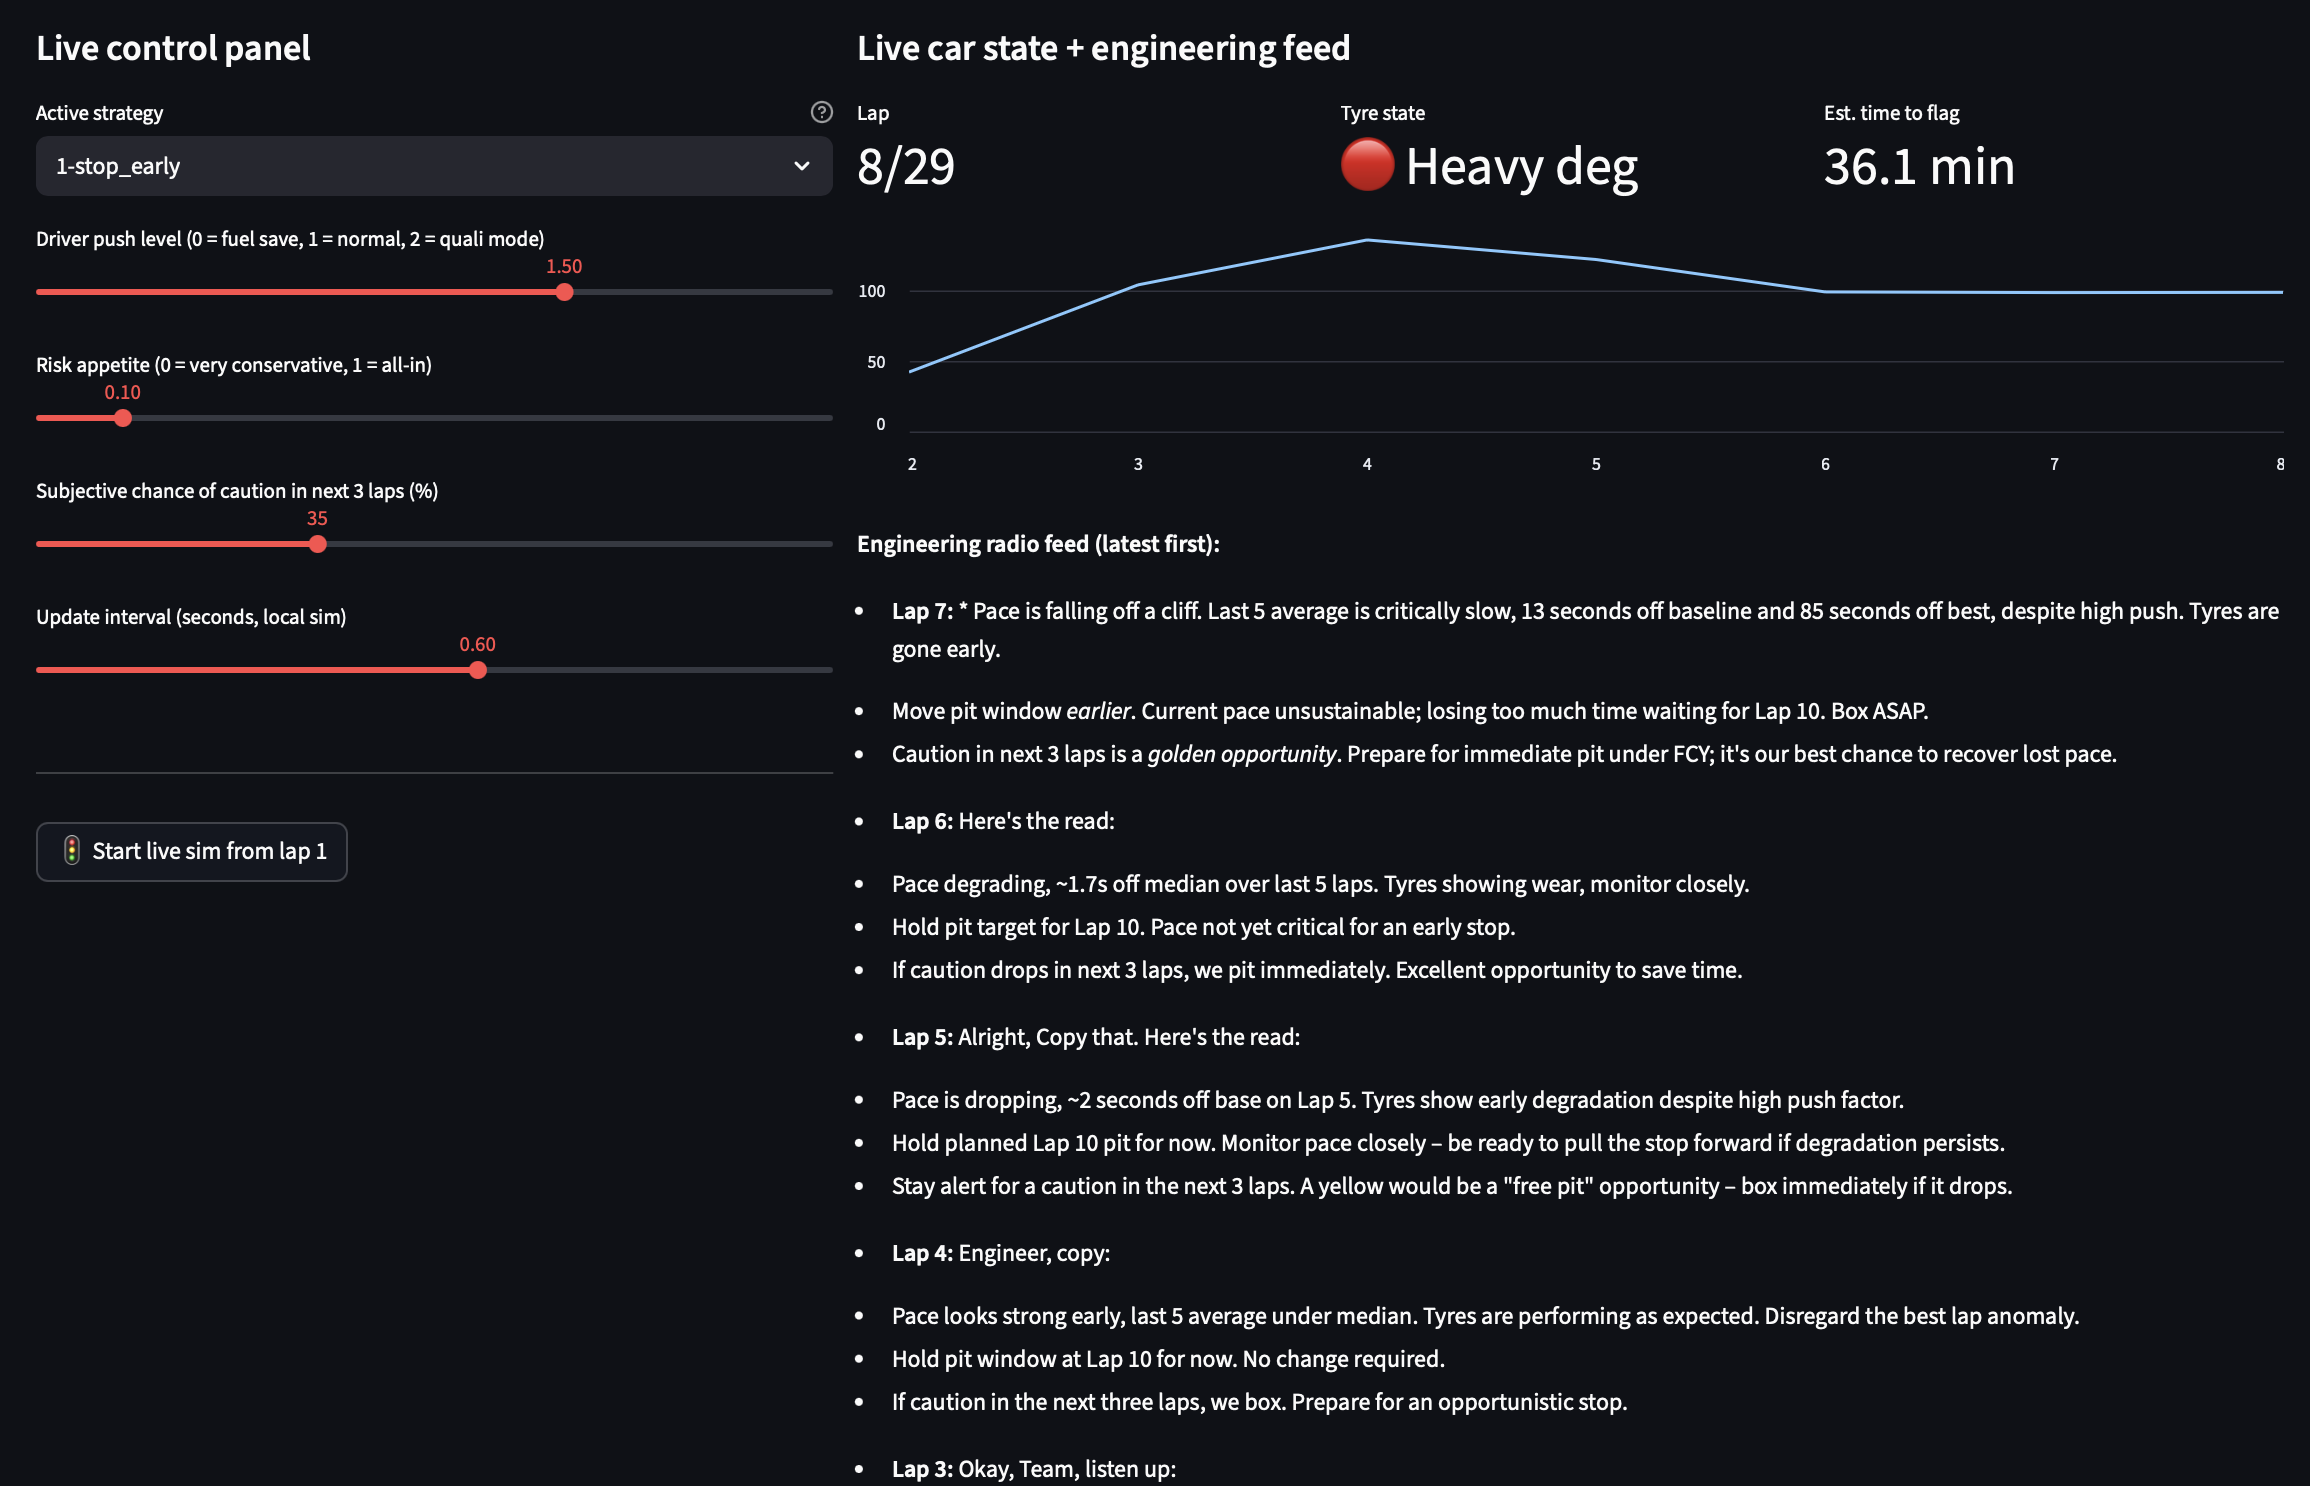
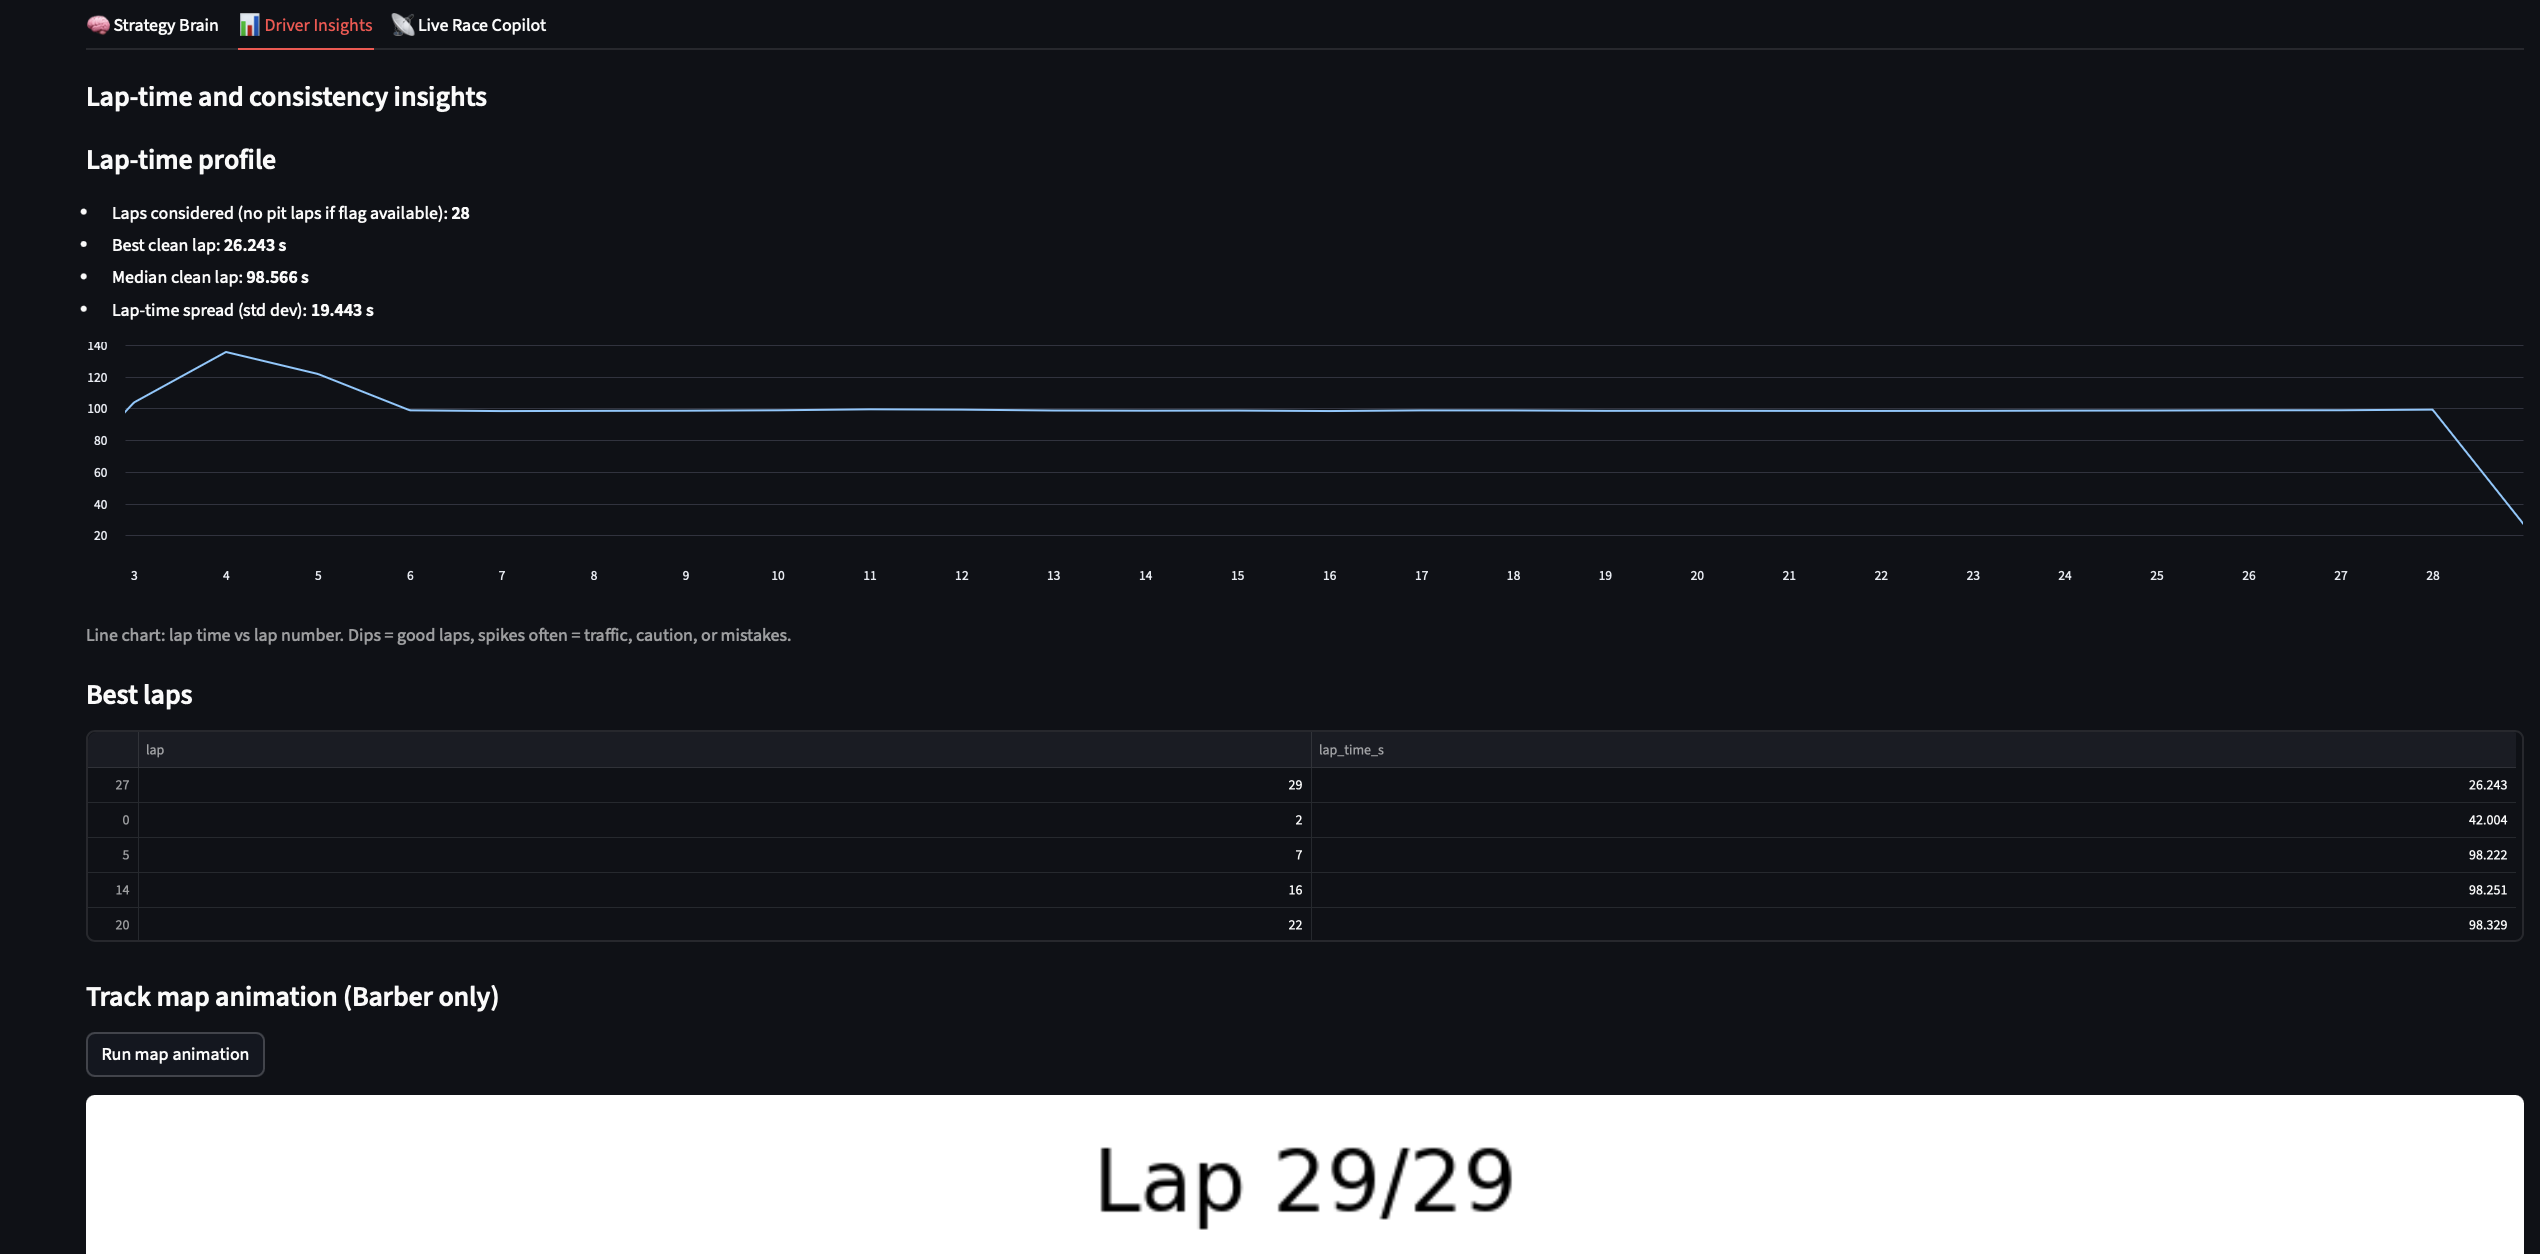
- 📊 Real-time strategy console – every second, the app updates:
- Tyre phase (warm-up / stable / degradation)
- Net gain/loss if we pit now vs 2 laps earlier/later
- Caution / Safety-Car “what if” (next 3 laps)
- Clean air vs traffic risk, gaps ahead/behind
- Tyre phase (warm-up / stable / degradation)
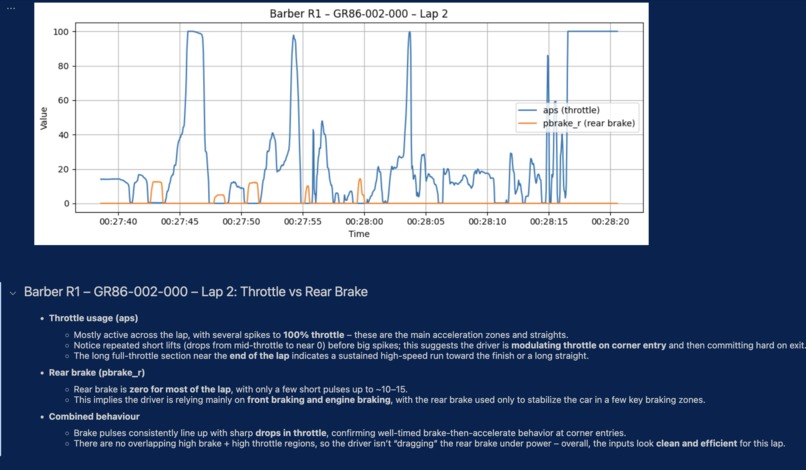
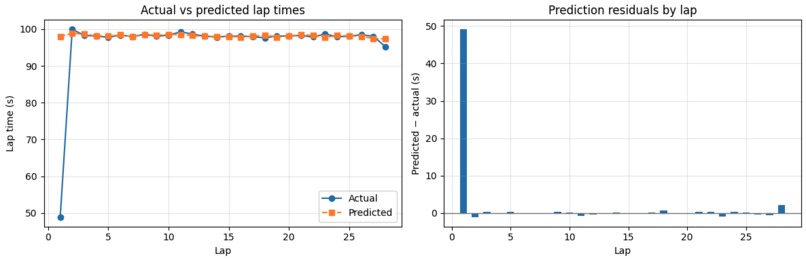
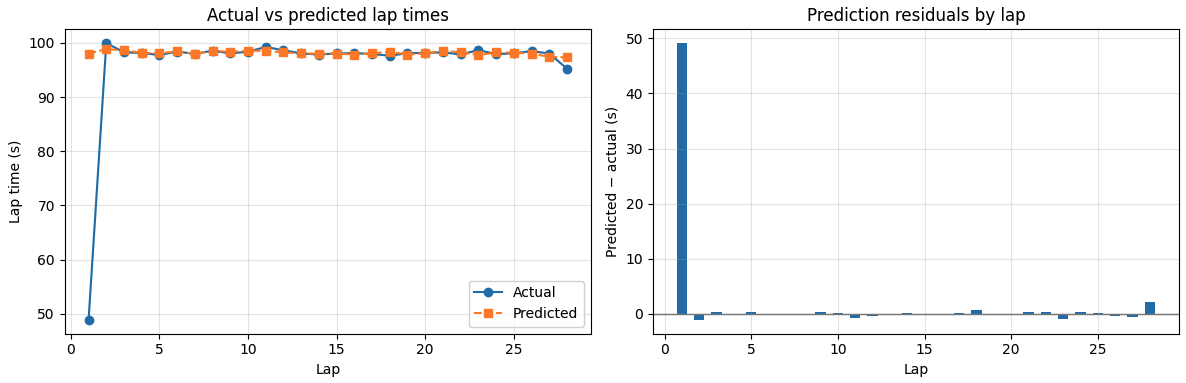
- 📈 Predictive Models tab – a Random Forest lap-time model (trained on throttle & brake features) forecasts pace and overlays actual vs predicted laps, plus residual plots.
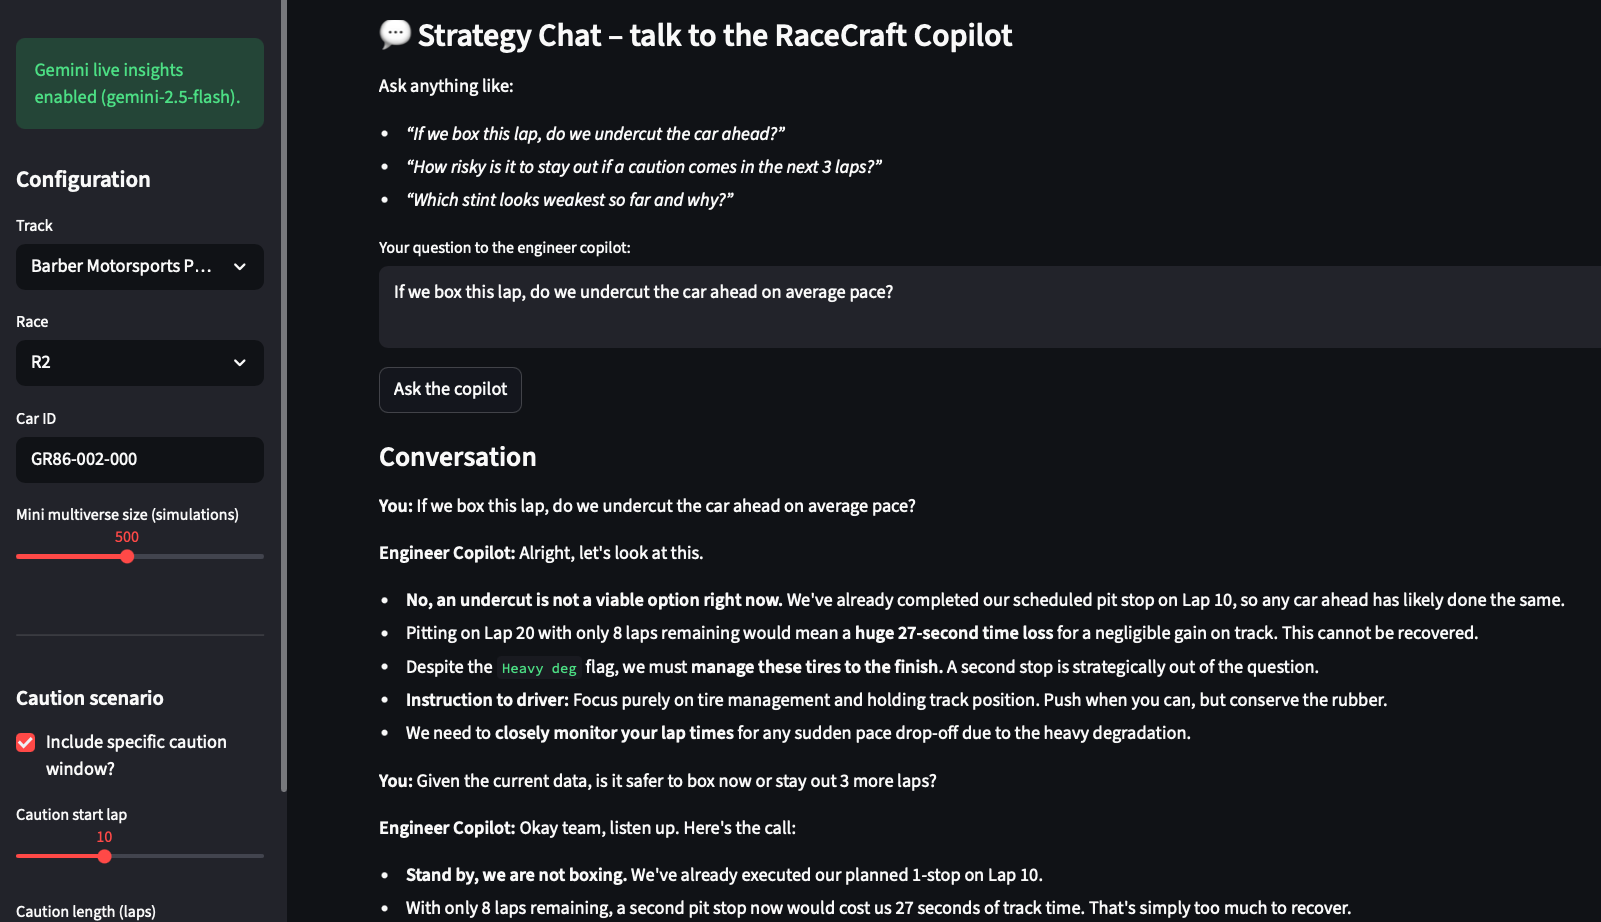
- 💬 Strategy Chat – a Gemini 2.5 Flash–powered chat assistant that understands the current race state and answers natural-language questions (“If we stay out 5 laps, what’s the risk?”, “Which stint looks weakest?”).
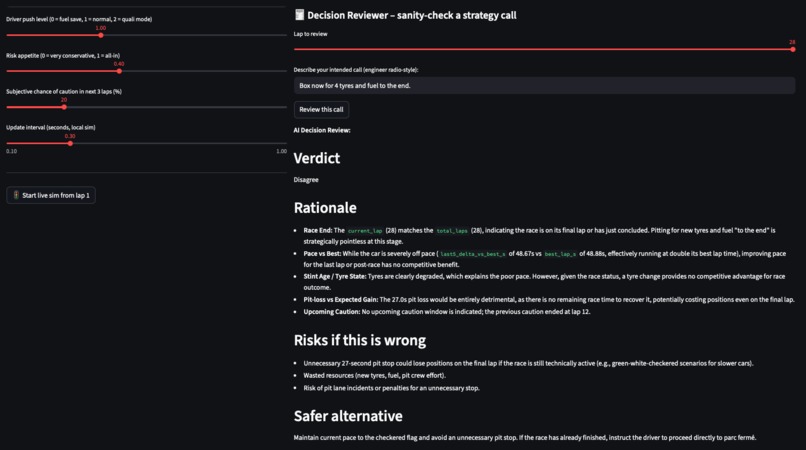
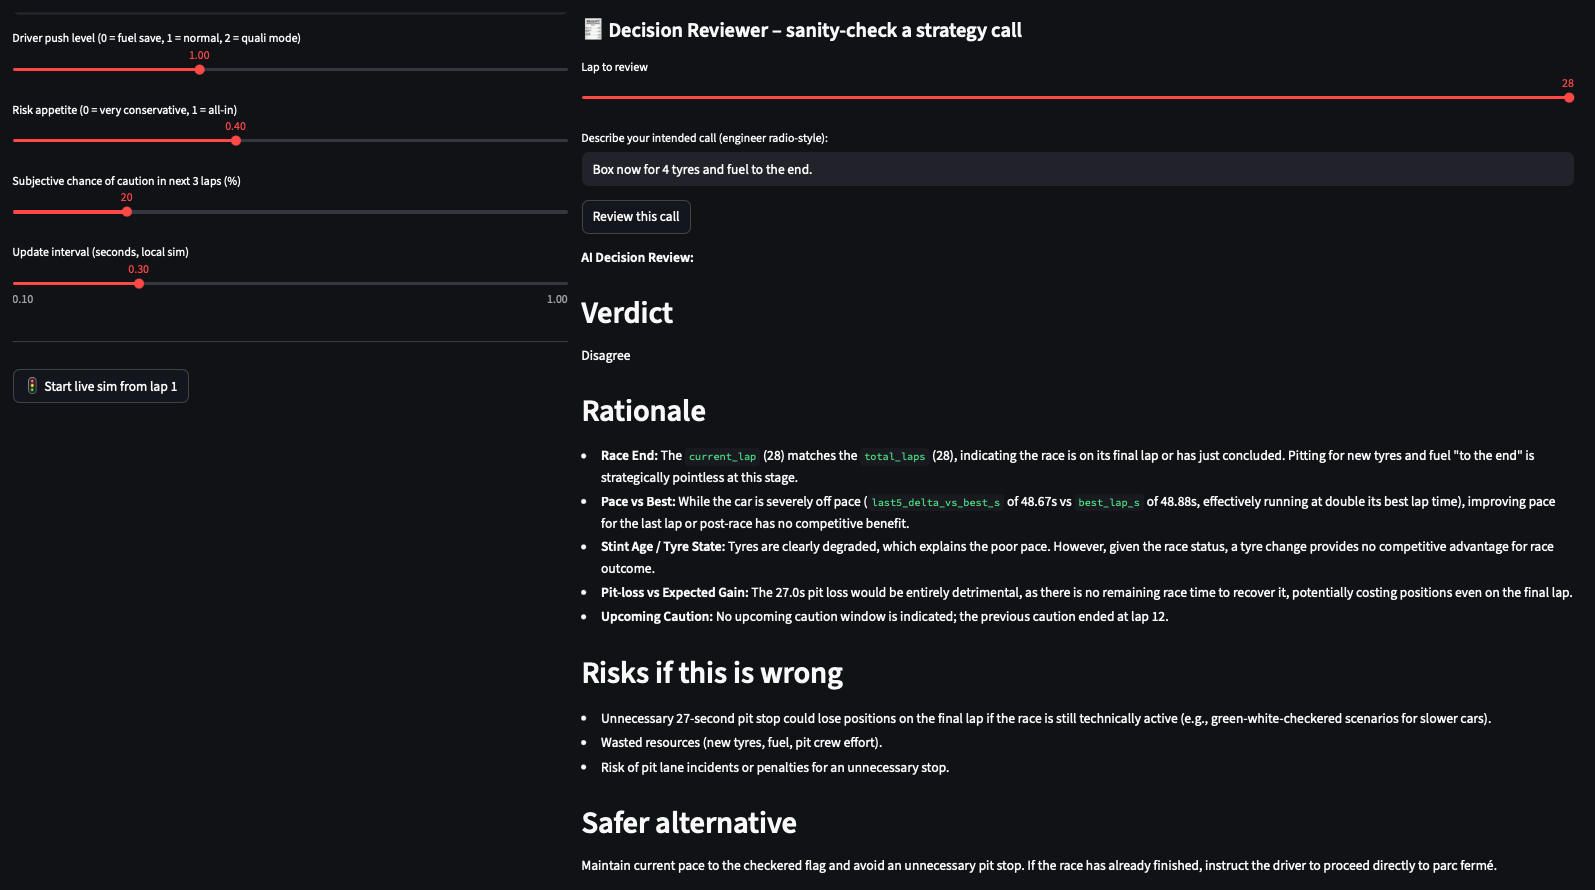
- 🧾 AI Decision Reviewer – after the engineer types a proposed call (“Box now for 4 tyres and fuel to the end”), Gemini 2.5 reviews it, returns Agree / Disagree + key risks and alternatives, grounded in the current stint metrics.
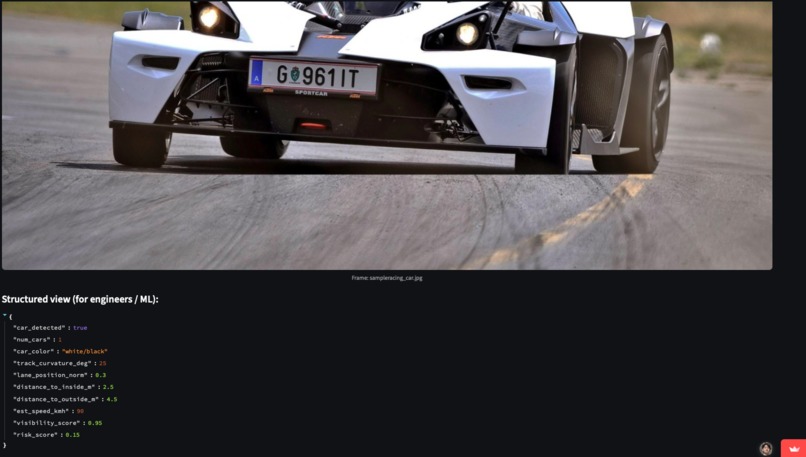
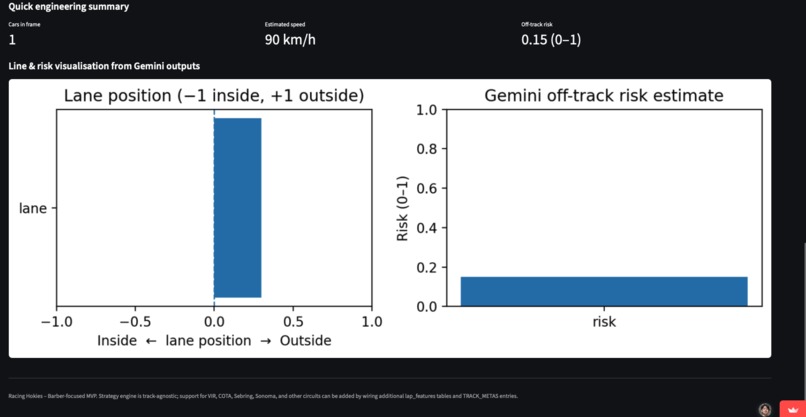
- 👁️ Computer Vision view – Gemini 2.5 Vision analyzes a race frame (sample GR86 at Barber or an uploaded image), detects the car and track context, estimates lane position & risk, and turns that into numbers + a quick plot useful for future perception systems.
- 🎛️ Decision sliders – the engineer can adjust:
- Tyre degradation sensitivity
- Pit-lane loss factor
- Risk mode (Safe / Neutral / Attack)
and see the recommendations update in real time.
- Tyre degradation sensitivity
How we built it
Data
We used the official TRD hackathon dataset from:
https://trddev.com/hackathon-2025/
Key Barber files (race 1 & 2):
R1_barber_telemetry_data.csv– 11,556,519 rows × 13 columnsR2_barber_telemetry_data.csv– 11,749,604 rows × 13 columns- Plus timing, weather, sector stats and results files — about 20 CSV files in total.
We pre-processed these into lap-level features and strategy summaries (see /data/processed and the analysis notebooks 03–10_barber_*.ipynb).
Core stack
- Python, NumPy, pandas – data processing, lap & stint features, tyre-deg models
- scikit-learn (RandomForestRegressor) – lap-time prediction model, RMSE / R² evaluation, and actual–vs–predicted plots
- Matplotlib – live animation of the car icon moving around the digitised Barber map, plus residual and risk visualisations
- Streamlit – race-engineer dashboard with live plots, sliders, tabs (Strategy Brain, Driver Insights, Predictive Models, Vision, Strategy Chat, Live Copilot) and a “radio feed” panel
- Google Gemini 2.5 Flash –
- Strategy Chat (text Q&A)
- Live radio-style insights in the copilot tab
- AI Decision Reviewer for strategy calls
- Vision analysis of race frames (
data/vision/sample_gr86_barber.png+ uploads)
- Strategy Chat (text Q&A)
- Tkinter / Matplotlib backends – optional local animation window that writes a
live_stateJSON - Custom modules –
strategy_engine.py/pit_model.py– degradation modelling, pit window simulation, Monte Carlo “mini multiverse”track_meta.py– track metadata & pit-lane timingpredictive_models.py– train / save / load the lap-time Random Forest and generate prediction tableschat_assistant.py– builds structured context and routes chat questions to Geminidecision_reviewer.py– wraps Gemini with a fixed “Agree / Disagree + risks” review schemavision_gemini.py– calls Gemini Vision on race frames and returns structured stats for plottinglive_statehelpers – JSON syncing between animation and dashboard.
The desktop animation (barber_lap_anim.py) can continuously update a JSON file (data/live/live_state_barber.json). The Streamlit app (streamlit_app.py) reads that same state, recomputes metrics, calls Gemini for fresh insights, and integrates predictions, chat, decision review, and vision on dedicated tabs.
Challenges we ran into
- Handling huge telemetry files – reading >11 million-row CSVs per race meant we had to be careful with memory, summarising to lap/stint-level data before doing heavier modeling.
- Keeping everything in sync – we needed the Matplotlib animation, JSON writer, and Streamlit dashboard to stay in lockstep without race conditions or crashes.
- Model quality vs data volume – with only one race per car/track, the Random Forest lap-time model has limited data, so we had to choose simple features and focus on interpretability over perfection.
- Prompt design for Gemini (chat, reviewer, vision) – making sure the AI produces short, trustworthy, race-engineer-style bullet points (and not essays) and that the vision outputs are structured (lane position, risk scores) took several prompt iterations.
Accomplishments that we're proud of
- Turning raw GR Cup telemetry into a live strategy simulator that feels like a race-engineer console, not just static plots.
- Building an AI radio feed + chat assistant that reacts to tyre life, pit window, and caution scenarios in language a driver and engineer could actually understand mid-race.
- Training and wiring a lap-time predictive model so engineers can visually compare actual vs predicted pace and spot anomalies or degradation.
- Implementing an AI Decision Reviewer that gives a second opinion on strategy calls with explicit reasoning and risk flags.
- Prototyping a computer vision pipeline where Gemini Vision reads a race frame, extracts structured numbers (lane position, estimated speed, risk) and feeds a small engineering plot – a first step towards closing the loop between telemetry and visual perception.
- Creating a modular pipeline: notebooks → processed features → strategy engine → predictive models → live animation → Streamlit + Gemini.
What we learned
- How quickly motorsport data explodes in size, and why aggregation & feature engineering are critical before doing any fancy modeling.
- The importance of race-decision framing: engineers don’t want “here’s every metric,” they want “what should we do this lap and why?”.
- How to combine classical modelling (tyre deg, pit-lane loss, Monte Carlo strategies, Random Forest regression) with LLM-synthesised insights so the AI is grounded in real numbers.
- That multi-modal AI (telemetry + natural language + vision) opens up new possibilities: e.g., using a single Gemini 2.5 model to read both the race chart and the on-board camera frame and still produce consistent strategy advice.
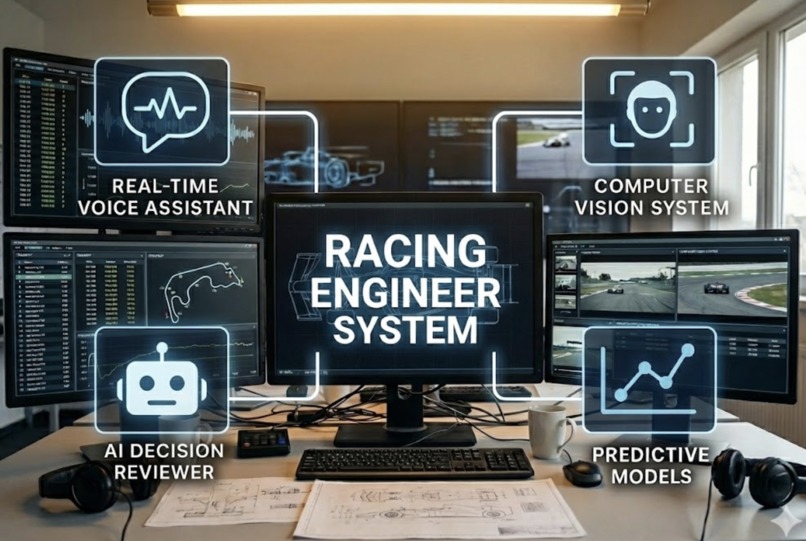
What's next for Racing Hokies
- ❯❯❯❯ The Future – harden and connect all four pillars:
- real-time voice assistant for strategy radio,
- AI decision reviewer integrated with live timing,
- richer computer vision system for multi-car, multi-camera perception,
- and improved predictive models for stint & tyre life forecasting.
- real-time voice assistant for strategy radio,
- 💠 Multi-car & multi-track support – extend to more GR Cup cars and to VIR / COTA using the rest of the TRD dataset.
- 🌐 Cloud + live feed – adapt the pipeline to live telemetry streams and host the dashboard so a team can connect during a session.
- 🧠 Richer “what-if” engine – allow the engineer to simulate alternative strategies (extra stop, short-fill, extreme fuel save) and compare projected race time in real time.
- 👂 Driver-aware coaching – incorporate driver consistency, error patterns, sector strengths, and even vision-derived risk into the radio calls (“strong in S1, losing time in S3 braking zone – adjust bias + lift earlier”).
By combining real-world-scale data, physics-style models, and LLM + vision insights, our goal is to give race engineers a tool that doesn’t just visualise the race — it helps call it.
Built With
- gemini
- joblib
- jupyternotebook
- llm
- matplotlib
- numpy
- pandas
- scikit-learn
- streamlit
- tkinter


Log in or sign up for Devpost to join the conversation.