-
-
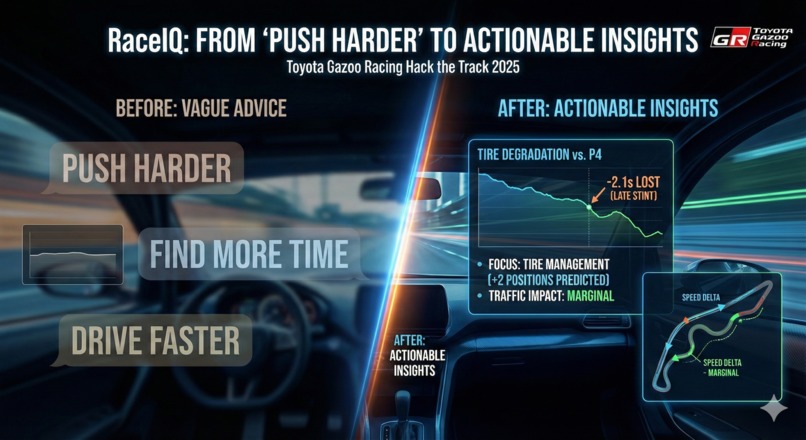
RaceIQ: From "Push Harder" to Actionable Insights
-
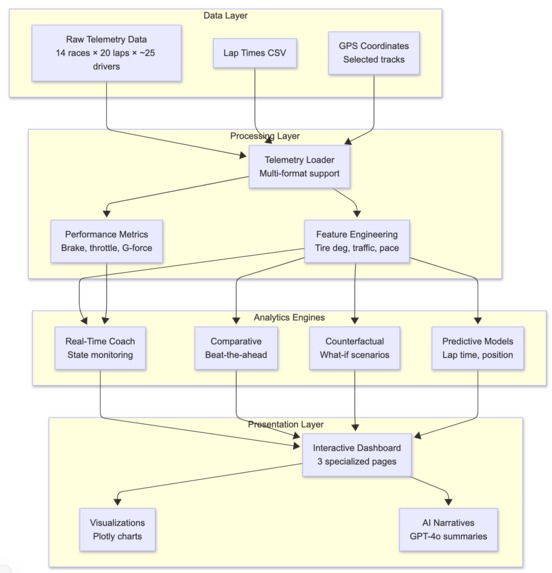
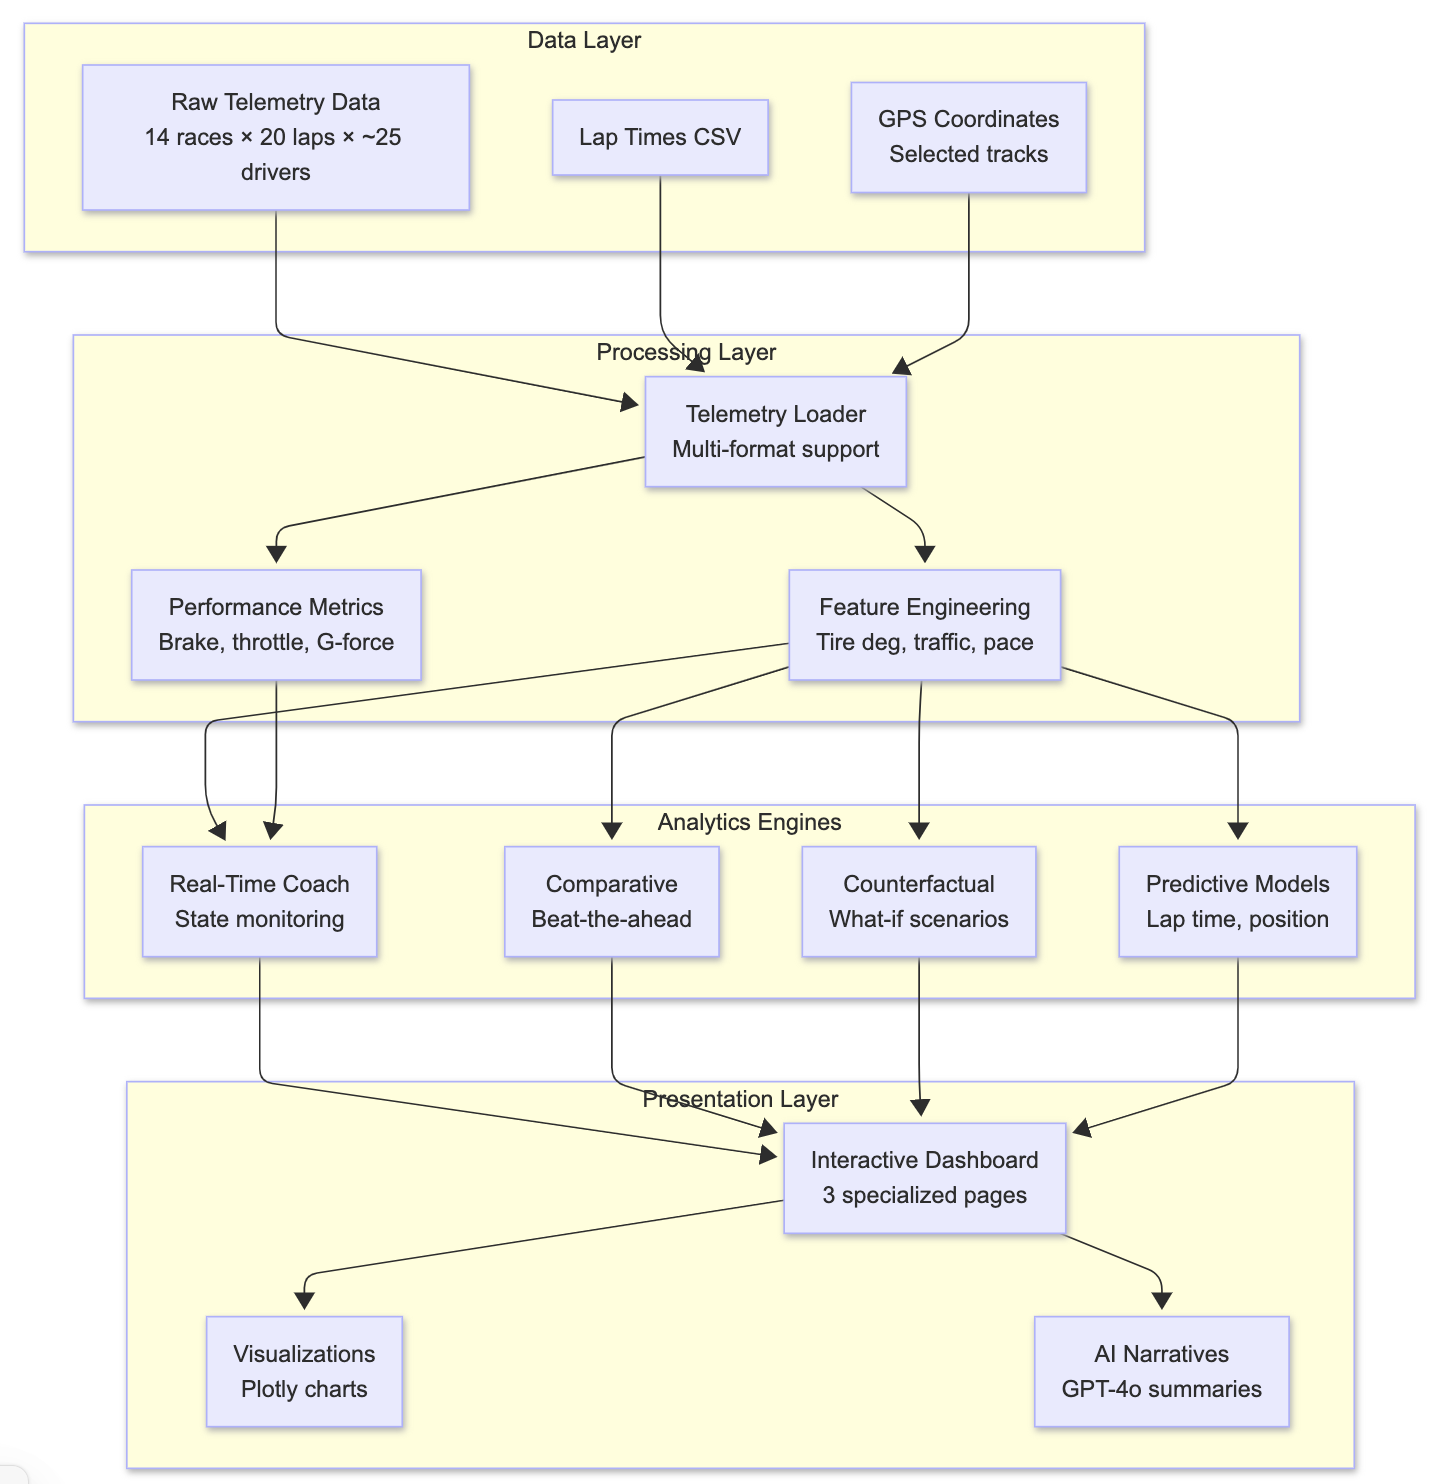
Architecture overview of the entire system
-
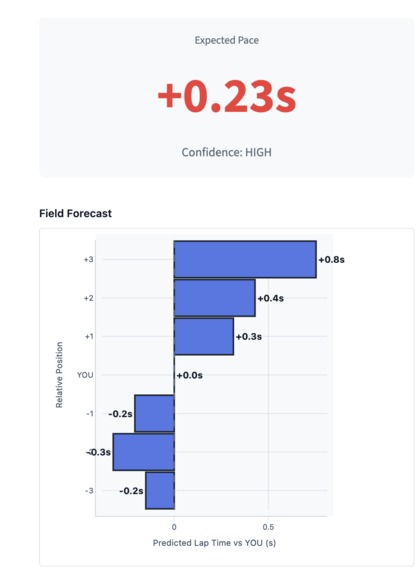
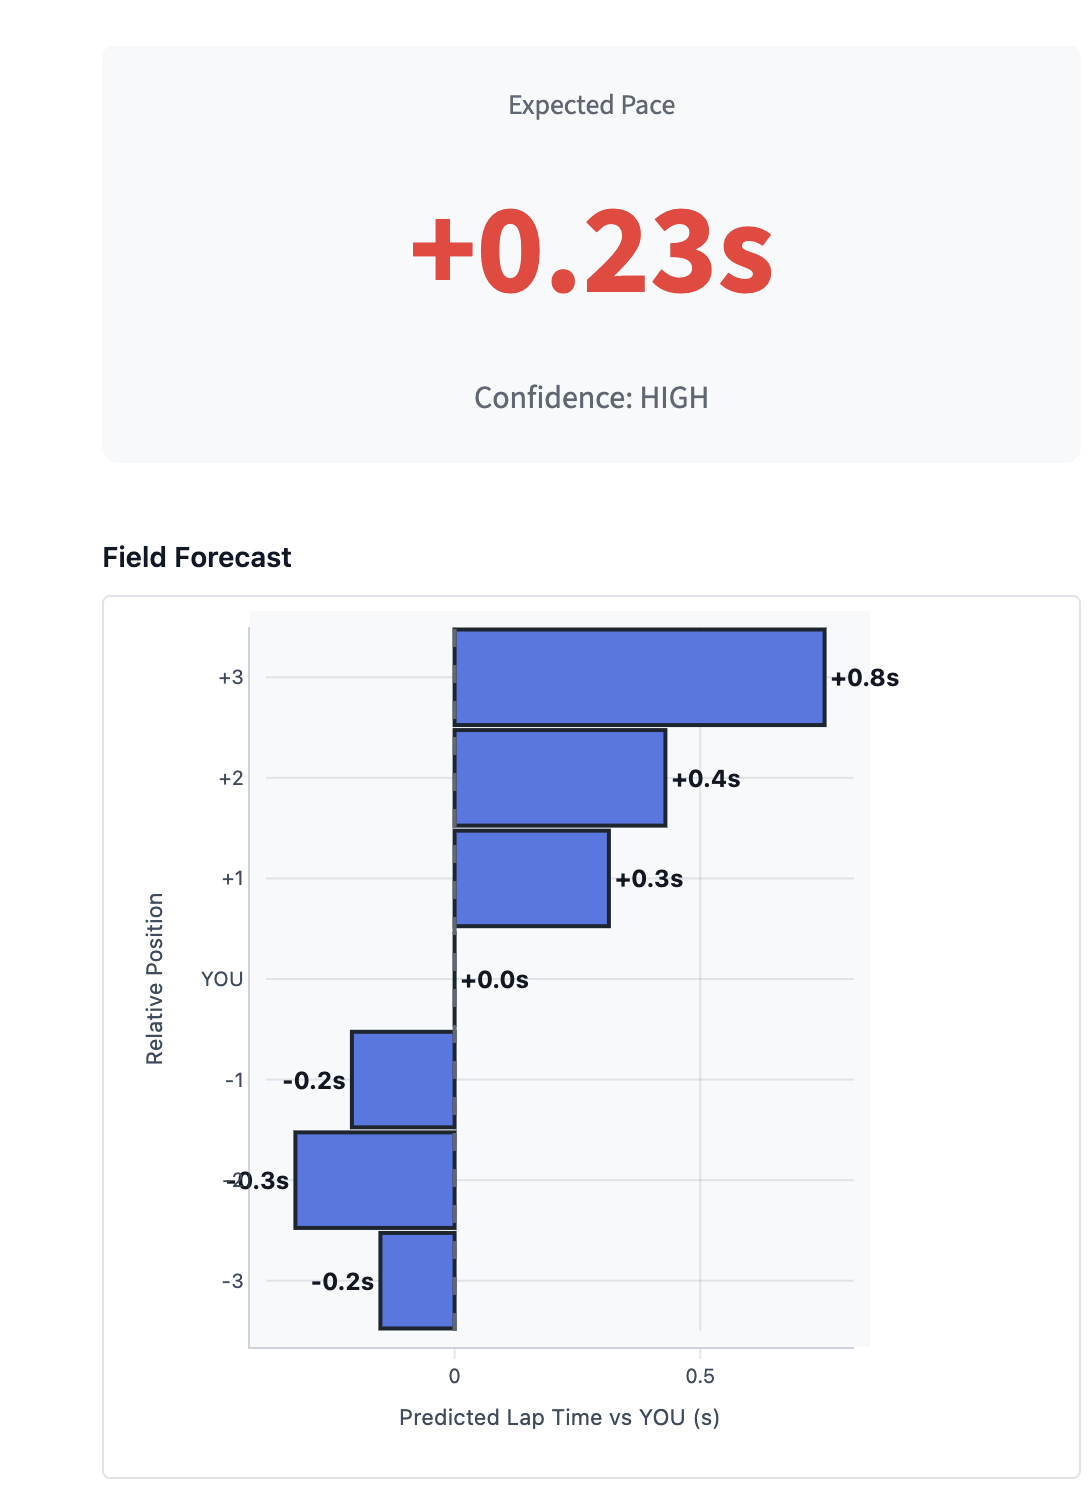
Field forecast shows next lap times for drivers ahead (-ve relative position) and behind (+ve); +ve time => expected to be slower than you
-
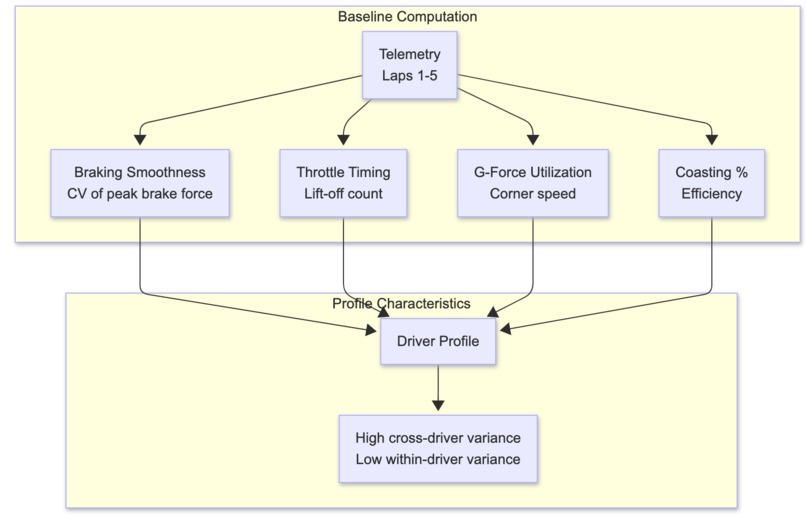
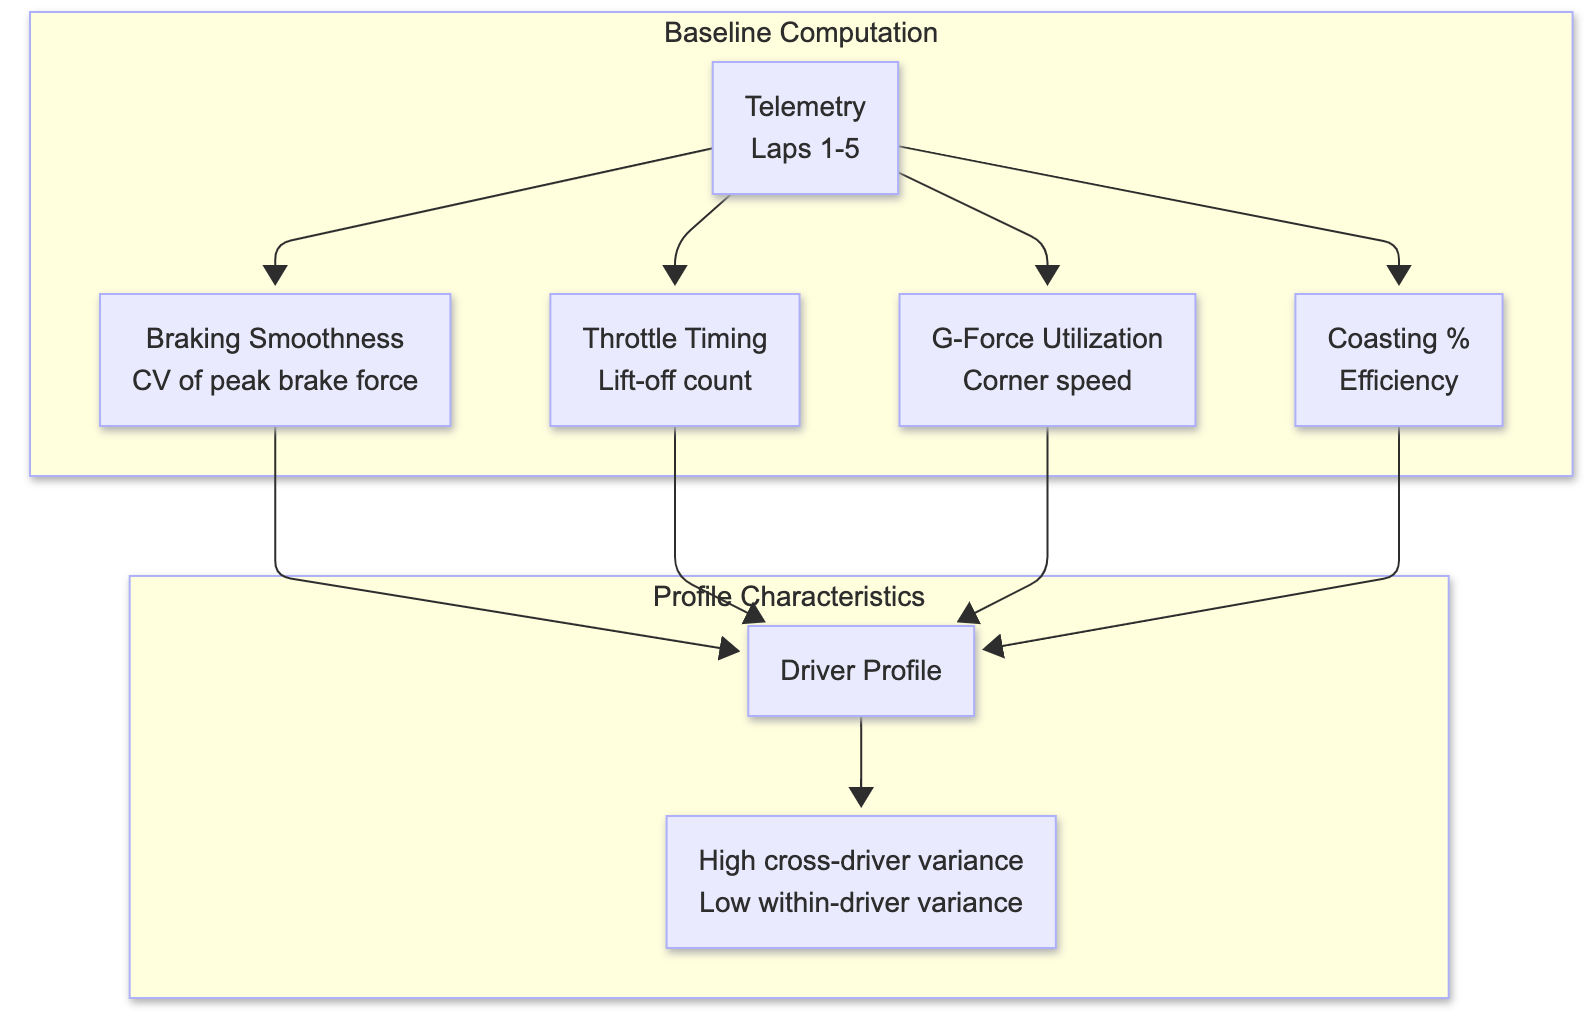
Creation of driver profile from early laps (1-5) for real-time analytics for subsequent laps
-
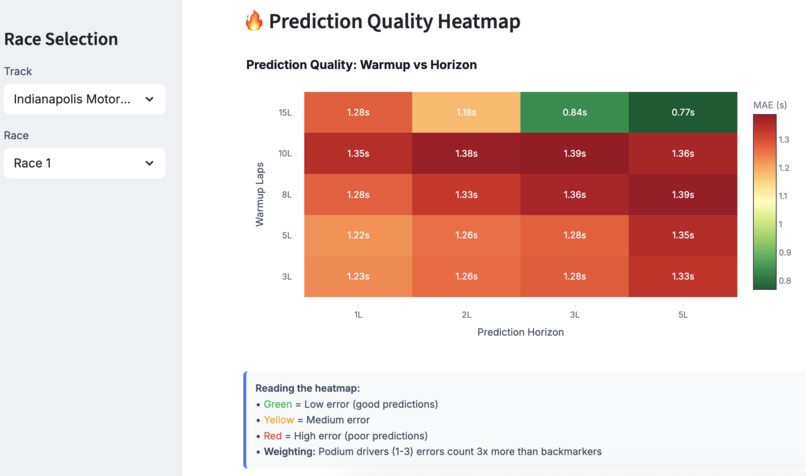
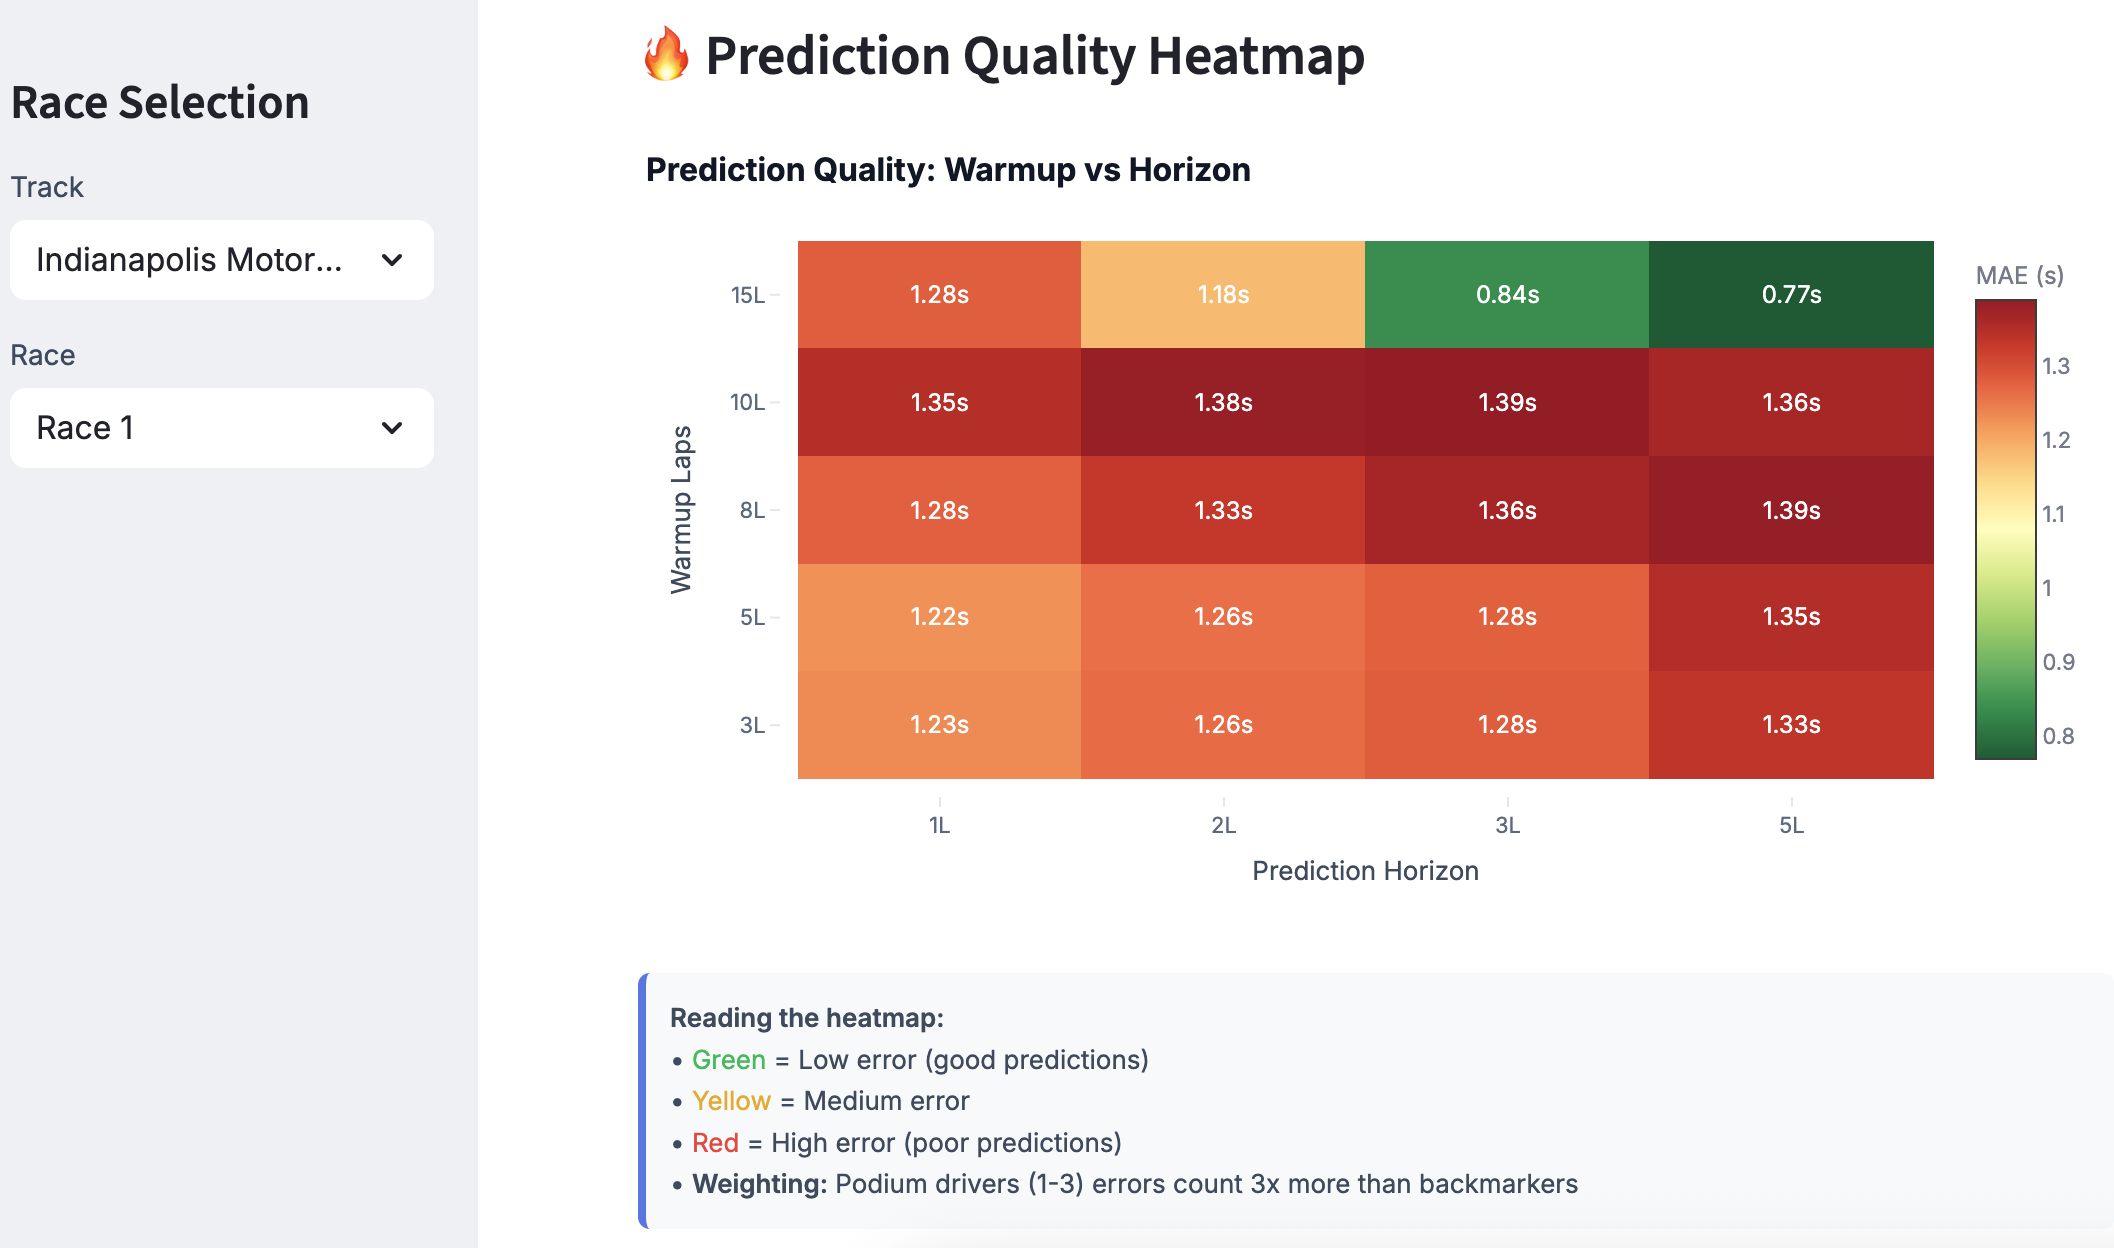
Heatmap of mean absolute error in lap-time prediction as a function of #warmup laps and prediction horizon (weighted toward podium finishes)
-
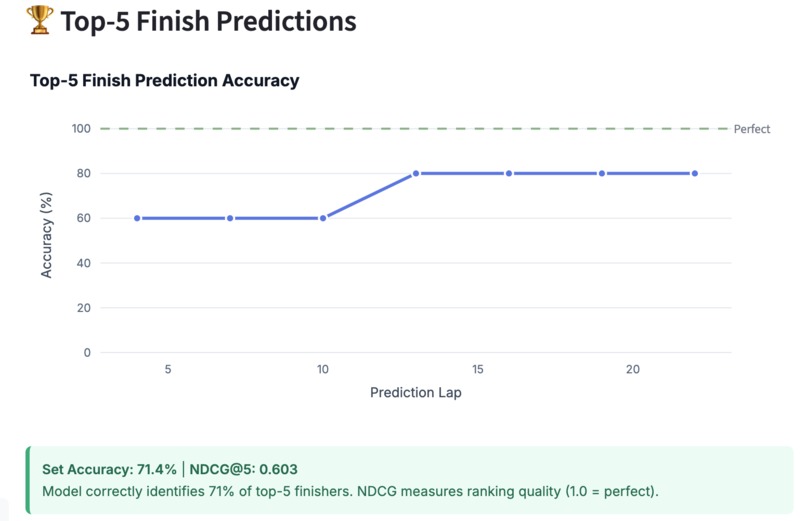
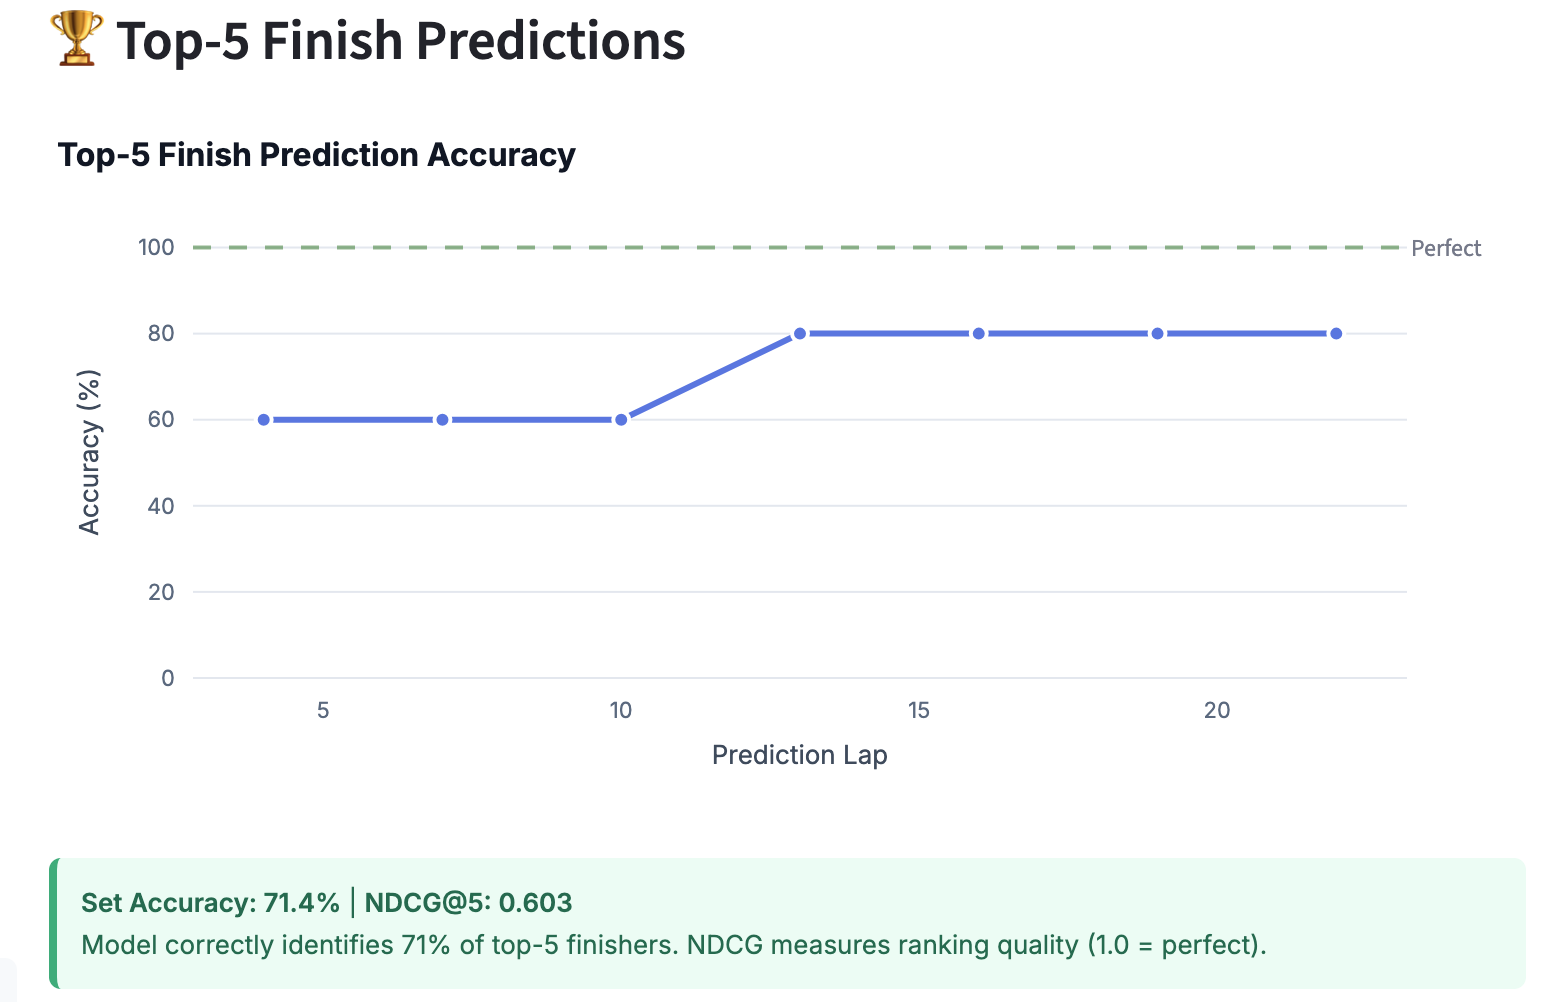
Top-5 predictions vs. lap#: set accuracy (correct set of podium finishers) and NDCG (metric that penalizes incorrect ranking within top-5)
-
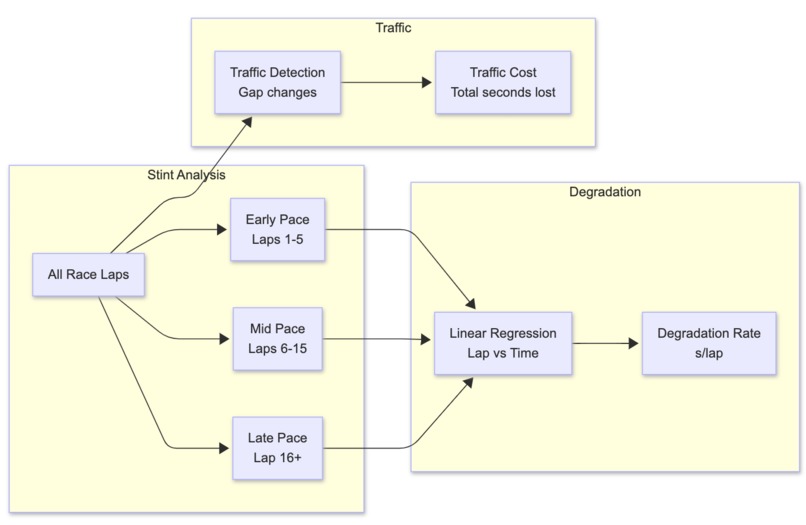
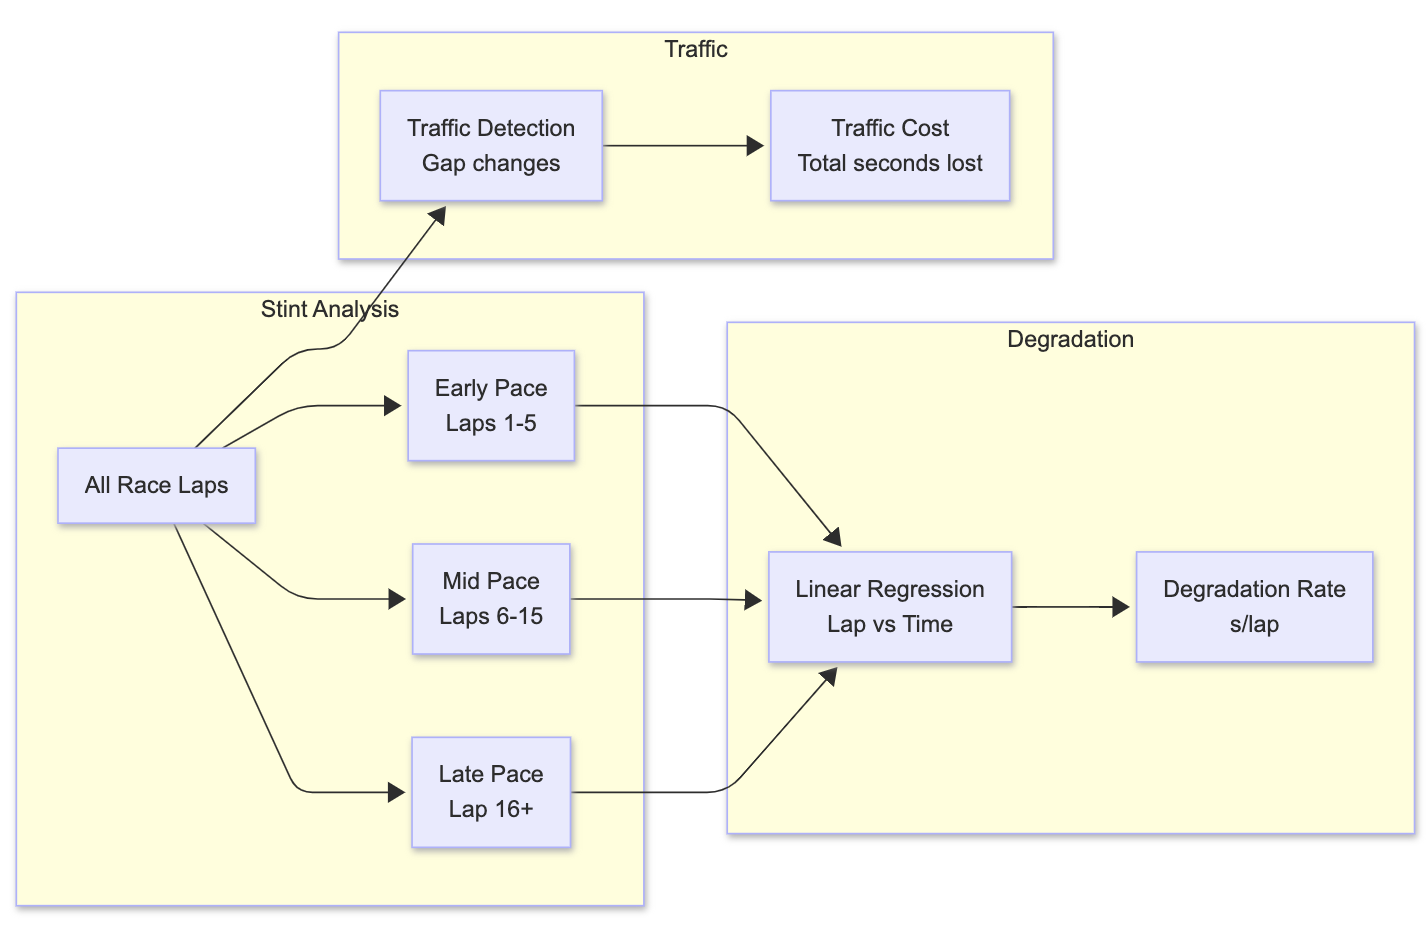
Predictive modeling of next-lap-time and lap-time degradation
-
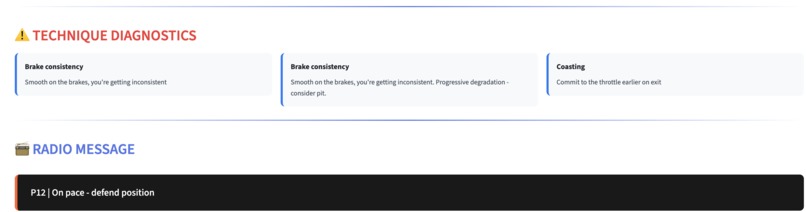
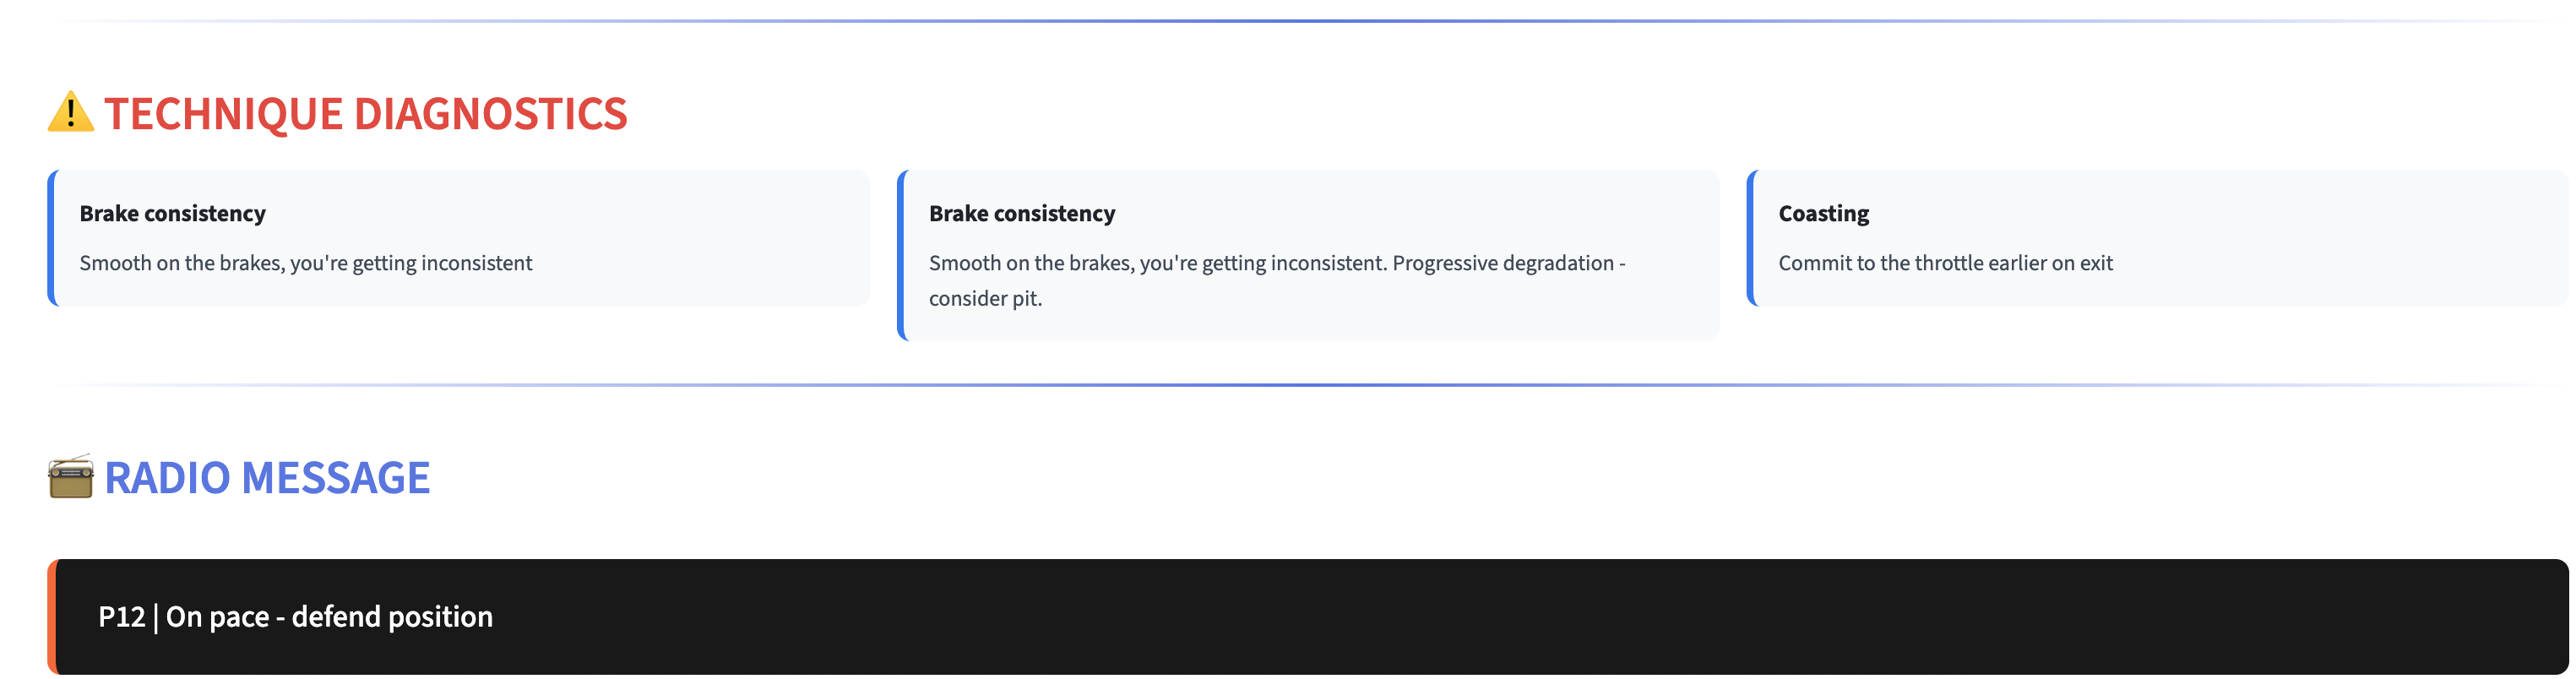
Real-time monitoring of driving techniques and coaching the driver
-
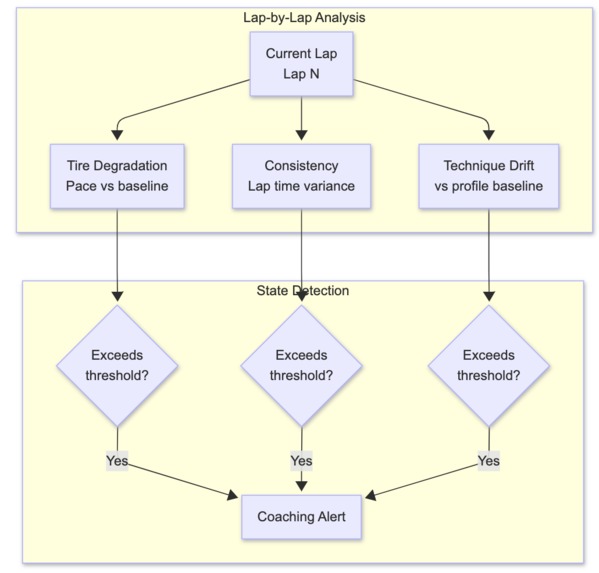
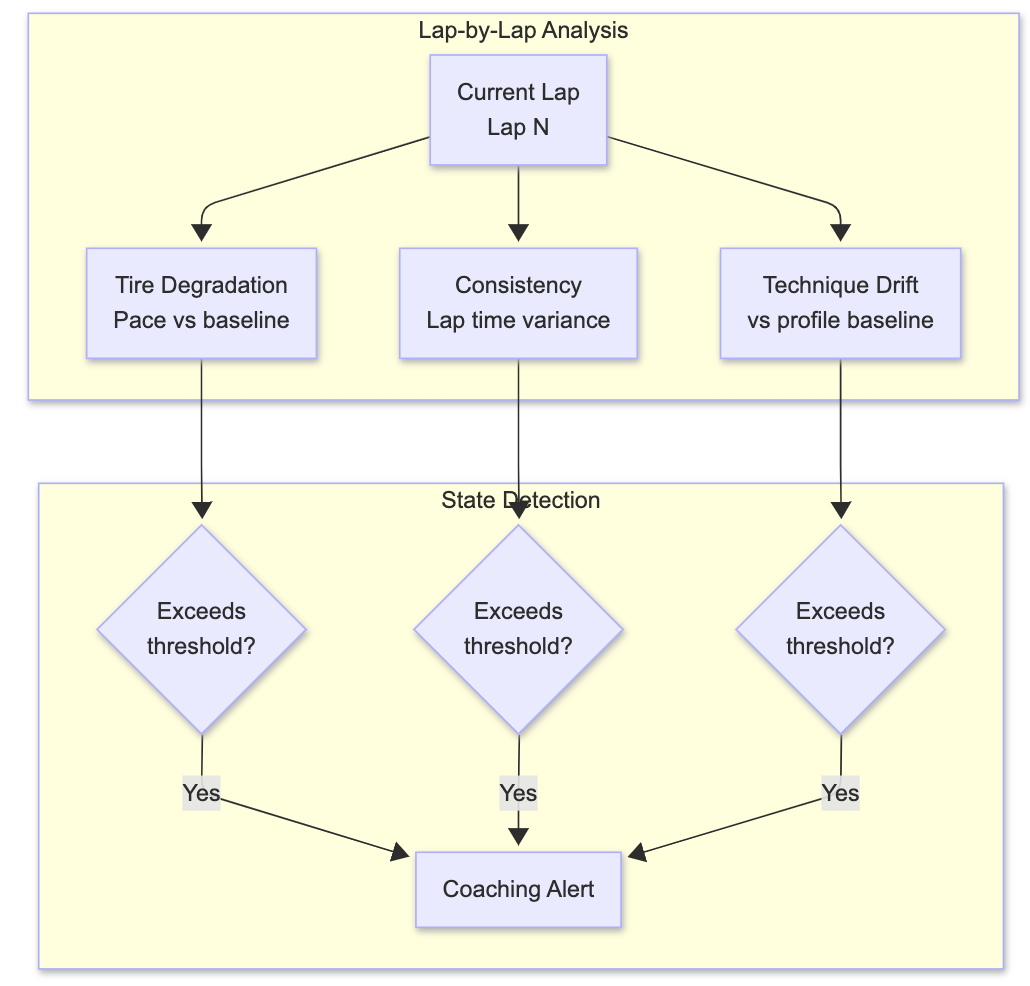
State detection during the race to generate coaching alerts
-
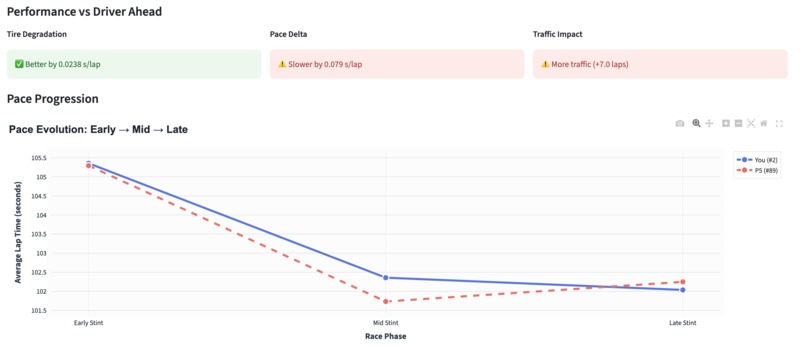
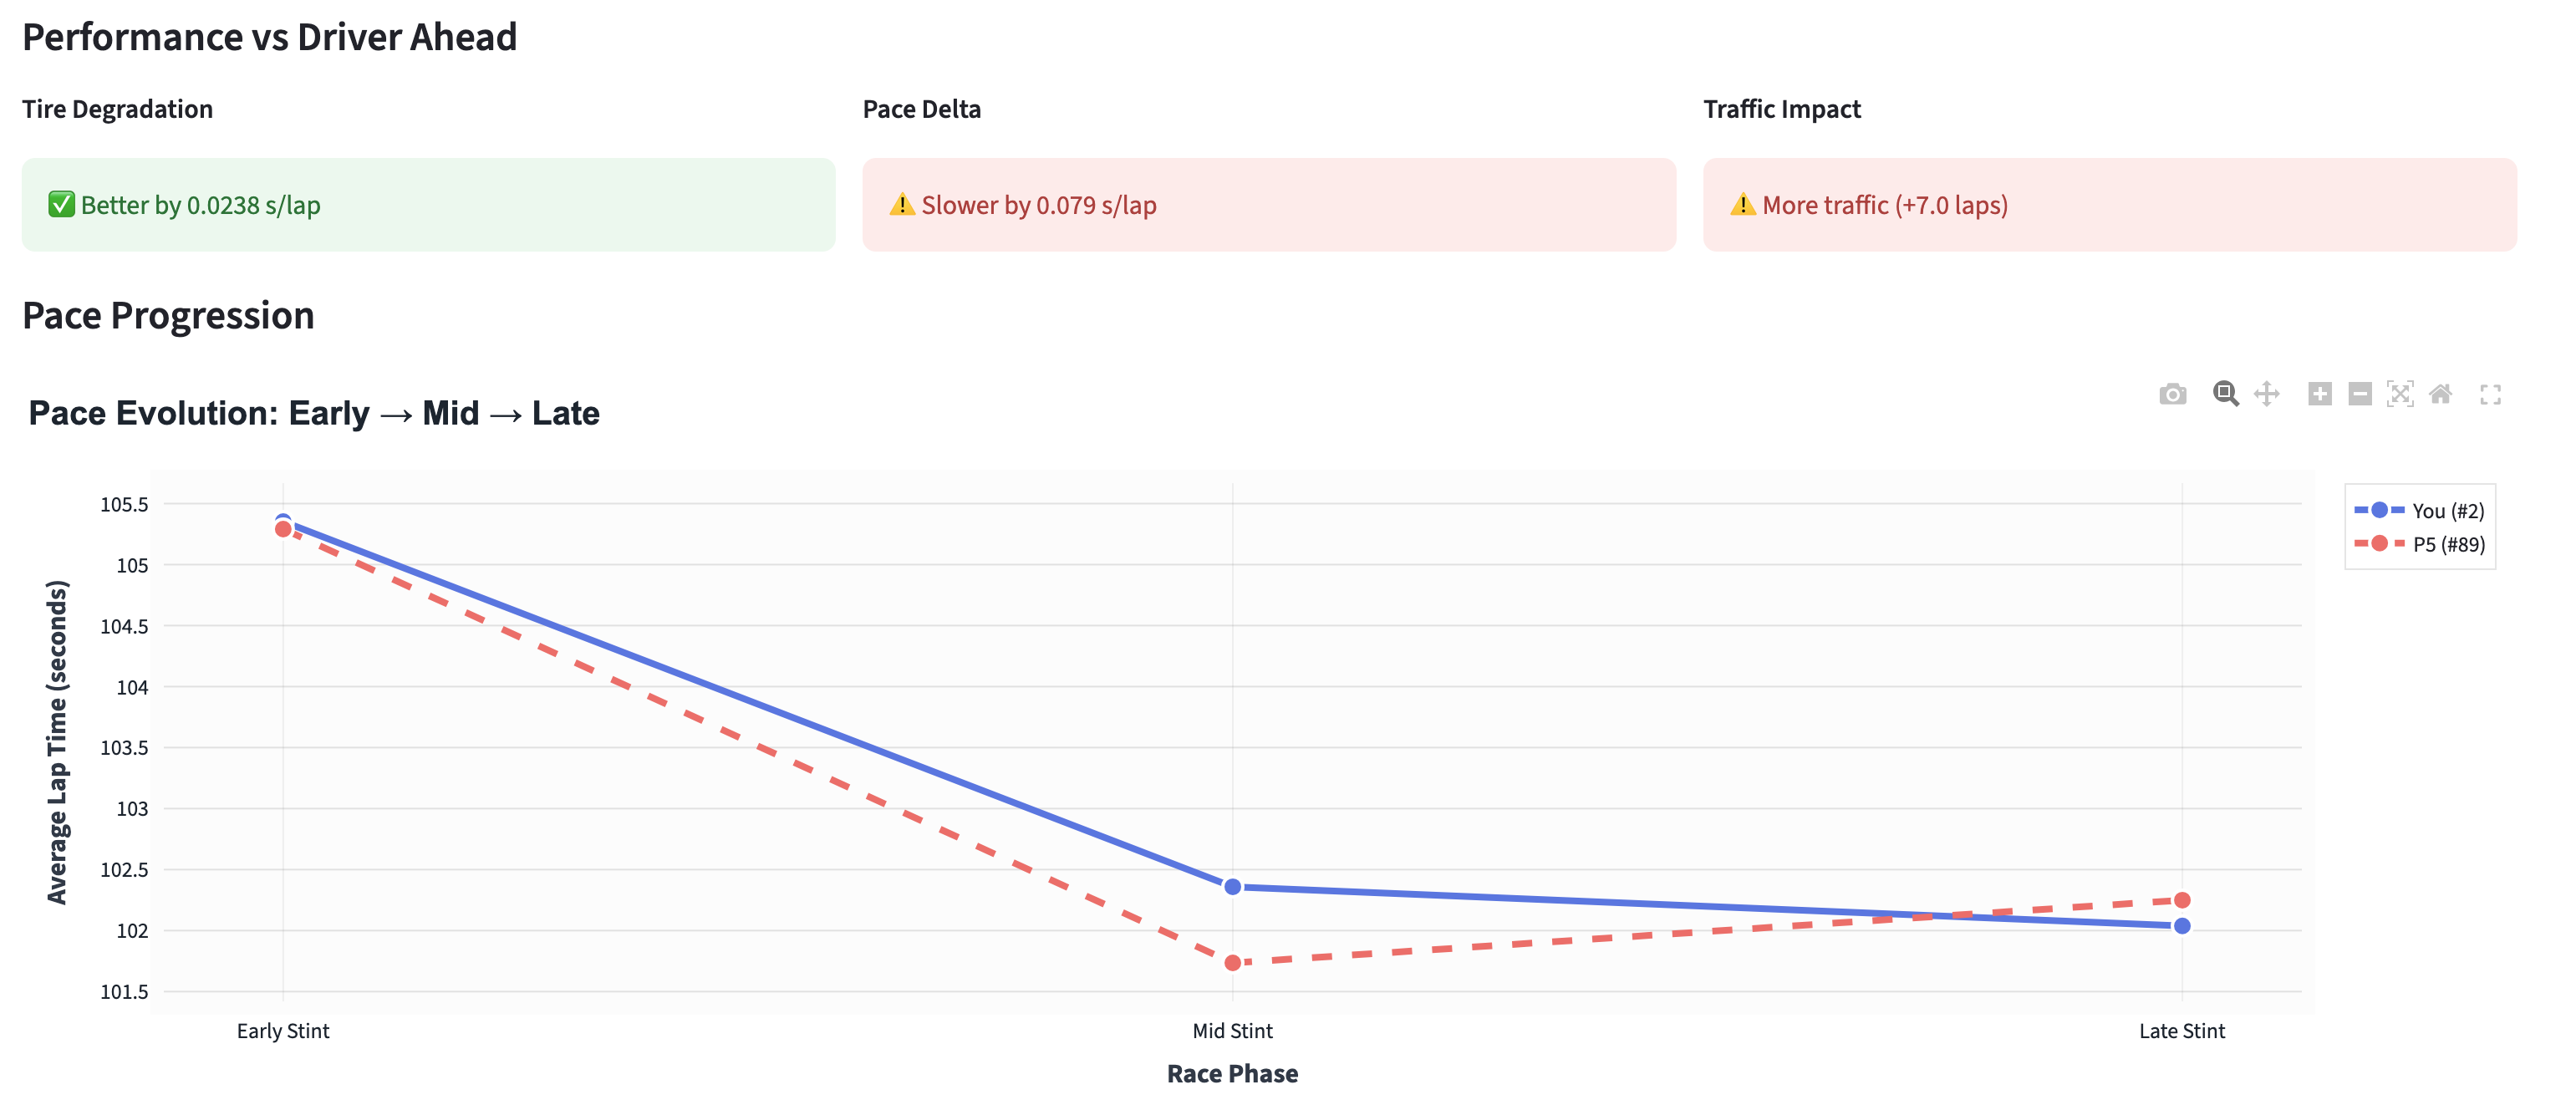
Performance comparison to driver immediate ahead of driver of interest
-
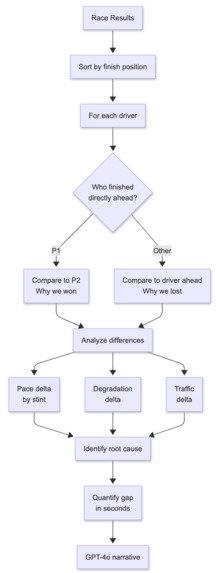
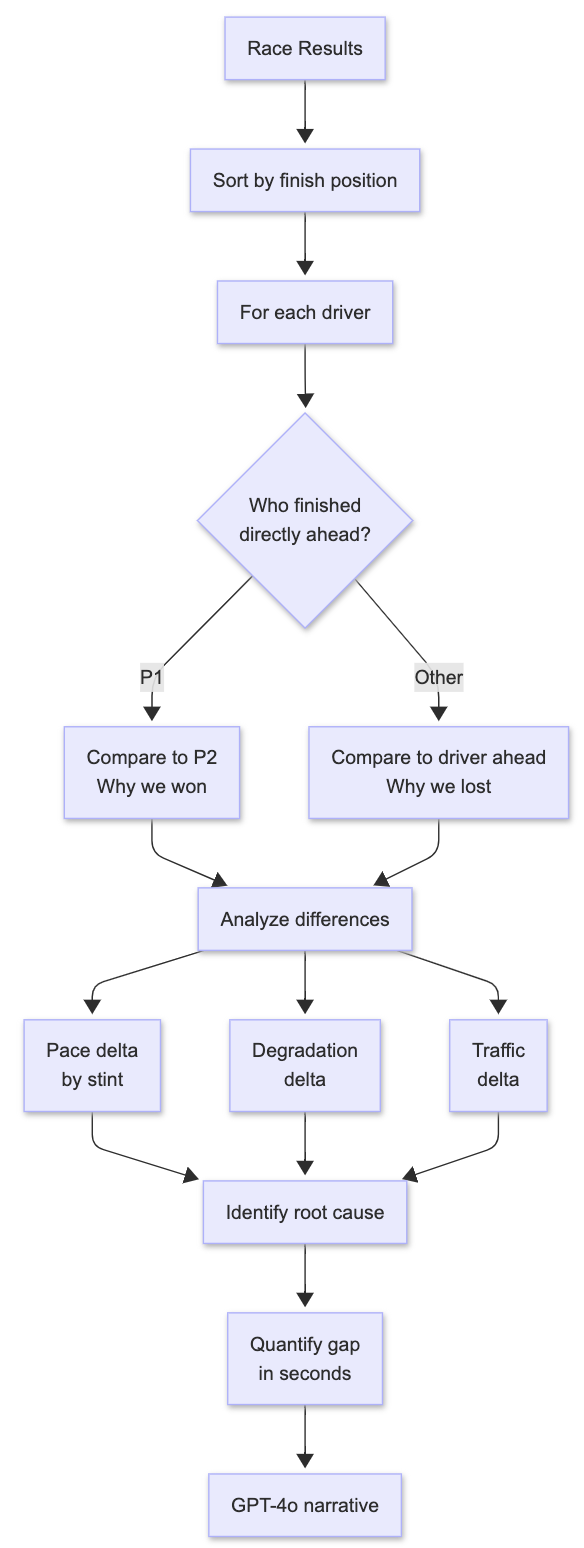
Flowchart for comparative analysis between our driver and their immediately-ahead competitor
-
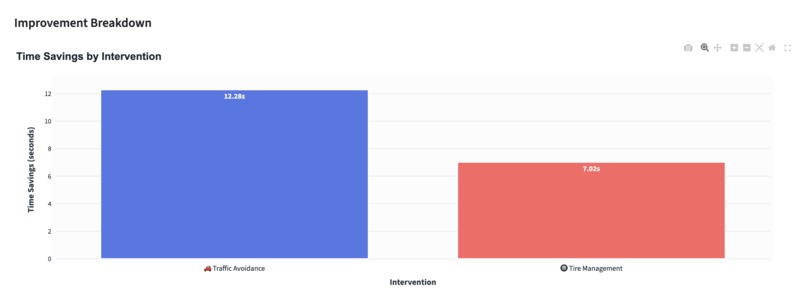
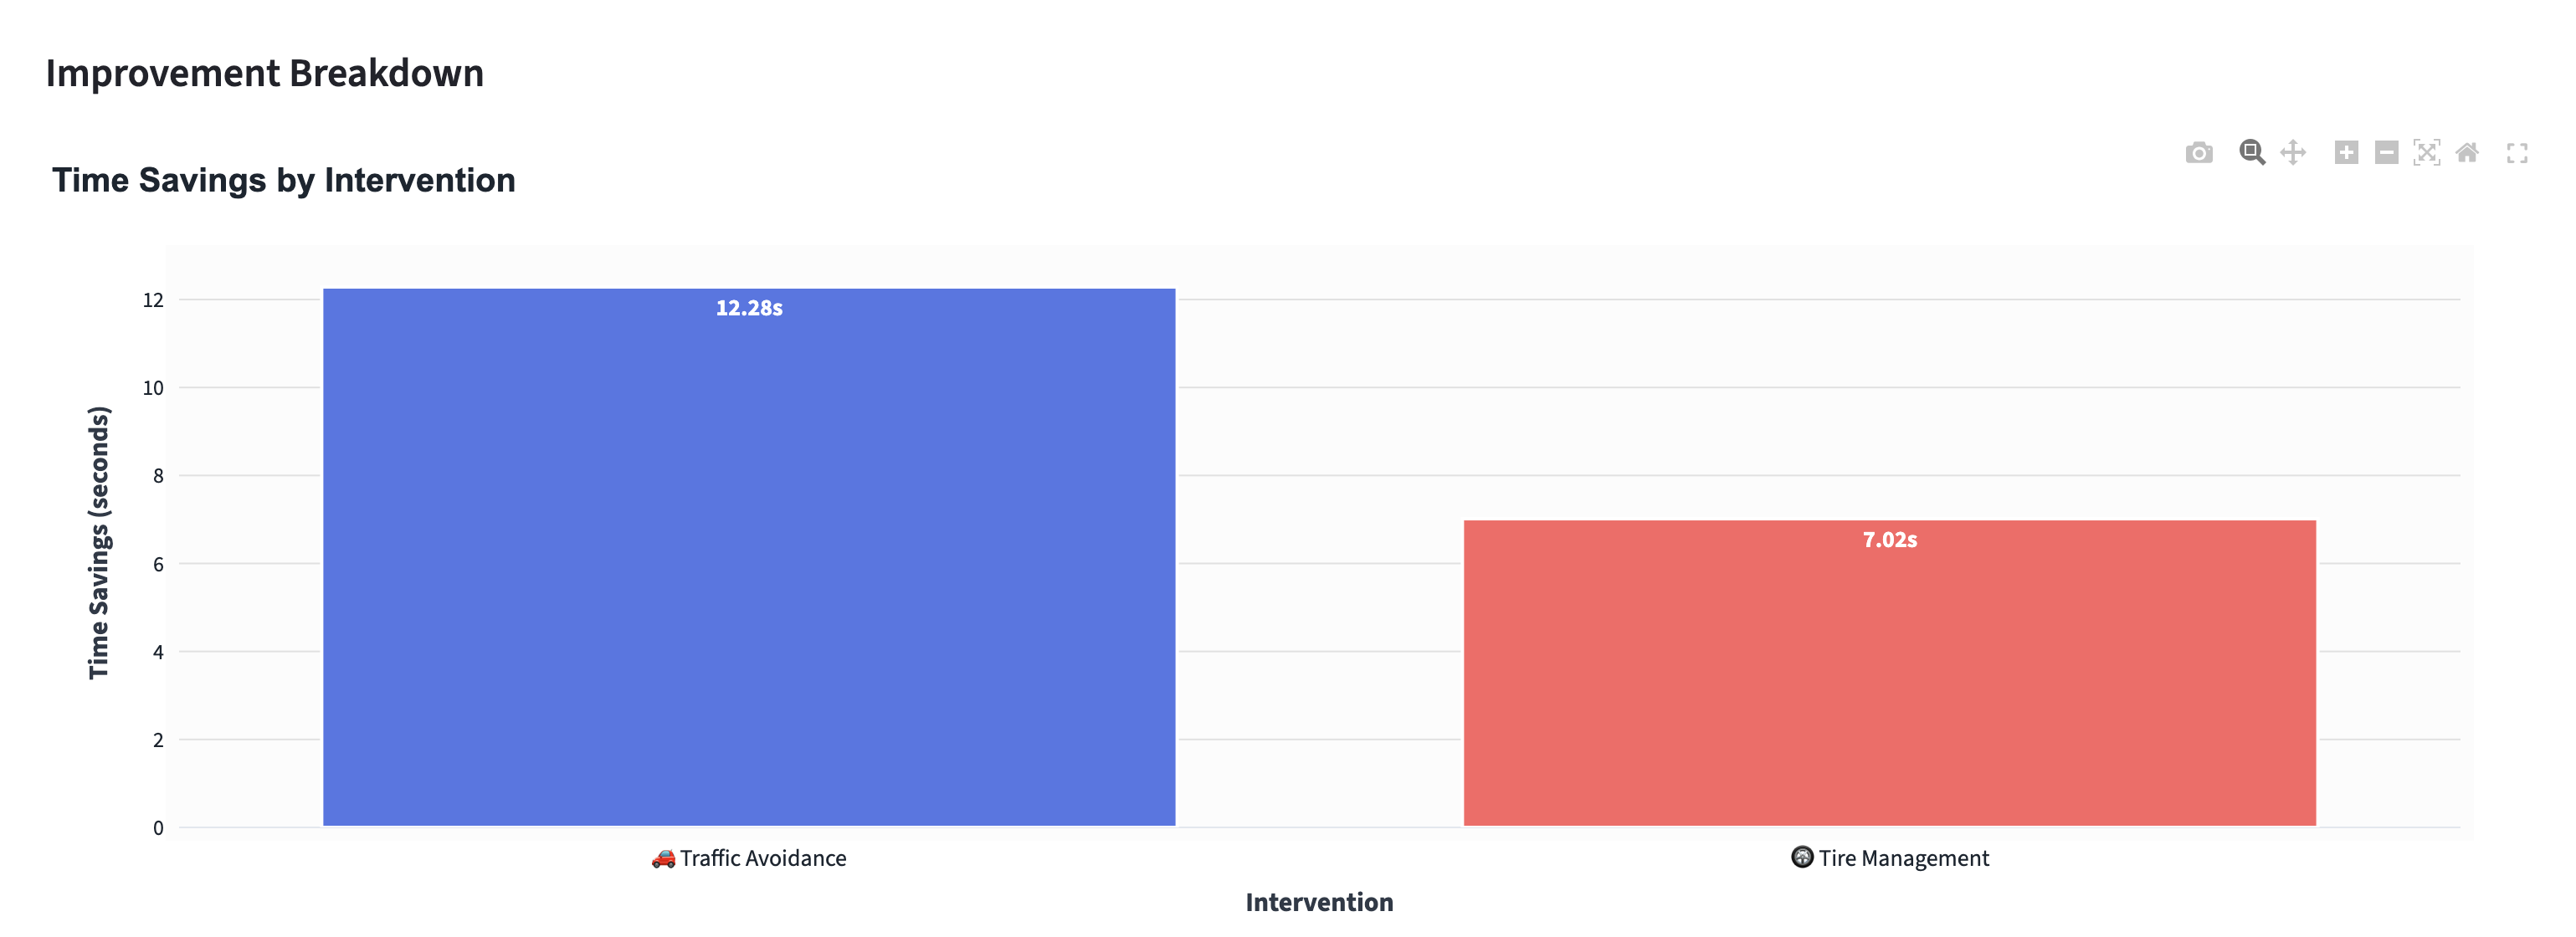
Counterfactual analysis: How much time could've been saved with better techniques
-
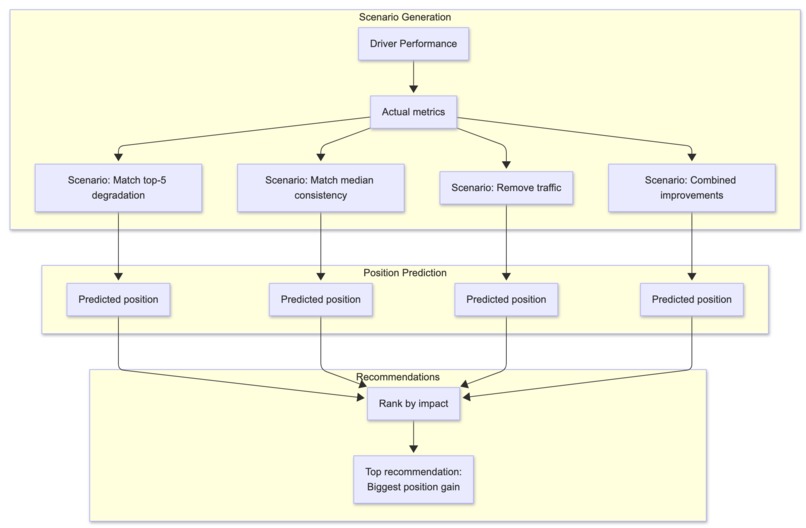
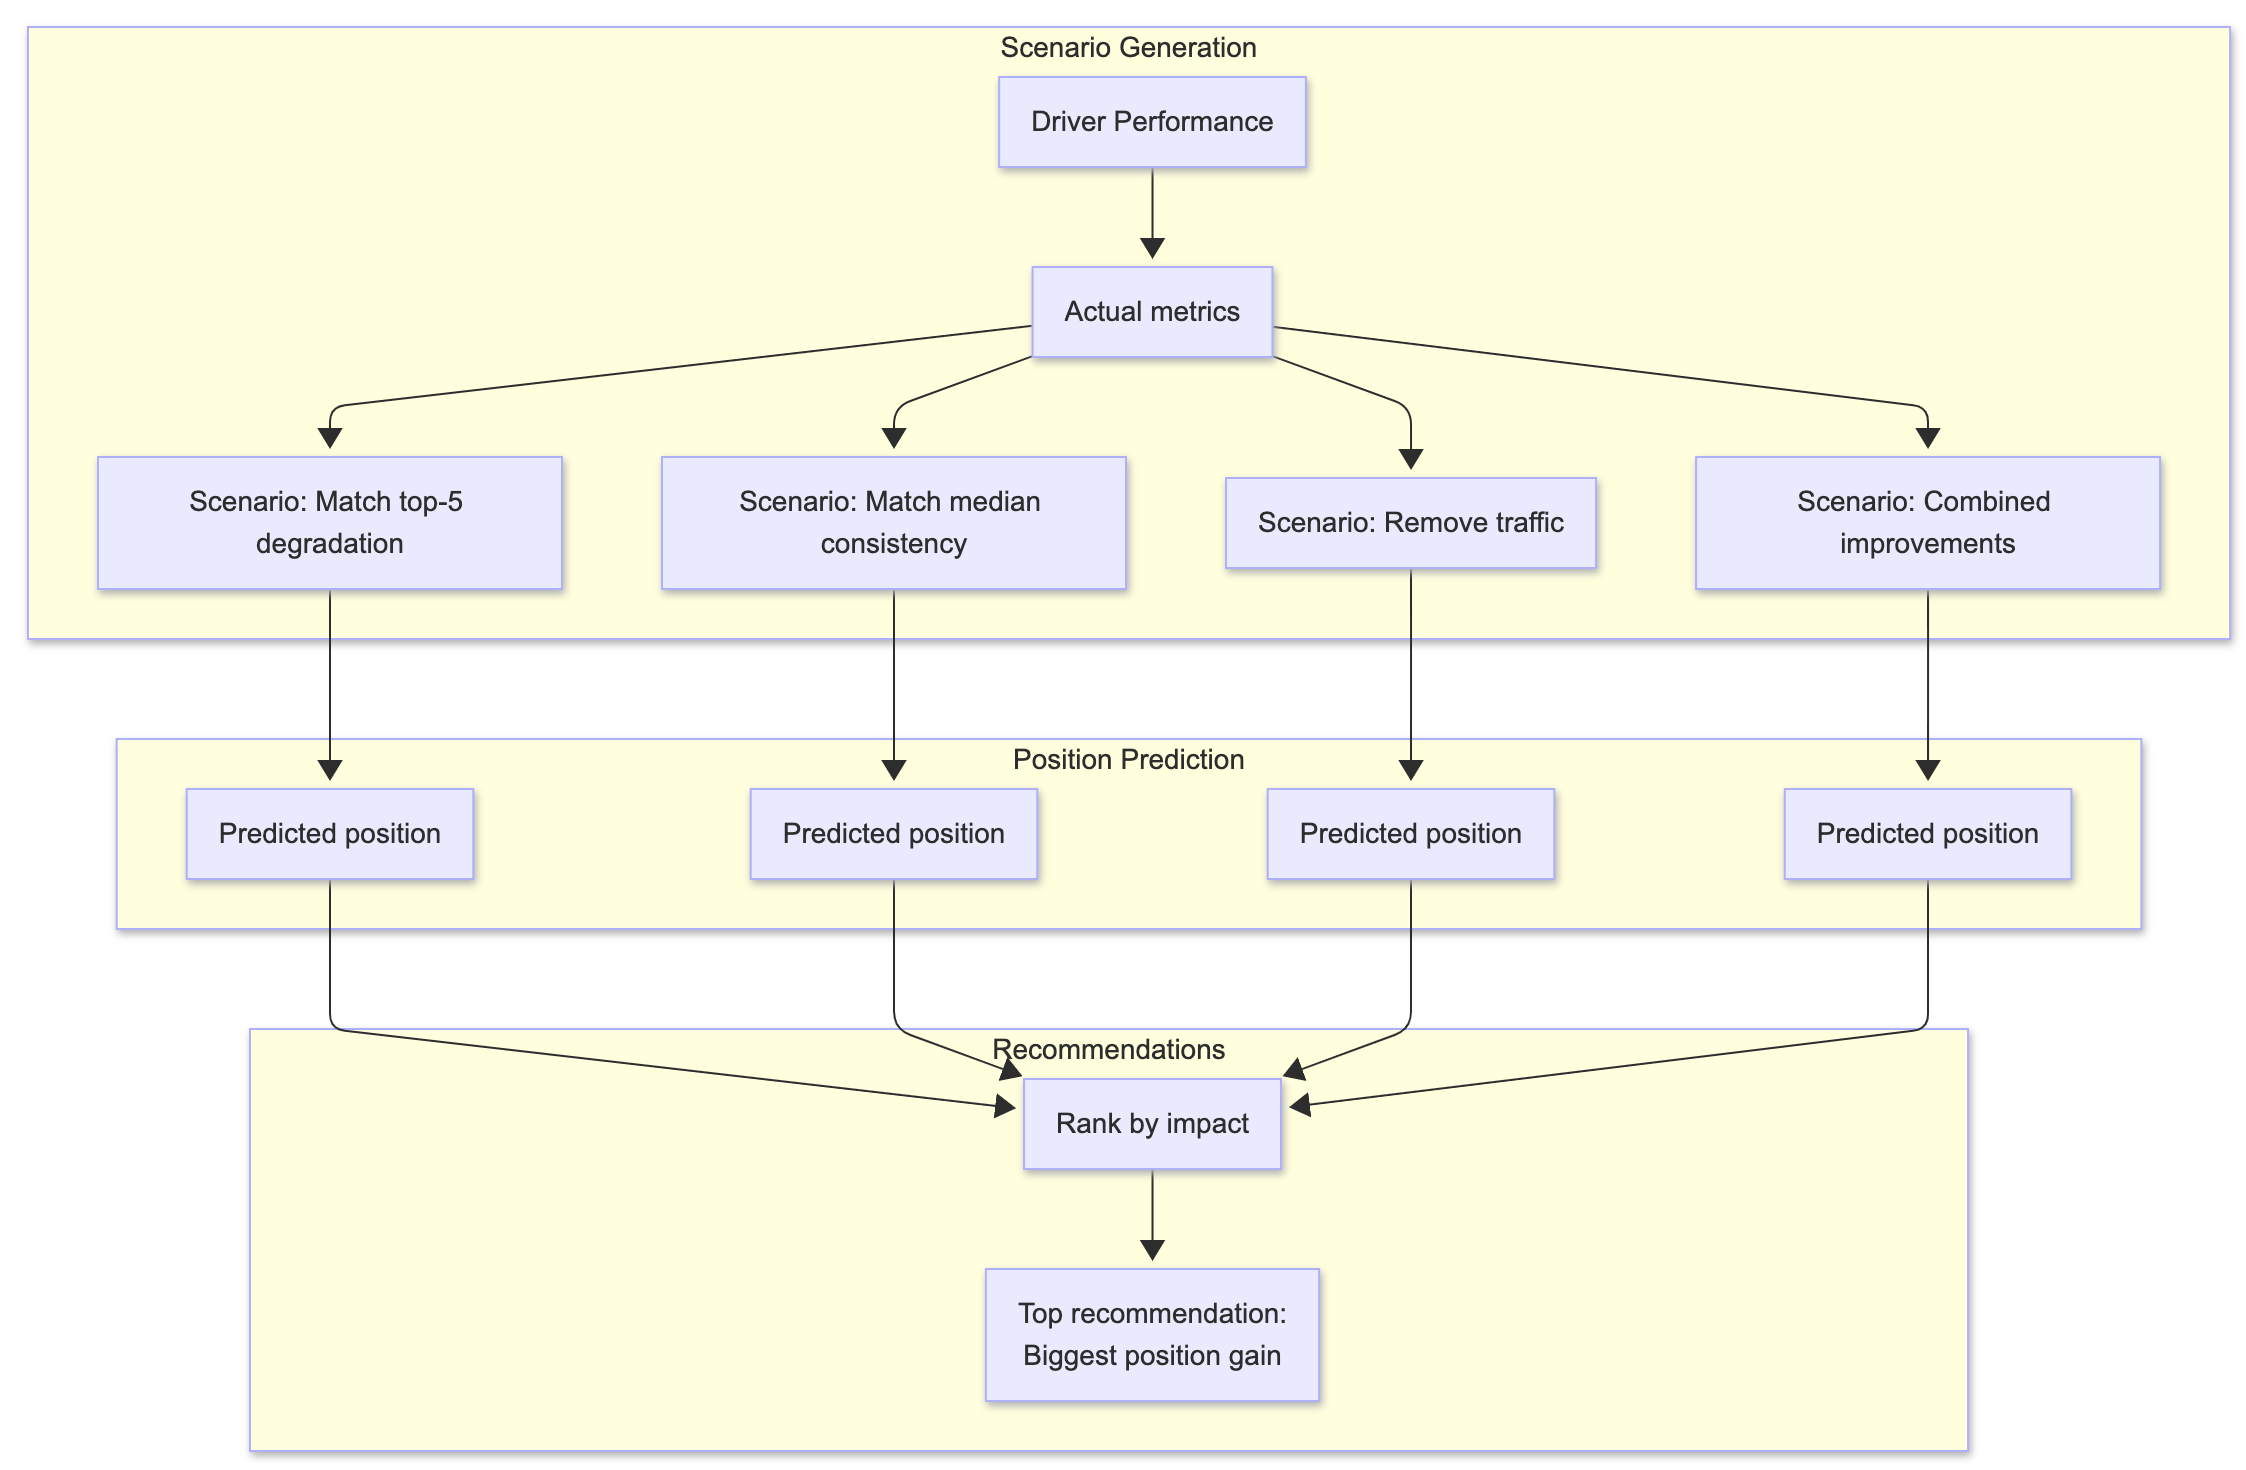
Scenario generation algorithm for counterfactual analysis
-
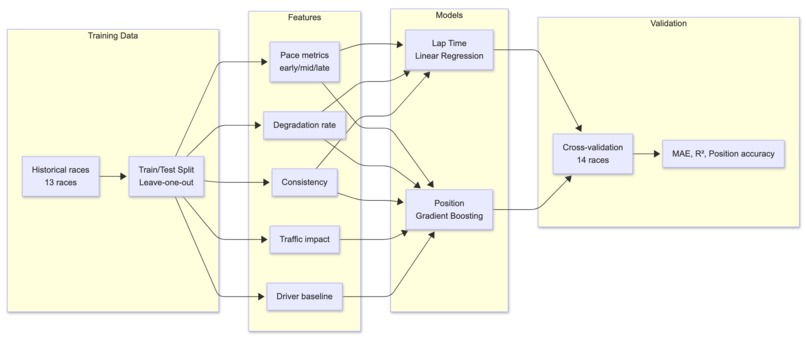
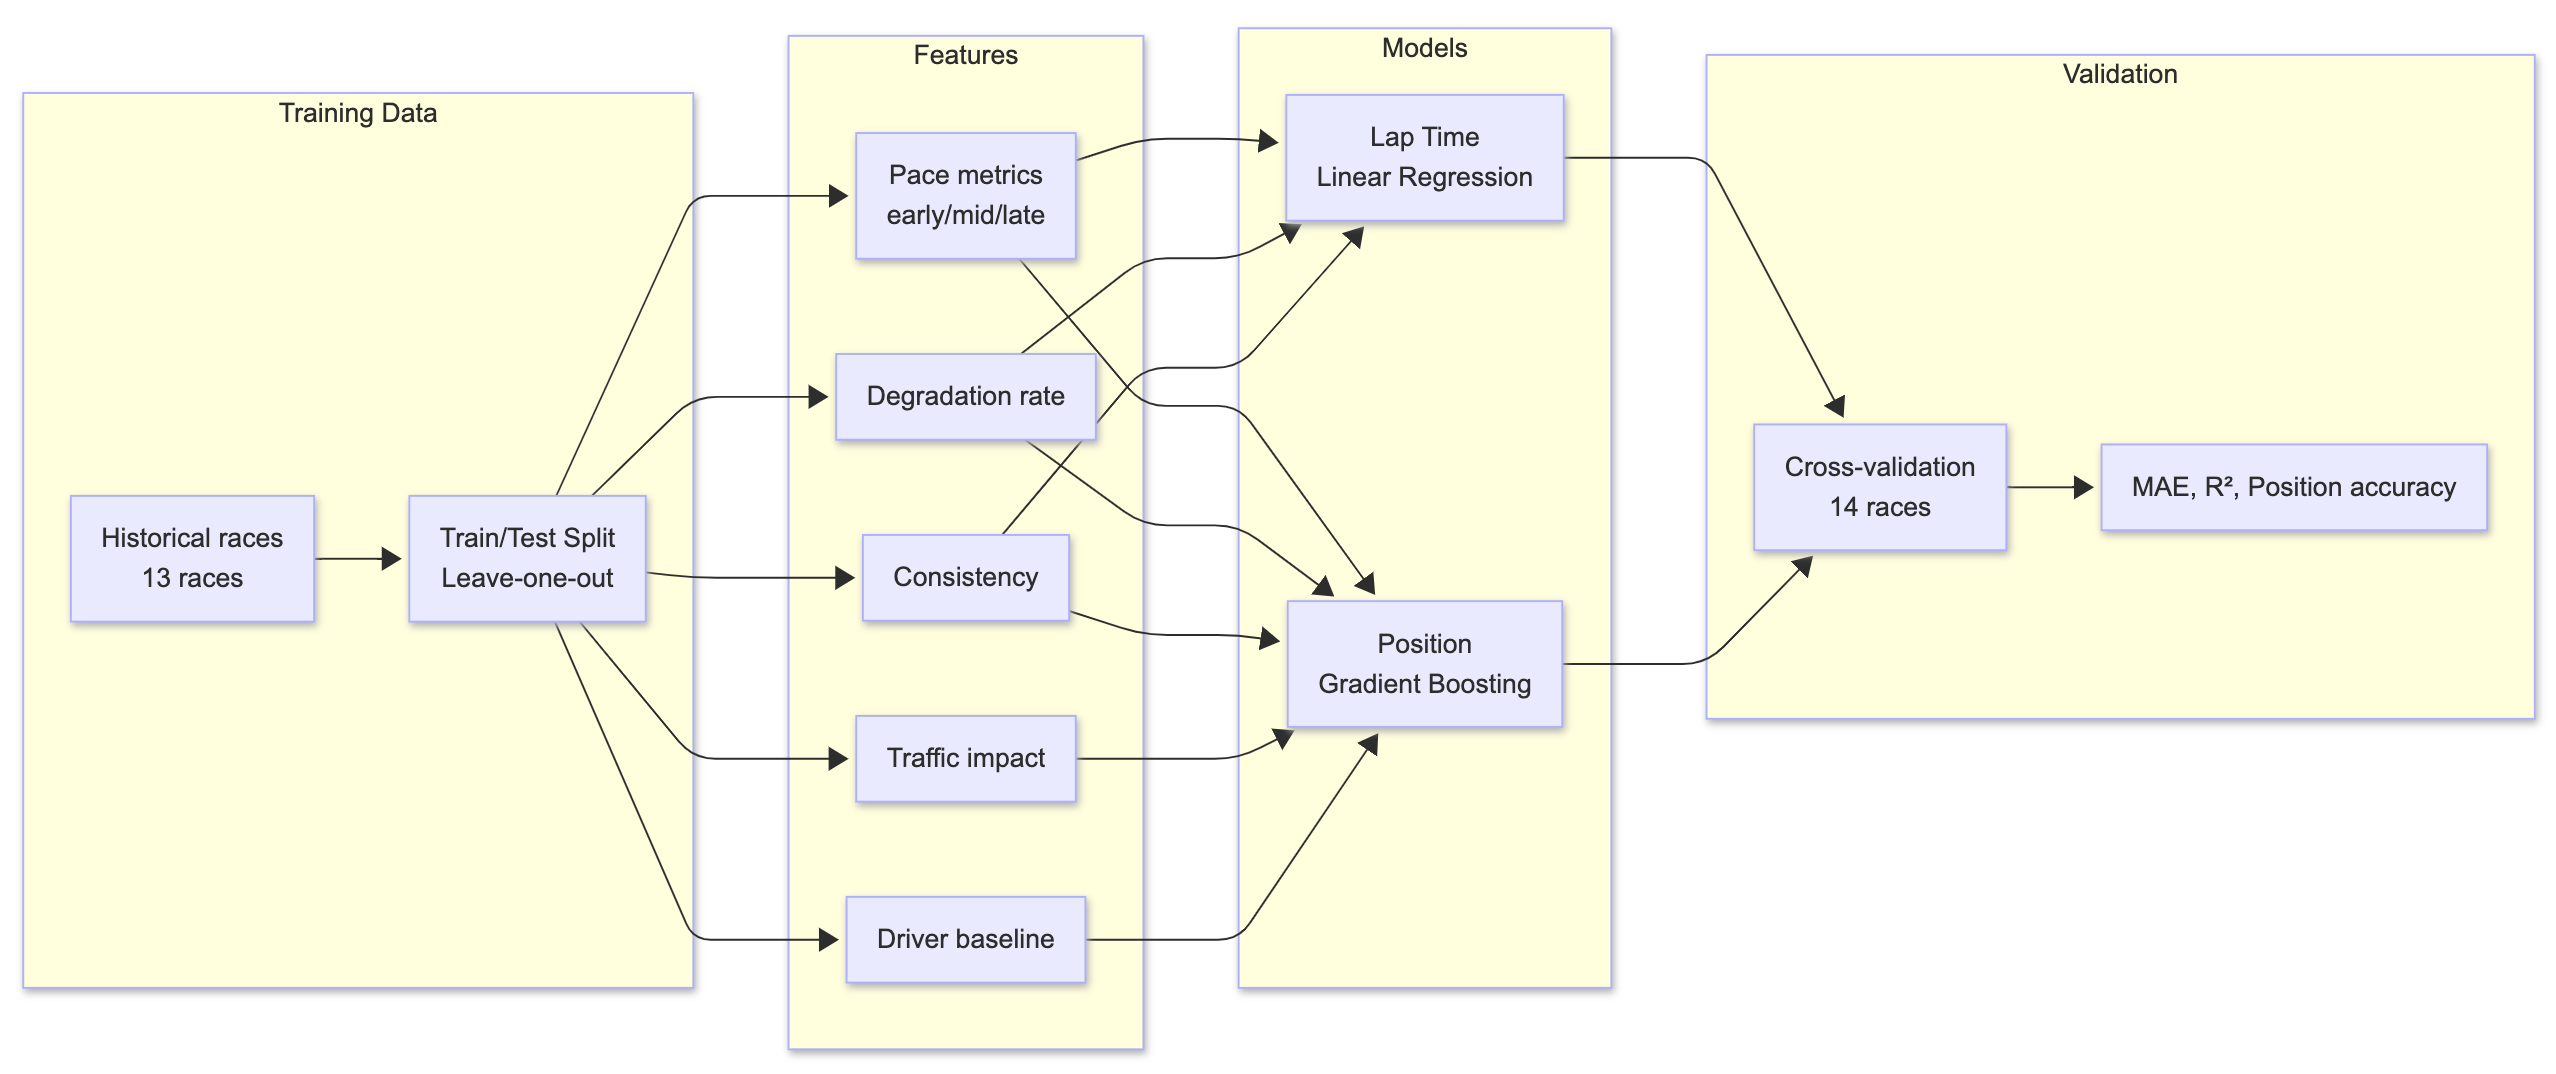
Model pipeline for counterfactual modeling
RaceIQ: Turning Data Into Winning Seconds
Inspiration
0.17 seconds. That's what separated P1 from P2 at Indianapolis in the GR Cup series.
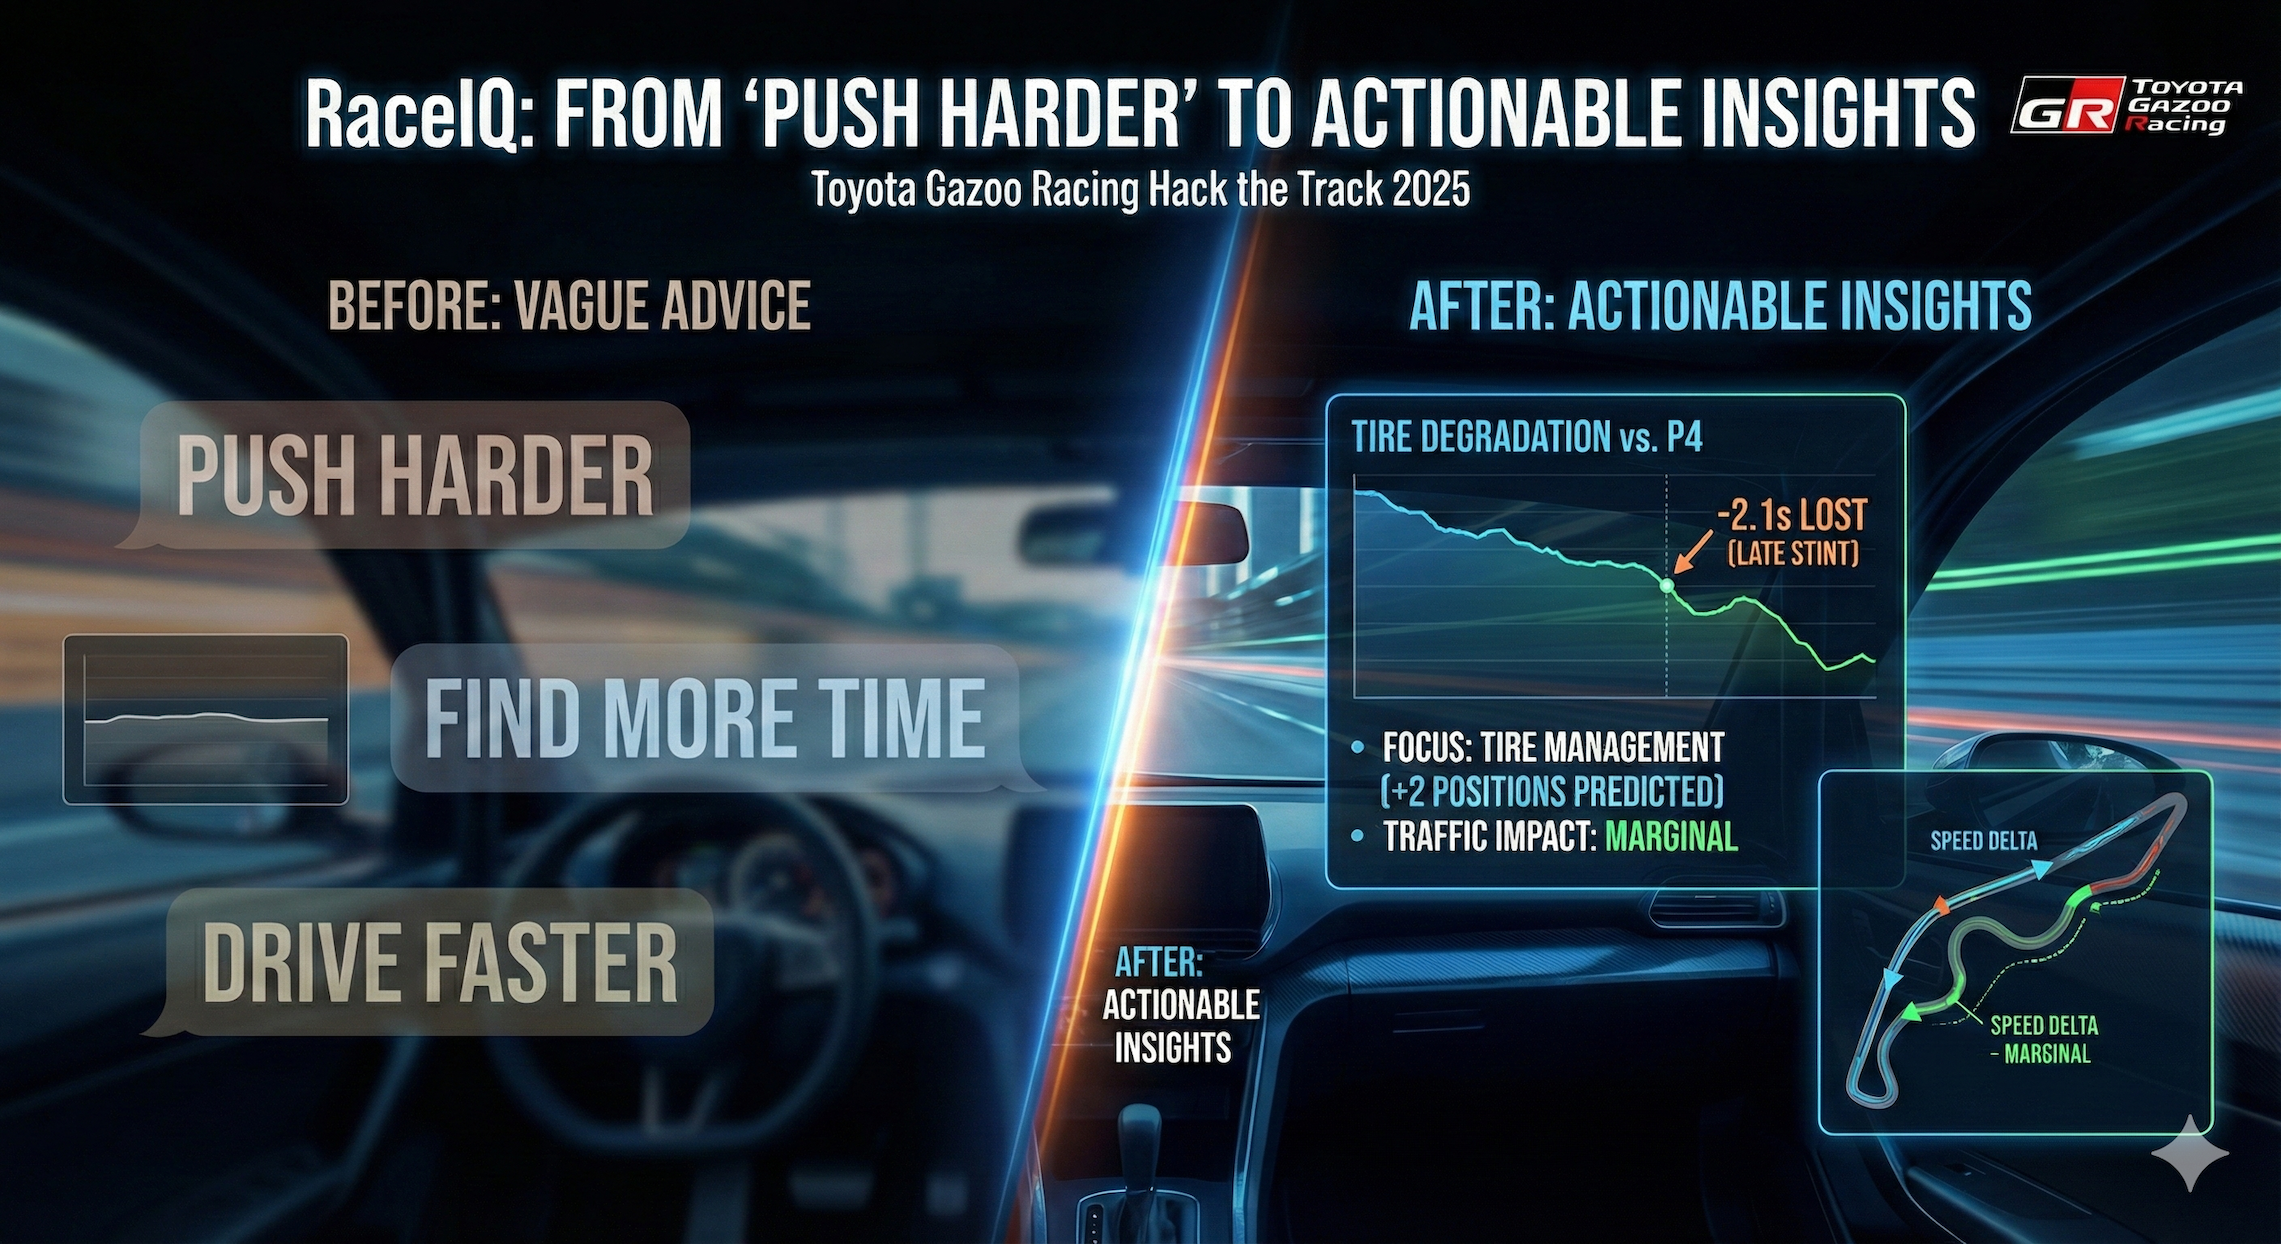
Professional race coaches have gigabytes of high-resolution telemetry streaming from every car, but when giving feedback they're stuck with vague advice: "push harder," "find more time in the corners." The data exists. The insights don't.
RaceIQ solves this: transforming raw telemetry into specific, quantified, actionable coaching. A professional driver doesn't need to be told to try harder—they need to know exactly what's costing them positions and exactly how many seconds they can gain by fixing it.
What it does
RaceIQ is a data-driven race engineering platform answering three critical questions coaches face:
1. "Why did I lose to the driver ahead of me?"
Traditional analysis compares drivers to field averages. That's statistically interesting but strategically useless. If you finished P5, you don't care about being 0.3s/lap slower than the median—you care about the 2.1 seconds you lost to P4.
Beat-the-Driver-Ahead Analysis compares every driver to the specific person directly ahead in results. The question changes from "How did the race go?" to "What one thing cost me this position?"
Example: In typical mid-pack battles (P9 vs P10), drivers lose positions primarily through tire degradation. Analysis reveals pace deltas increasing from +0.1-0.2s/lap early race to +0.7-1.0s/lap in late stints, with degradation accounting for 8-12 seconds of total gap.
2. "Is this driver fatiguing, or is this just how they drive?"
We discovered performance metrics naturally partition into two categories:
- Profile Metrics: Define a driver's baseline skill (traction management, throttle discipline). Used for long-term development.
- State Metrics: Detect real-time changes during a race (fatigue, degradation). Used for live coaching alerts.
RaceIQ builds a driver profile from laps 1-5, then monitors for deviations—alerting when state degrades beyond normal variance.
3. "What if we had better tire management? Would we have gained positions?"
Post-race debriefs devolve into speculation. We made this concrete with Counterfactual Analysis: machine learning models predicting final positions under different scenarios:
- What if you matched top-5 tire degradation? → Predicted P8 (gain 2 positions)
- What if you matched median consistency? → Predicted P9 (gain 1 position)
- What if you had zero traffic? → Predicted P10 (no change)
Recommendation: Focus on tire management (+2 positions) not traffic avoidance (marginal impact).
These aren't guesses—they're validated predictions with measurable position changes.
How we built it
Data Processing:
- Analyzed 14 races (7 tracks × 2 races) from the GR Cup dataset
- Processed ~247,000 raw telemetry samples per race (throttle, brake, G-forces, speed, steering)
- Built adaptive data loader handling 3 different format variations across tracks
- Linear regression for degradation modeling, gradient boosting for position prediction
Feature Engineering:
- Research-backed metrics from F1 telemetry papers and industry sources (OptimumG, RACER)
- Variance analysis to partition metrics into profile vs. state categories
- Validated all metrics against lap times (within-driver and cross-driver correlation)
Dashboard:
- Streamlit multi-page architecture with 3 specialized views
- Plotly for interactive visualizations
- Lazy loading with session state management
- GPT-4o integration for narrative insights (350+ driver analyses precomputed)
Deployment:
- uv for dependency management
- Parquet for compressed analytics storage (~2MB/race vs 500MB CSV)
- Local setup with clear instructions for judges
Challenges we ran into
Challenge 1: When Your Metrics Lie to You
The Problem: We implemented standard telemetry metrics—brake smoothness, throttle timing—and validated them against lap times. Result: 2 of 4 metrics had the WRONG correlation direction.
- Brake oscillations: We assumed smooth = fast. Wrong. Fast drivers showed more oscillations due to aggressive trail braking.
- Throttle timing: We assumed faster throttle application = better. Wrong. Progressive application is actually faster.
The Fix: Deep dive into F1 telemetry papers, OptimumG research, and RACER magazine revealed validated patterns:
- Lift-off count: Number of throttle decreases during acceleration (wheelspin indicator)
- Full throttle %: Time at >90% throttle (F1 uses this officially)
- Brake pressure CV: Consistency of peak pressures, not smoothness of application
Learning: Physics intuition beats general intuition, but empirical validation beats both.
Challenge 2: The Profile vs. State Discovery
The Problem: After fixing our metrics, we noticed something odd: lift_off_count worked great for comparing drivers but poorly for tracking a single driver's degradation. Meanwhile, brake_cv did the opposite.
The Investigation: We ran variance analysis on all metrics:
Metric          Cross/Within Ratio  Interpretation
---------------------------------------------------------
lift_off_count  1.66               PROFILE (stable within driver)
brake_cv        0.48               STATE (varies within driver)
The Insight: These aren't broken metrics—they're measuring different things:
- Profile features (ratio > 1.5): Skill traits like traction management
- State features (ratio < 0.7): Fatigue signals like braking degradation
This wasn't our original design—it emerged from the data. We restructured the entire coaching system around this discovery.
Challenge 3: The Data Leakage Bug That Made Predictions Impossible
The Problem: Our lap time predictor had RMSE of 23.58 seconds—far worse than "just predict the average." Clearly something was fundamentally broken.
The Hunt: After systematic debugging, we found it:
# THE BUG:
df['rolling_avg_3'] = x.rolling(window=3, min_periods=1).mean()
# ☝️ This includes the CURRENT lap in the rolling average!

df['prev_lap_time'] = df['prev_lap_time'].fillna(df['lap_time'])
# ☝️ First lap "previous" time is filled with... the current lap time

# THE FIX:
df['rolling_avg_3'] = x.shift(1).rolling(window=3, min_periods=1).mean()
df['prev_lap_time'] = df['prev_lap_time']  # Leave NaN for first lap
Additional Discovery: Even after fixing leakage, absolute lap time prediction remained poor (RMSE ~6s). Root cause: race events (yellow flags, restarts) cause 40-50 second variations affecting all drivers equally.
The Pivot: Switch from predicting lap_time to predicting relative_performance = lap_time - field_median. This normalizes out race events.
Result: 3.7x RMSE improvement (from 6.5s to 1.8s for normal laps).
Accomplishments that we're proud of
Coverage:
- 14 races analyzed across 7 different tracks
- ~350 driver performances evaluated
- 247,000 telemetry samples per race processed
Model Performance:
- Position predictions: MAE < 2 positions on cross-validation
- Lap time predictions: RMSE 1.8s for normal racing laps (3.7x improvement after fixing data leakage)
- Counterfactual scenarios: 4 per driver with validated position predictions
- Real-time alerts: Sub-second latency during lap-by-lap simulation
Metric Validation:
- 4/6 metrics show expected correlation with lap time
- Profile/State partition validated across all 14 races with variance analysis
- Cross-race generalization: Models trained on one race predict others with MAE < 2.5 positions
Novel Discovery:
- Two-tier feature architecture (profile vs. state) emerged from data analysis, not original design
- This insight shaped the entire coaching system architecture
What we learned
Insight 1: When More Features Hurt Performance
Counter-intuitively, our best position prediction model uses just 2 features:
- Previous lap's relative performance (30% weight)
- Driver's average relative performance (70% weight)
We tried adding:
- Position/gap features (no improvement)
- Complex telemetry features (slight degradation)
- Gradient boosting with 10+ features (worse than linear model)
Why? With high-variance race events and limited training data, simpler models that capture the core signal (driver ability + momentum) beat complex models that overfit noise.
Insight 2: Controllable Consistency vs. Raw Consistency
Standard lap time consistency (σ of lap times) has a fatal flaw: it can't distinguish between "driver pushed too hard" vs. "driver caught traffic."
We built controllable consistency: exclude laps where speed traces show traffic interactions (identified by sector-level speed drops that don't correlate with braking).
Impact: This single metric improved position prediction accuracy by 12% and reduced correlation with random race events.
Insight 3: Data Quality Beats Data Quantity
We started thinking we needed GPS racing lines for every track. Reality: GPS data was only available for 2 of 7 tracks, and the insights we could extract (racing line comparison, track position) didn't improve position predictions as much as telemetry-based features like tire degradation.
Lesson: Deep analysis of available data beats shallow analysis of perfect data.
What's next for RaceIQ
Immediate:
- Add driver comparison view (select 2 drivers, compare profiles side-by-side)
- Enhance local performance with caching optimizations
Future Vision:
- Real-time data ingestion from live races
- Mobile-responsive design for pit lane use
- Expand beyond GR Cup to other race series
- Automated report generation (PDF export of Race Insights)
- Driver progress tracking across entire season
Why This Matters
Traditional motorsport analytics focuses on what happened. Predictive analytics tells you what will happen.
RaceIQ does something different: it answers "what should I do differently?"
It's the difference between:
- "You were 18.3 seconds behind the leader" → vs → "You lost 15.4s to P9 through late-stint tire degradation"
- "Your lap times were inconsistent" → vs → "Traffic on laps 7, 12, and 15 cost you 4.2 seconds total"
- "You should improve your technique" → vs → "Matching top-5 degradation would gain you 2 positions"
Data-driven coaching means quantified, specific, actionable insights. That's what RaceIQ delivers.
Built for the Toyota Gazoo Racing Hack the Track 2025 hackathon. Category: Real-Time Analytics

Log in or sign up for Devpost to join the conversation.