
Inspiration
Motorsport is often described as data-driven, but for most fans and even many engineers, that data remains hidden in static spreadsheets. We wanted to bridge the gap between raw telemetry numbers and the visceral reality of race strategy.
Our inspiration came from the "what-if" moments in racing: What if we pitted one lap earlier? What if the track temperature dropped by 5°C? Existing tools analyze what happened, but we wanted to build a platform that simulates what could happen. By combining a high-fidelity physics engine with Toyota’s actual GR Cup racing data, we set out to build RaceForge—a real-time simulation environment that transforms static CSV logs into a living, breathing race strategy playground.
What it does
RaceForge is a comprehensive real-time analytics and simulation platform for the Toyota GR Cup, designed to empower race engineers with predictive insights.
- Physics-Based Race Simulation: At its core is a custom 20-car physics engine running at 10Hz. It doesn't just move dots on a map; it calculates vector forces for every car. It models:
- Non-linear Tire Degradation: Grip loss is calculated per lap based on compound type (Soft/Medium/Hard) and track abrasiveness.
- Environmental Impact: Engine power output and downforce levels dynamically adjust to changes in air density, pressure, and wind vectors derived from weather data.
- Driver Human Error: Simulates realistic mistakes like lockups, off-track excursions, and spin-outs based on pressure and tire wear levels.
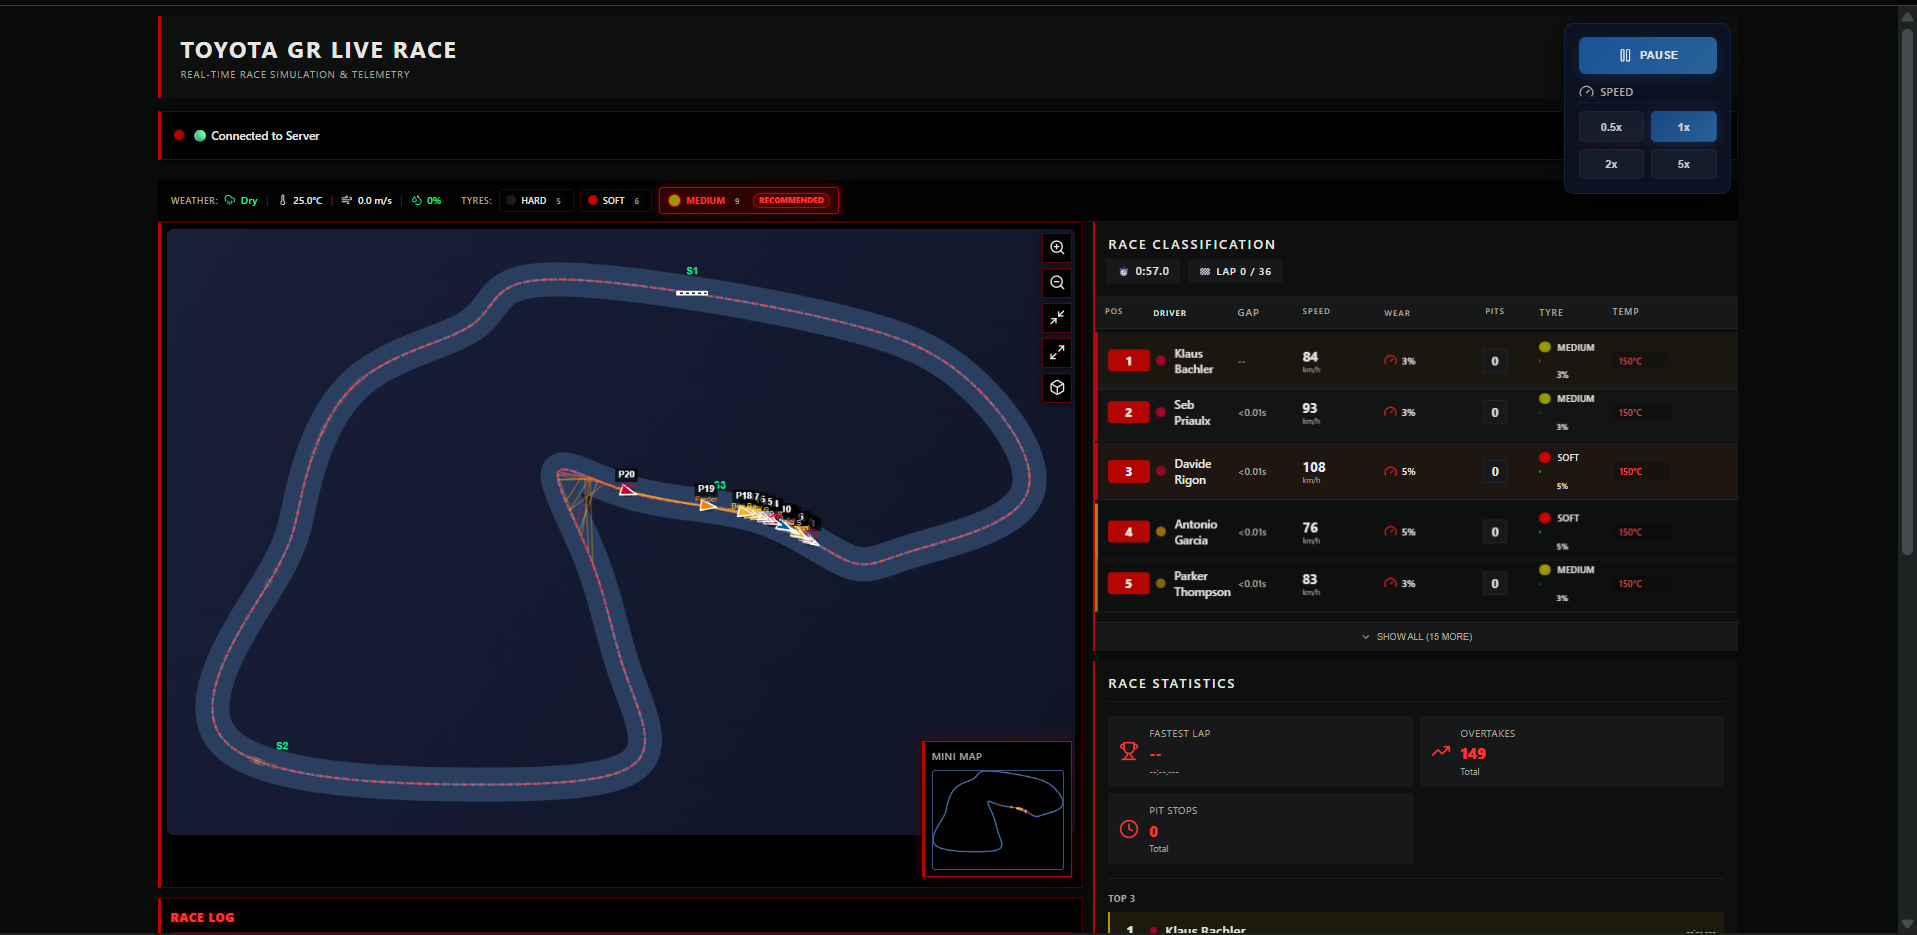
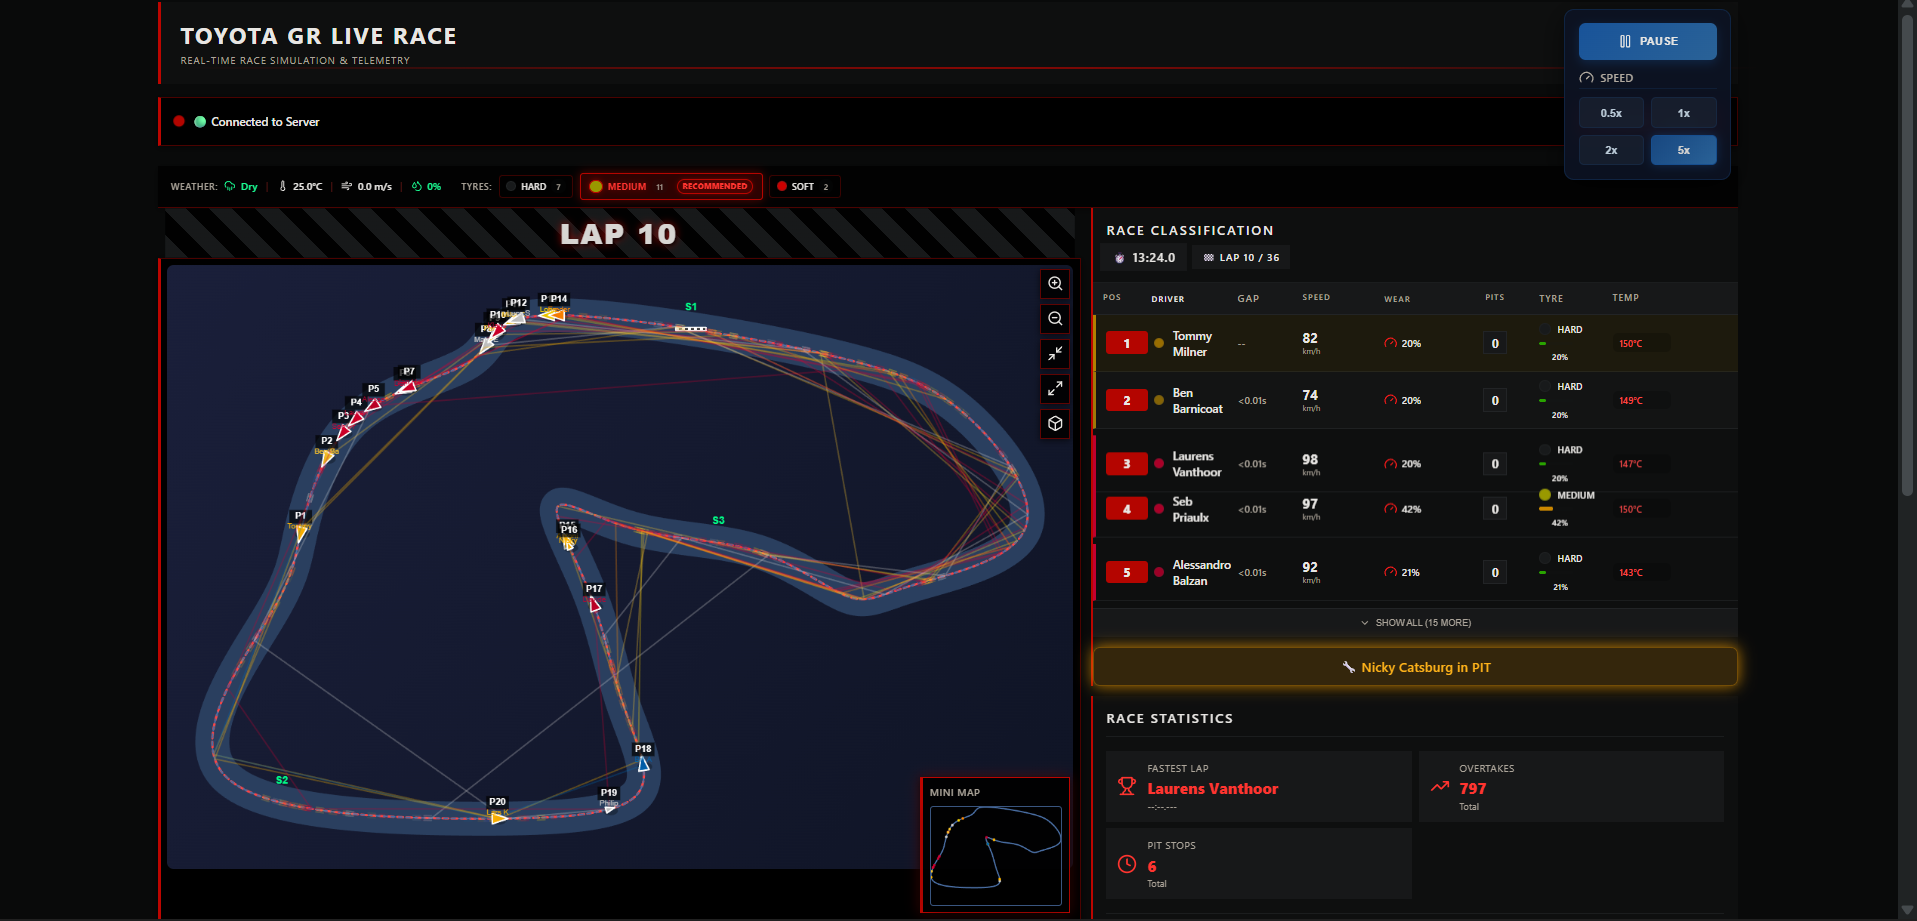
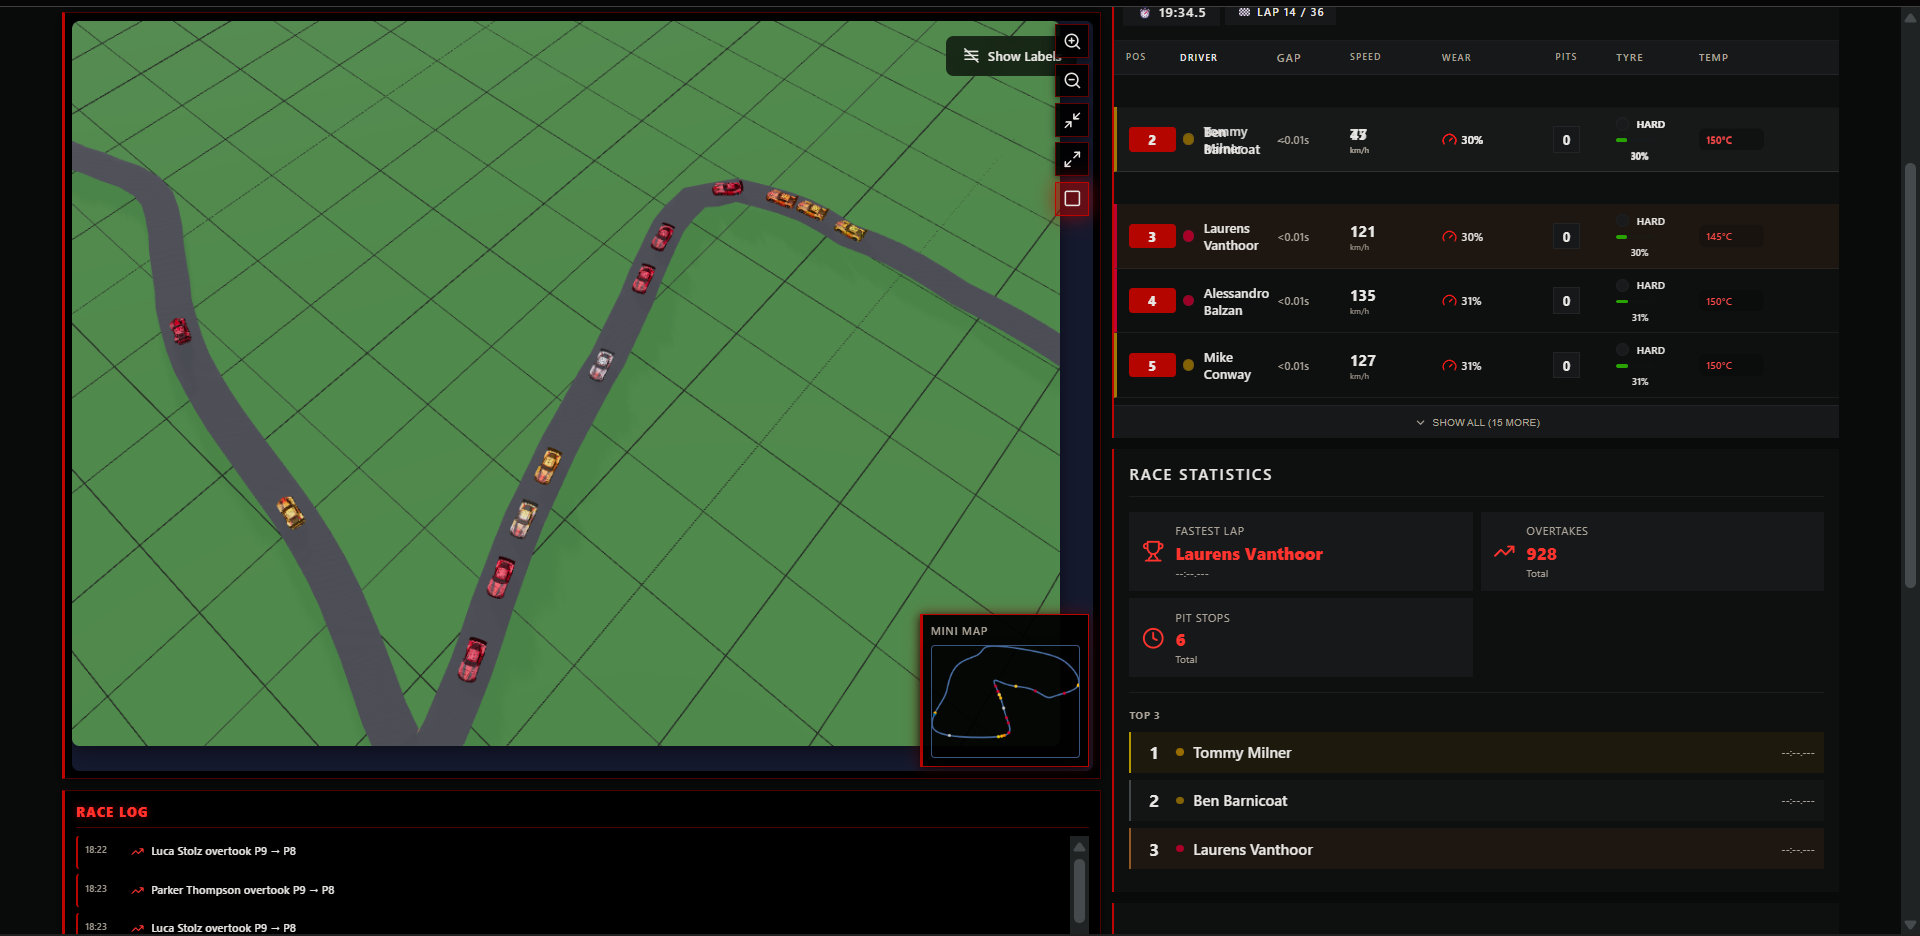
- Live Strategic Dashboard: A React-based mission control center featuring:
- 3D Track Visualization: An immersive view built with React Three Fiber that renders the track spline and car positions in real-time.
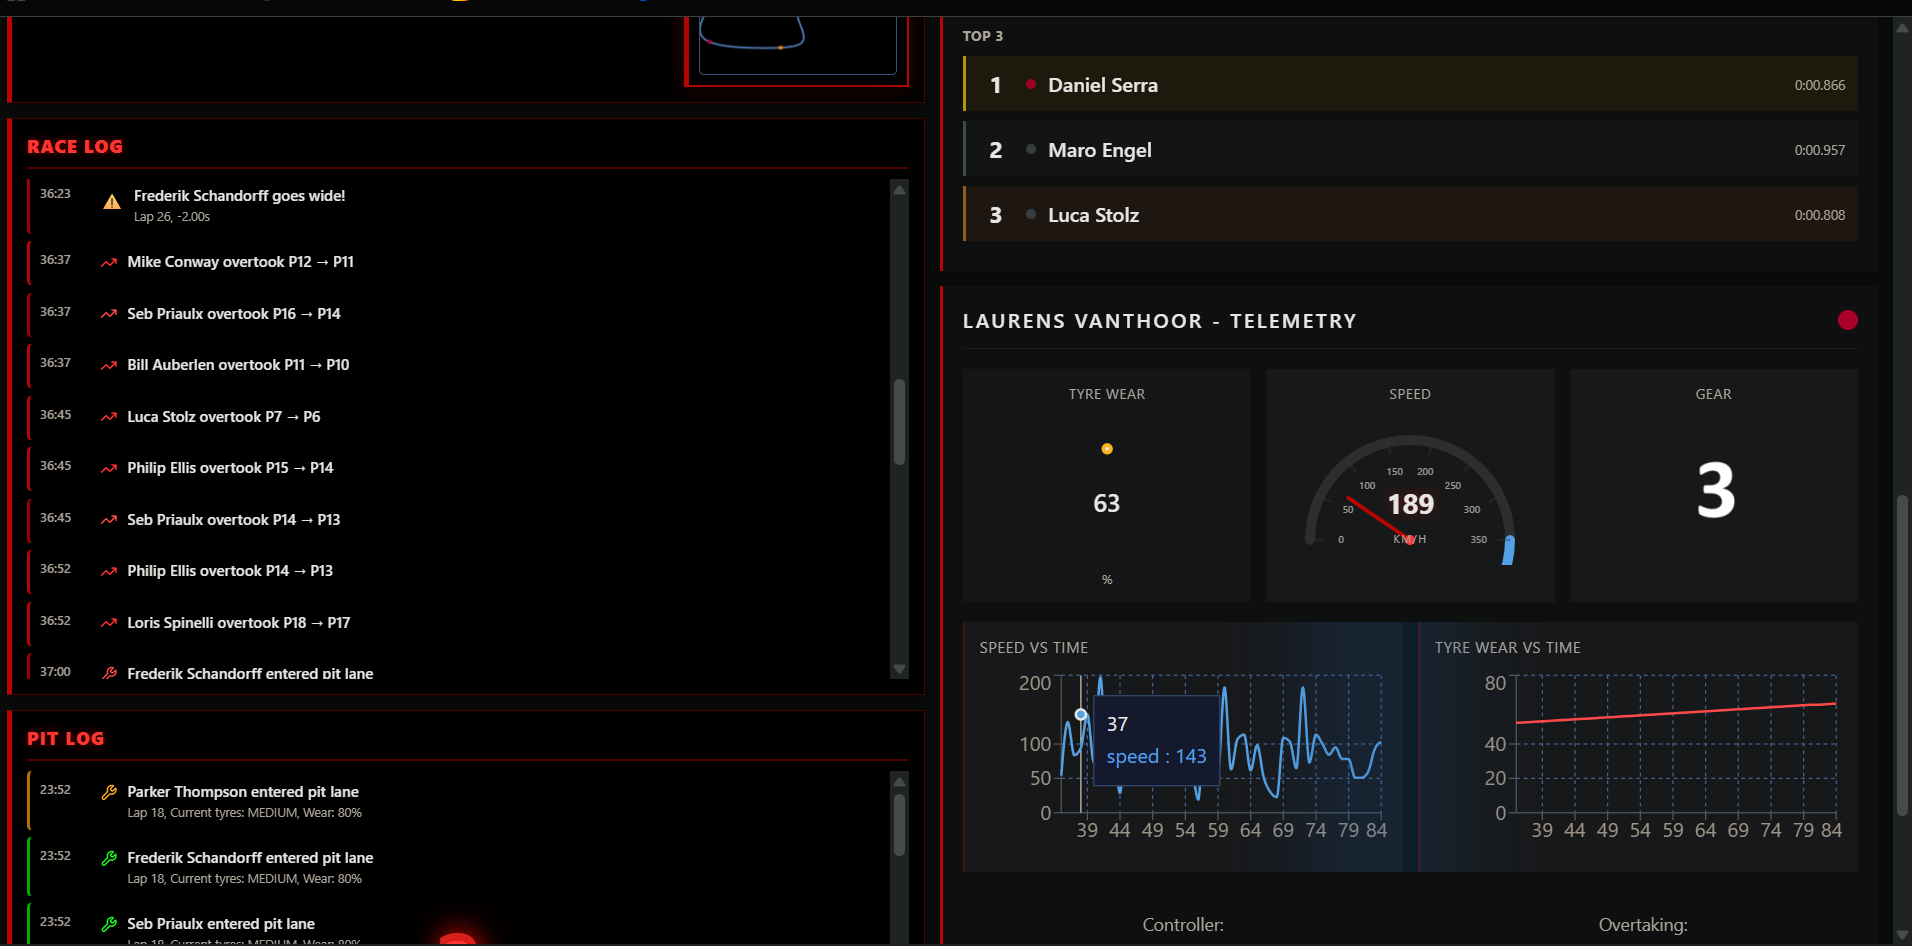
- Interactive Telemetry: Live graphs showing speed traces, throttle application, and tire temperatures for any selected driver.
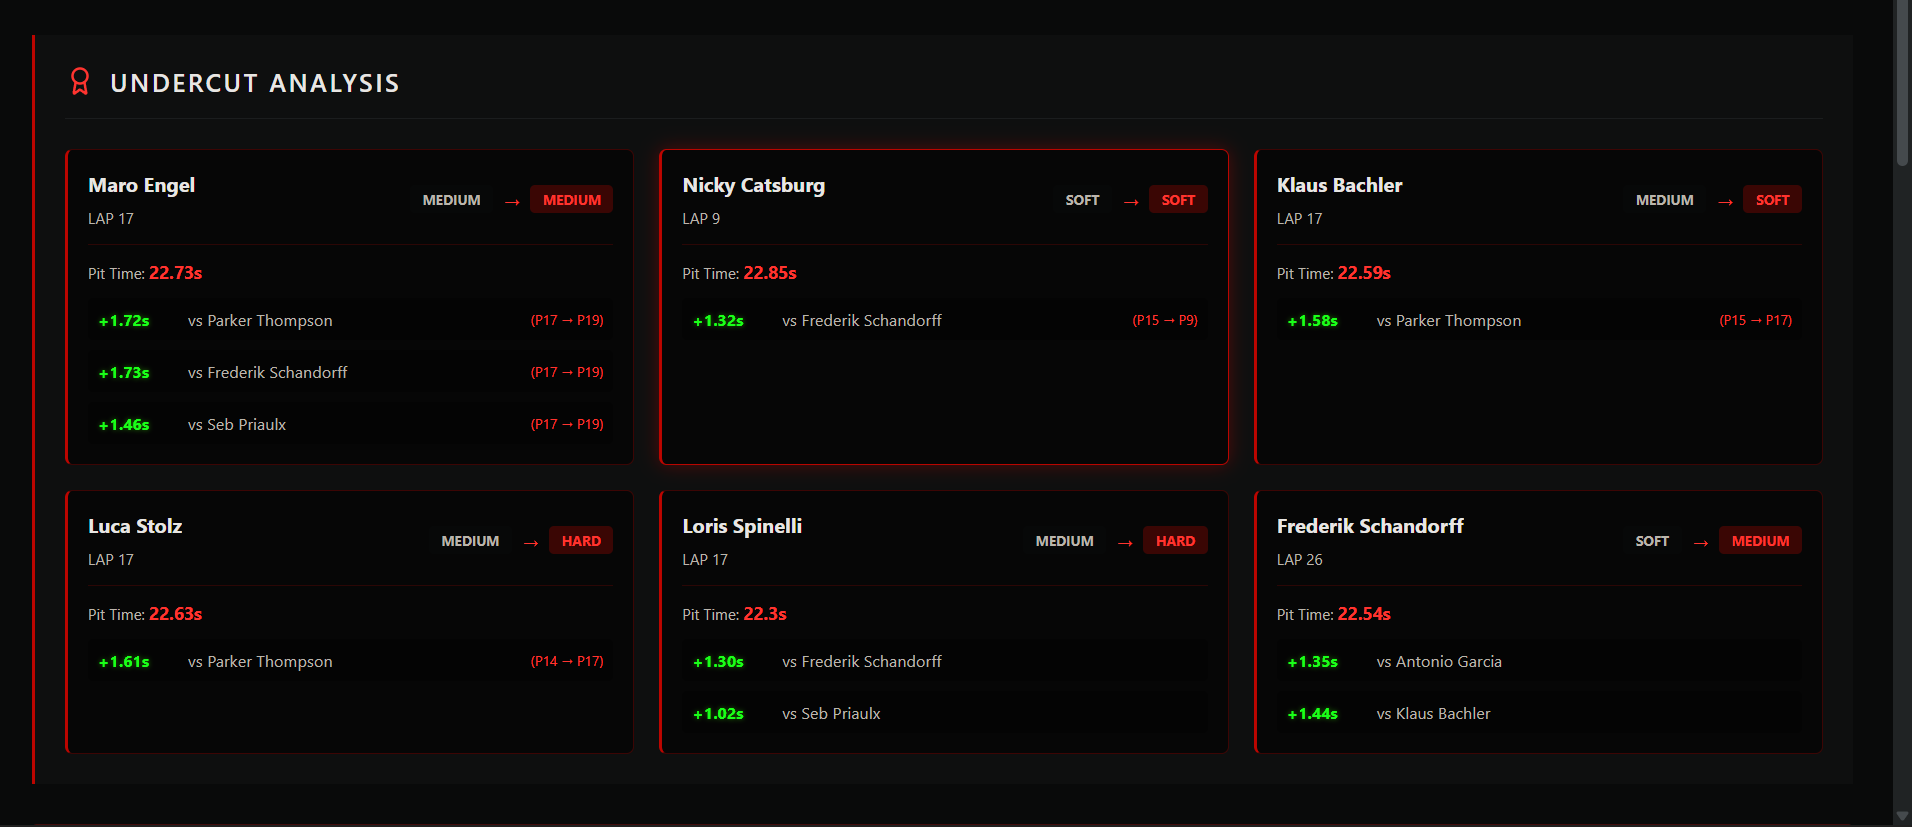
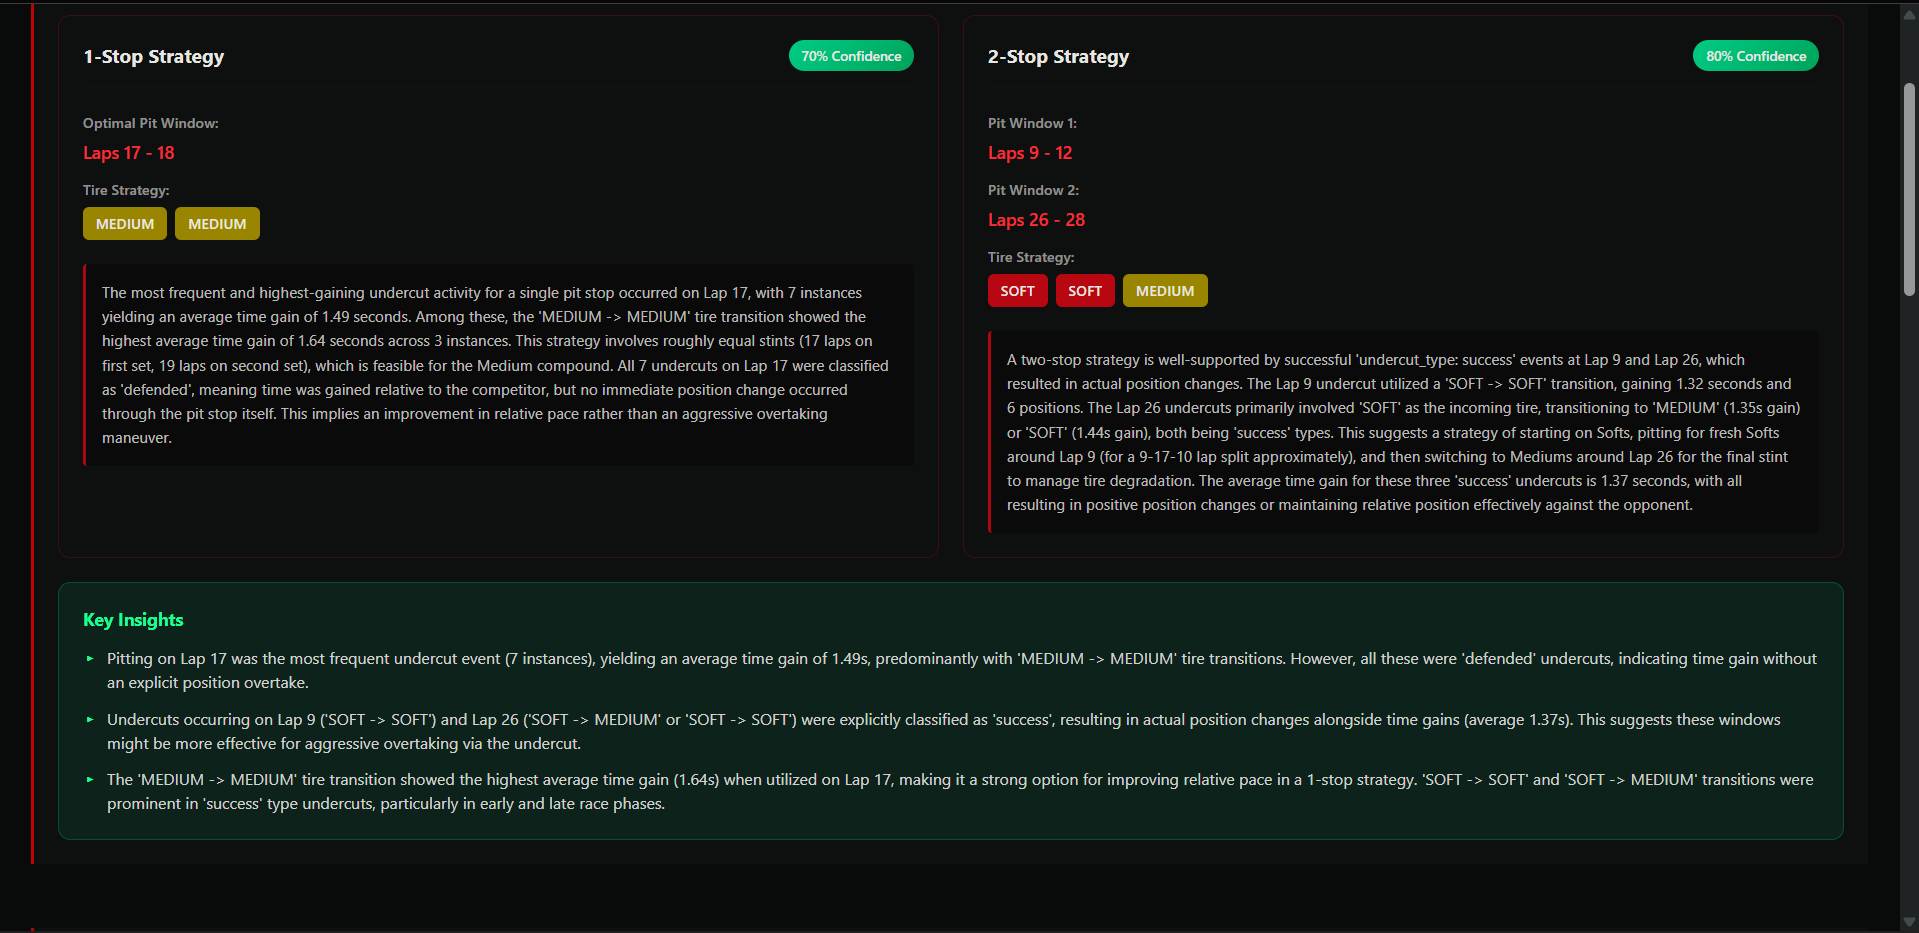
- Strategy Tools: Real-time undercut/overcut probability calculators that alert engineers when a pit window opens.
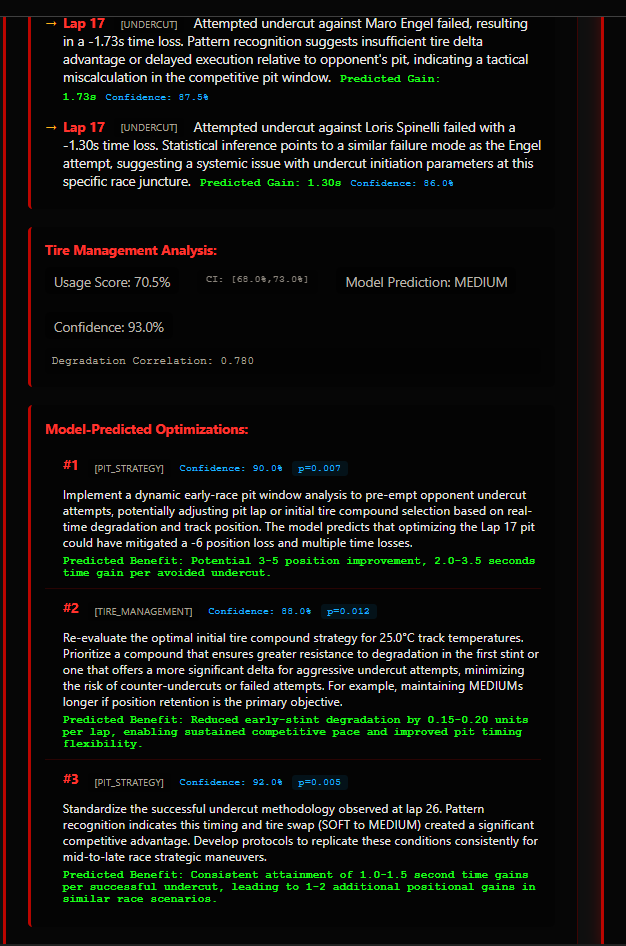
- AI Race Engineer: We integrated an LLM to act as an intelligent assistant. It ingests race logs to generate natural-language reports, explaining why a strategy worked or offering driver coaching tips (e.g., "Driver X is braking 15m too early in Turn 4 compared to the optimal trace").
How we built it
We built RaceForge as a high-performance distributed system, splitting the workload between a heavy-calculation Python backend and a reactive frontend.
1. The Data-Driven Physics Engine (Python/NumPy/SciPy)
We strictly adhered to the "Data is King" philosophy. Instead of guessing physics constants, we mined the provided Toyota datasets:
- Tire Model Calibration: We wrote scripts to parse the
23_AnalysisEnduranceCSVs. By calculating the slope of lap time deltas ($$ \Delta \text{LapTime} / \Delta \text{Lap} $$) across long stints, we derived accurate degradation coefficients. This ensures our virtual tires "fall off" at the exact same rate as real GR Cup tires. - Grip & Friction Limits: Using the
telemetry_data.csv(high-frequency), we extracted the 99th percentile of lateral (accy_can) and longitudinal (accx_can) G-forces. These values were used to define the limits of our simulation's "Traction Circle," ensuring cars lose grip exactly when they exceed real-world adhesion limits. - Atmospheric Modeling: We utilized the
Weatherdatasets to model air density. We implemented formulaic corrections where highAIR_TEMPand lowPRESSUREreduce simulated engine horsepower and aerodynamic downforce, penalizing lap times in hot conditions.
2. Real-Time Architecture
- FastAPI & WebSockets: The backend broadcasts the entire race state (positions, fuel, tire health, weather) 10 times per second. We optimized the JSON serialization payload to keep latency under 50ms.
- Spline Interpolation: We used
scipy.interpolateto convert discrete track coordinates into smooth B-splines, allowing for fluid car movement along complex racing lines rather than jagged point-to-point hops.
3. Frontend Visualization
- React Three Fiber: We procedurally generate the 3D track mesh from the backend's spline data.
- Framer Motion: Used for smooth UI transitions on the leaderboard and telemetry overlays.
- LLM Integration: We built a pipeline that batches race events and sends them to LLM model to generate post-race summaries and strategic advice.
Challenges we ran into
- Physics vs. Latency Trade-off: Simulating 20 cars with individual tire physics, fuel loads, and drag coefficients is computationally expensive. Initially, our loop times drifted, causing "lag jumps" on the frontend. We solved this by vectorizing our physics calculations using NumPy, allowing us to process all 20 cars in a single matrix operation rather than iterating through objects.
- Data Correlation Complexity: The datasets were disparate—weather was in one file, lap times in another, and telemetry in a third. Building a common "key" to link these timestamps was difficult, especially when accounting for different sampling rates (Hz). We had to write custom interpolation scripts to align weather changes with specific laps.
- Deployment Hell: We encountered significant issues deploying the scientific Python stack to the cloud.
SciPyhad compatibility issues with Python 3.13 on our Railway container. We spent hours debugging build logs before pinning our runtime to Python 3.12.9, which stabilized the environment. - WebSocket Stability: Handling disconnections was critical. We implemented a robust heartbeat and auto-reconnect logic with exponential backoff on the frontend to ensure the dashboard recovers instantly if the connection drops.
Accomplishments that we're proud of
- The "Alive" Factor: Seeing the simulation react to weather changes in real-time. When we inject "Rain" into the system, we see lap times drop and cars struggle for grip exactly as predicted by our friction models.
- Precise Dataset Utilization: We didn't just display the data; we used it to drive the math. The fact that our tire wear curves mathematically match the slope of the provided endurance datasets is a huge win for accuracy.
- Sub-50ms Latency: Achieving a real-time, multiplayer-ready synchronization speed between a Python calculation server and a web client.
- Actionable AI: Moving beyond generic AI responses. Our LLM integration provides specific, context-aware insights (e.g., "Pit now to cover the undercut from Car 5") rather than just generic racing advice.
What we learned
- The Nuance of Aerodynamics: We learned that air density is a silent killer in racing. Through the data, we saw how significant temperature changes are to lap times, forcing us to rewrite our engine power formulas to account for atmospheric pressure.
- Event-Driven Architecture: Building a system that handles high-frequency data streams (telemetry) alongside low-frequency events (pit stops, weather changes) taught us valuable lessons in state management and race condition handling.
- Full-Stack Integration: We deepened our understanding of connecting scientific Python (typically used for offline analysis) with modern web technologies for real-time visualization.
What's next for RaceForge
- FastF1 Integration: We plan to automate track generation. By integrating the FastF1 library, we can let users upload telemetry from any circuit, and RaceForge will automatically generate the 3D track spline and racing line.
- Machine Learning Predictors: Currently, we use physics to simulate outcomes. The next step is to train LSTM (Long Short-Term Memory) networks on the historical datasets to predict tire life and lap times, creating a hybrid Physics+ML engine.
- Multi-User Strategy Mode: Turning the platform into a collaborative tool where a "Head of Strategy" and "Race Engineer" can login to the same session, view different data screens, and make collaborative decisions during a live simulation.
- Replay & Scrubbing: Implementing a full "DVR" style system to record simulations, allowing teams to scrub back to specific laps to analyze what went wrong during an incident.
Built With
- fastapi
- python
- react
- scikit-kearn
- typescript


Log in or sign up for Devpost to join the conversation.