-
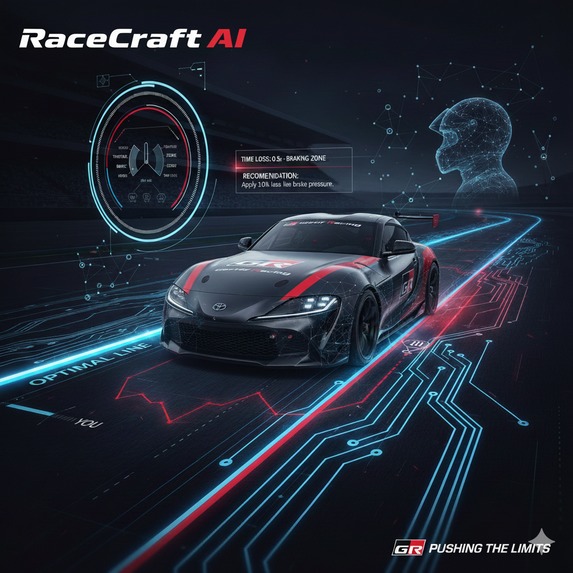
RaceCraftAI
Inspiration
💡 Project Story: RaceCraft AI: Personalized Driver Skill Twin 🌟
The Project Context and Inspiration
This project, RaceCraft AI, was developed in response to a technical requirement to extract actionable insights from provided driver data, specifically within the context of the Toyota GR Hack. The goal was not to revolutionize professional motorsports, but to build a functional, relevant system that could help individual drivers interpret their own performance.
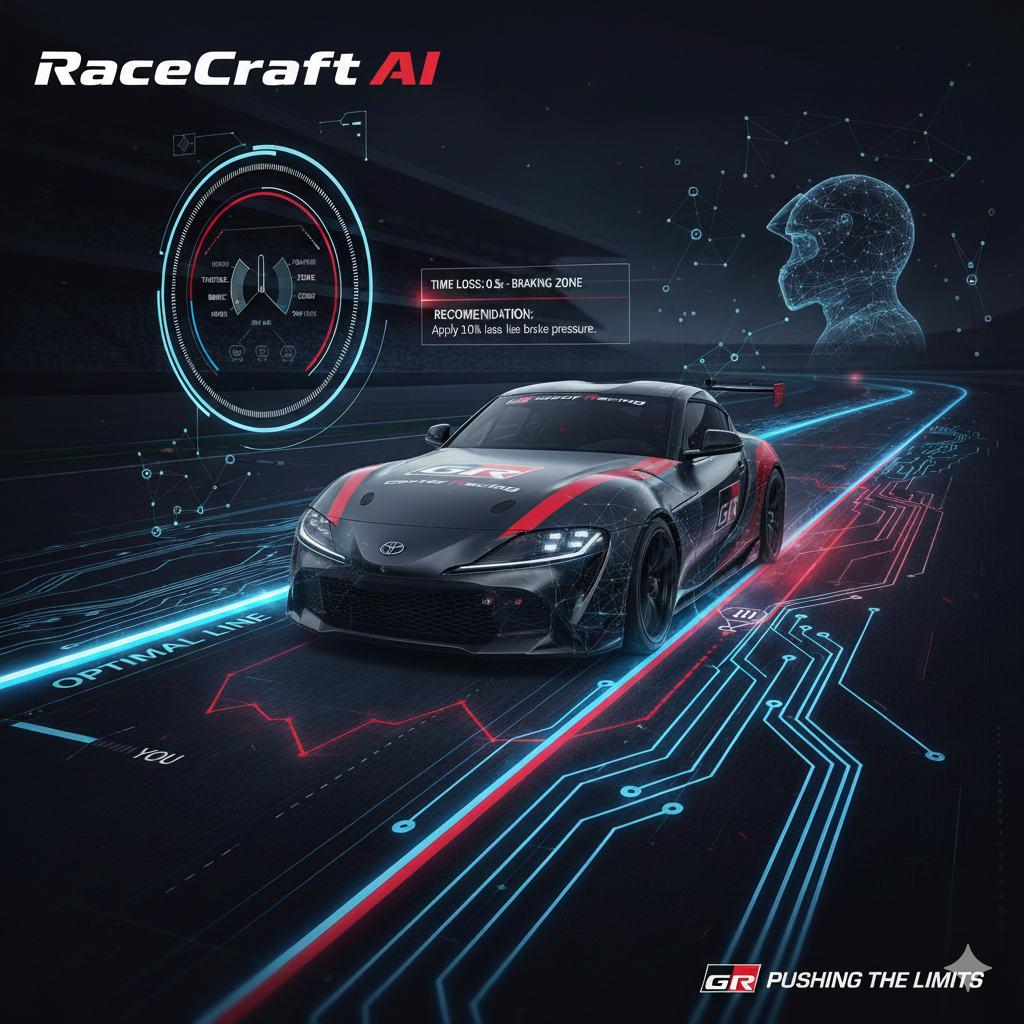
The fundamental concept was to establish an AI "digital twin" for a driver by analyzing their behavior and generating precise, moment-by-moment feedback. This feedback is based on a direct comparison to patterns of optimal performance derived from top-tier laps recorded under similar environmental conditions (weather, track state). The project’s value lies in its ability to translate raw data into clear, targeted coaching points for improvement.
🏗️ Technical Architecture and Development
The system was constructed as a Fullstack application, integrating data analysis, modeling, and visualization components.
1. Data Processing and Modeling Layer
Data Ingestion: Python Pandas was used for cleaning, transformation, and aligning the high-frequency telemetry data (throttle, brake, gear), sector analysis results, and weather logs.
Optimal Performance Baseline: The baseline for optimal performance was derived not from a single lap, but by statistically analyzing and aggregating the key input parameters from the Best 10 Laps in the dataset under matching conditions. This aggregated data served as the target for our models.
Machine Learning Model: A Scikit-learn framework was utilized to train a regression model. This model's primary function is to quantify the deviation of the driver's current input profile (at a specific track location) from the established optimal profile. A secondary classification mechanism was implemented to profile the driver's general style (e.g., aggressive vs. conservative) based on their average input distribution.
2. Fullstack Implementation
Backend: FastAPI was chosen for the API layer to manage requests and host the trained model. The backend's critical function is executing the data-intensive comparison routines to identify the exact braking zones, corner apexes, and exits where the largest time loss occurs.
Frontend: The user interface was built with React. The core data visualization, including the 2D/3D track rendering and the lap overlays, was managed using the Three.js library to display an interactive comparison between the "You vs. Optimal Line."
📚 Technical Learnings
Through the development of this project, I gained practical experience in several core technical areas:
Time-Series Data Management: Handling and synchronizing high-frequency telemetry data streams with discrete track geometry points, ensuring accurate spatial and temporal alignment for per-sector analysis.
Applied Regression: Utilizing model outputs to generate actionable advice rather than simple predictions. This involved translating statistical deviations into precise recommendations (e.g., "Brake 5 meters earlier").
Client-Side 3D Rendering: Implementing dynamic 3D track visualizations using Three.js, which required managing large data payloads and optimizing rendering performance for smooth user interaction.
🚧 Challenges and Technical Solutions
Challenge 1: Establishing a Stable Optimal Benchmark
A single "best lap" is often subject to transient factors like minor track evolution or a brief slip. Relying on one lap would create an unstable, unrealistic benchmark.
Solution: To create a robust target, the optimal line was calculated as a weighted average of inputs ($I$) across the top $N$ laps ($N=10$). This approach accounts for performance consistency and minimizes the impact of outliers. The calculation for the weighted optimal input at any given point was:
$$ I_{\text{optimal}} = \frac{1}{\sum w_i} \sum_{i=1}^{N} (w_i \cdot I_i) $$
Where $w_i$ represents a weighting factor based on the consistency of the lap time.
Challenge 2: Client-Side Data Visualization Performance
The volume of telemetry data needed to render a smooth 3D track path was significant, leading to severe latency when transmitted directly to the frontend.
Solution: I implemented a data decimation and compression pipeline on the FastAPI backend. Only the most critical, highly optimized data points were transmitted to the React application. The client-side Three.js visualization then used interpolation algorithms to reconstruct the smooth path, preserving visual accuracy while drastically reducing payload size and improving application responsiveness.