-
-
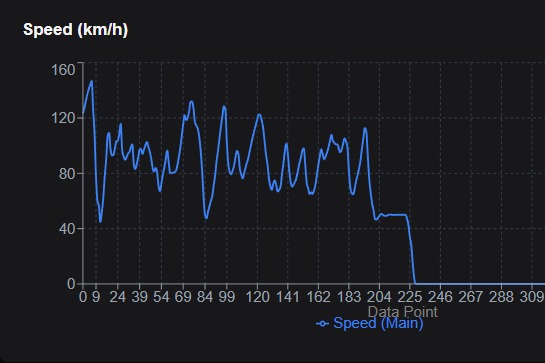
The Speed Analysis Chart
-
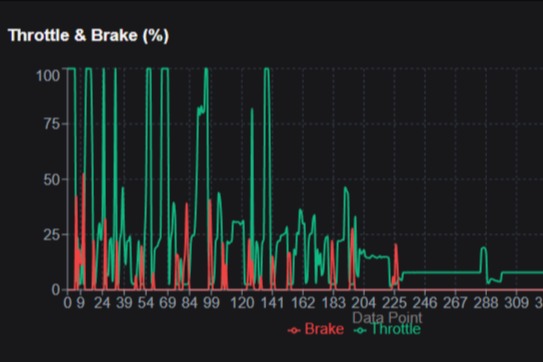
Throttle & Brake Analysis Chart
-
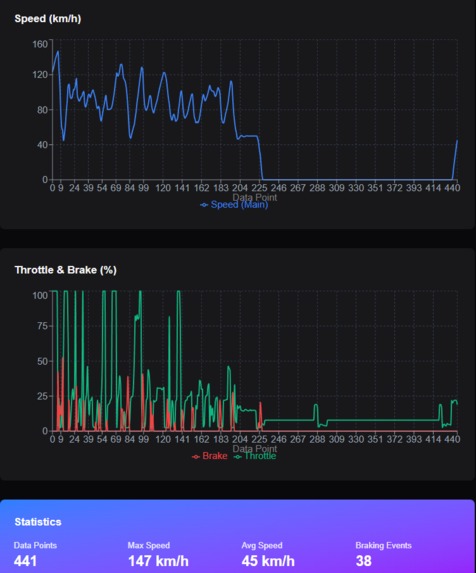
All charts and Statistics
-
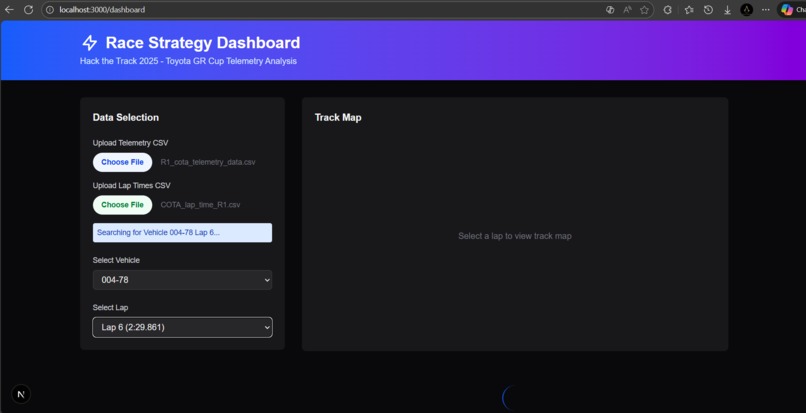
Dashboard


Inspiration
The Toyota GR Cup racing series generates massive amounts of telemetry data, but analyzing it requires expensive proprietary tools. We wanted to create an accessible, web-based solution that helps racers and teams gain competitive insights from their data.
What it does
Race Strategy Dashboard is an interactive web application that visualizes real-time telemetry data from Toyota GR Cup races. It displays:
- Speed, throttle, and brake position charts synchronized across lap data
- GPS-based track map visualization showing vehicle position
- Lap-by-lap performance comparison
- Support for multiple vehicles with side-by-side analysis
Users upload CSV files containing lap times and telemetry data, then select vehicles and laps to instantly visualize performance metrics.
How we built it
We built the dashboard using Next.js 14 with TypeScript and implemented Clean Architecture principles:
- Frontend: React components with Recharts for data visualization
- Data Processing: Custom CSV parsers handling COTA dataset's unique "long format" structure
- Architecture: Domain-driven design with entities, repositories, and use cases
- Incremental Loading: Pagination system loading 1000 rows at a time for large telemetry files
Challenges we ran into
The biggest challenge was parsing the COTA telemetry CSV format:
- The data is in "long format" where each row represents a single metric, not a complete frame
- We had to pivot/group rows by timestamp to reconstruct telemetry frames
- The lap time CSV had multiple rows per lap with unreliable duration values
- Solution: Calculate lap start times from previous lap timestamps to create proper time windows
Accomplishments that we're proud of
- Successfully parsing and displaying real COTA race data with no mock/fake data
- Implementing incremental loading for multi-million row CSV files
- Creating a clean, modern UI that makes complex data accessible
- Building a scalable architecture that can extend to other racing series
What we learned
- Advanced CSV parsing techniques for non-standard data formats
- Performance optimization for large dataset visualization in the browser
- Clean Architecture patterns applied to frontend applications
- Real-world motorsports data challenges and solutions
What's next for Race Strategy Dashboard
- Add lap-to-lap comparison overlays
- Implement data export and report generation
- Support for additional telemetry metrics (tire temperature, fuel consumption)
- Real-time data streaming during live races
- AI-powered insights and race strategy recommendations
Built With
- next.js
- papaparse
- react
- recharts
- tailwind-css
- typescript

Log in or sign up for Devpost to join the conversation.