Smart Urban Traffic Solutions
Team QWERTY 2.0
Artem Dolhiy & Diana Shakhova
Industry 4.0
Project Overview
Urban centers like Toronto face escalating traffic congestion, impacting daily commutes, public safety, and the environment. Our project leverages real-world traffic data (2020–2029) from Toronto to analyze congestion patterns and develop data-driven, actionable recommendations. We aimed to transform Toronto’s transportation network into a smarter, more efficient, and environmentally friendly system.
Problem Statement
As outlined in the University Competition Mission Brief :contentReference[oaicite:0]{index=0}, our challenge was to address urban congestion by:
- Analyzing traffic patterns: Identifying peak congestion times and bottleneck locations.
- Optimizing transit systems: Proposing improvements such as retimed traffic signals, enhanced bus routes, and alternative solutions to reduce delays.
- Enhancing sustainability and safety: Developing recommendations that lower emissions and improve pedestrian and cyclist safety.
Our Approach
1. Data Exploration & Analysis
- Dataset Processing: We cleaned and processed a comprehensive dataset covering Toronto traffic volumes, intersection counts, and time-based trends.
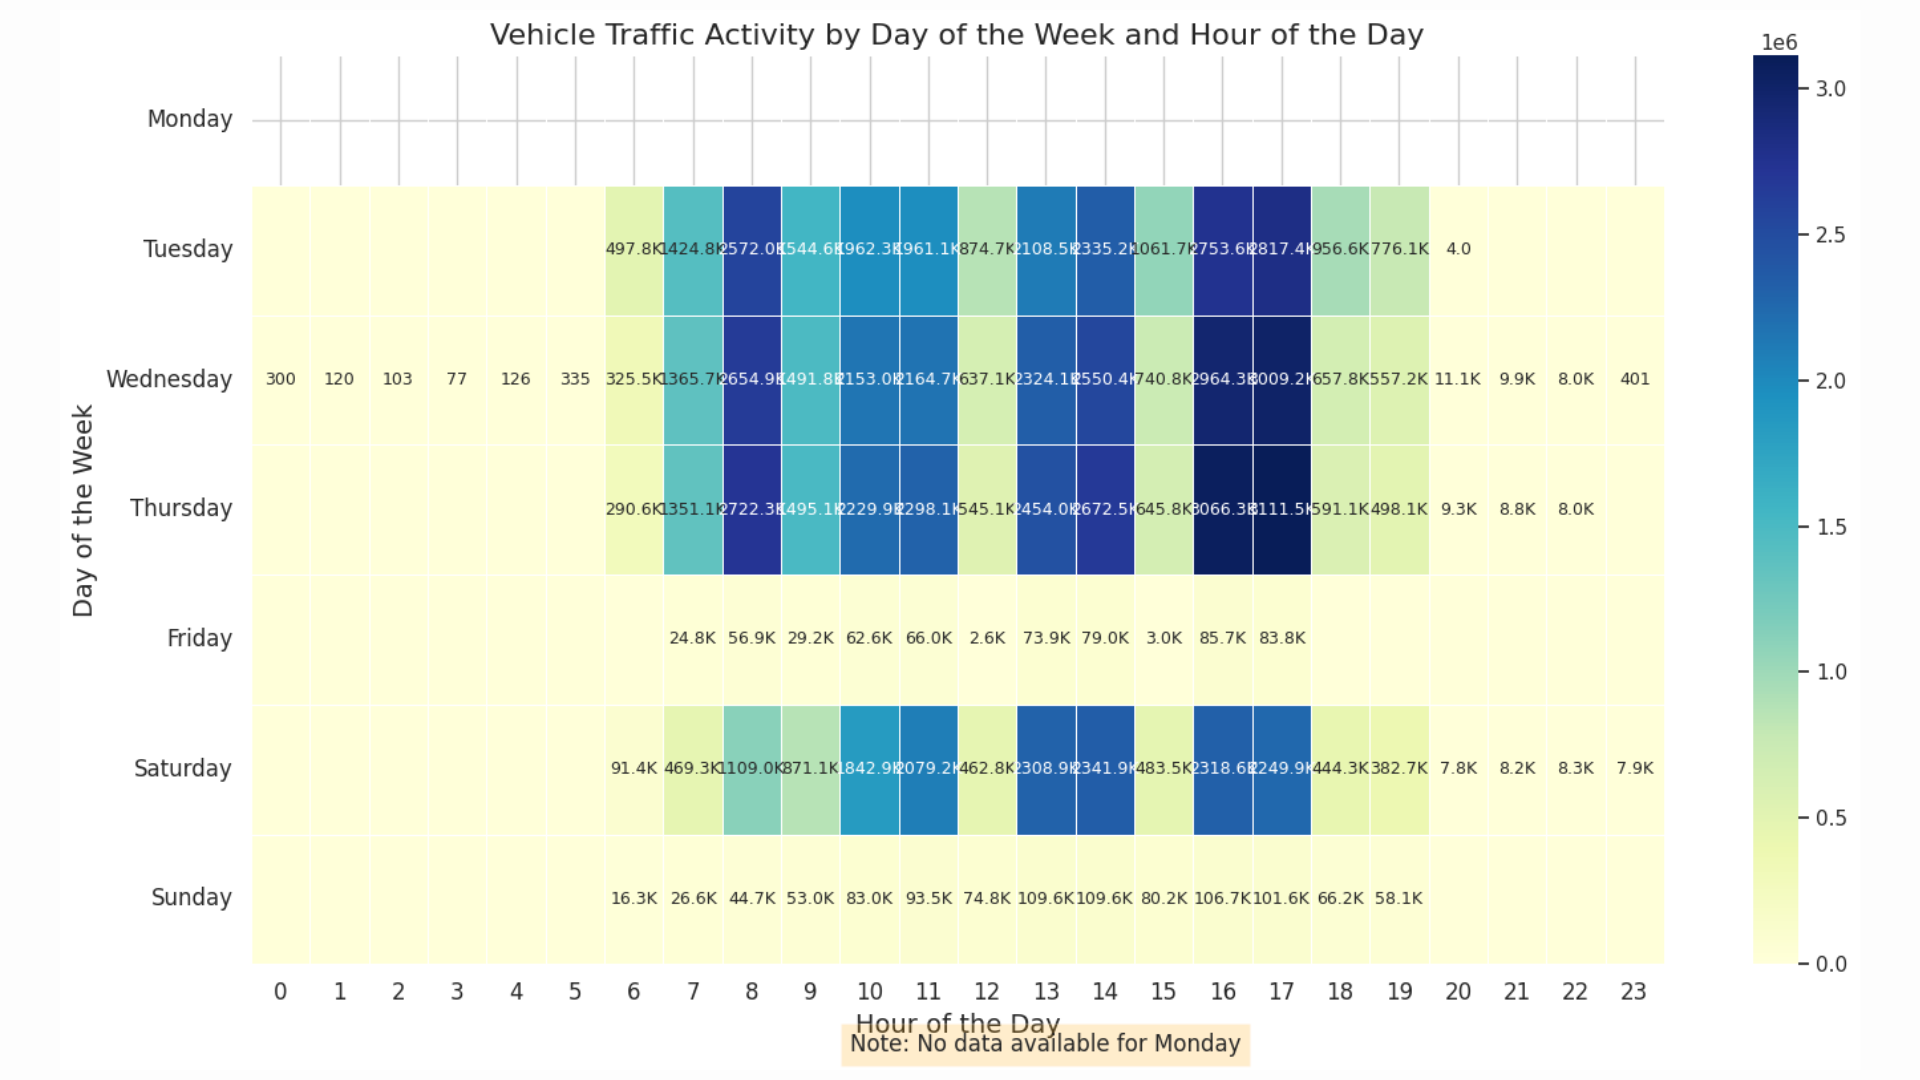
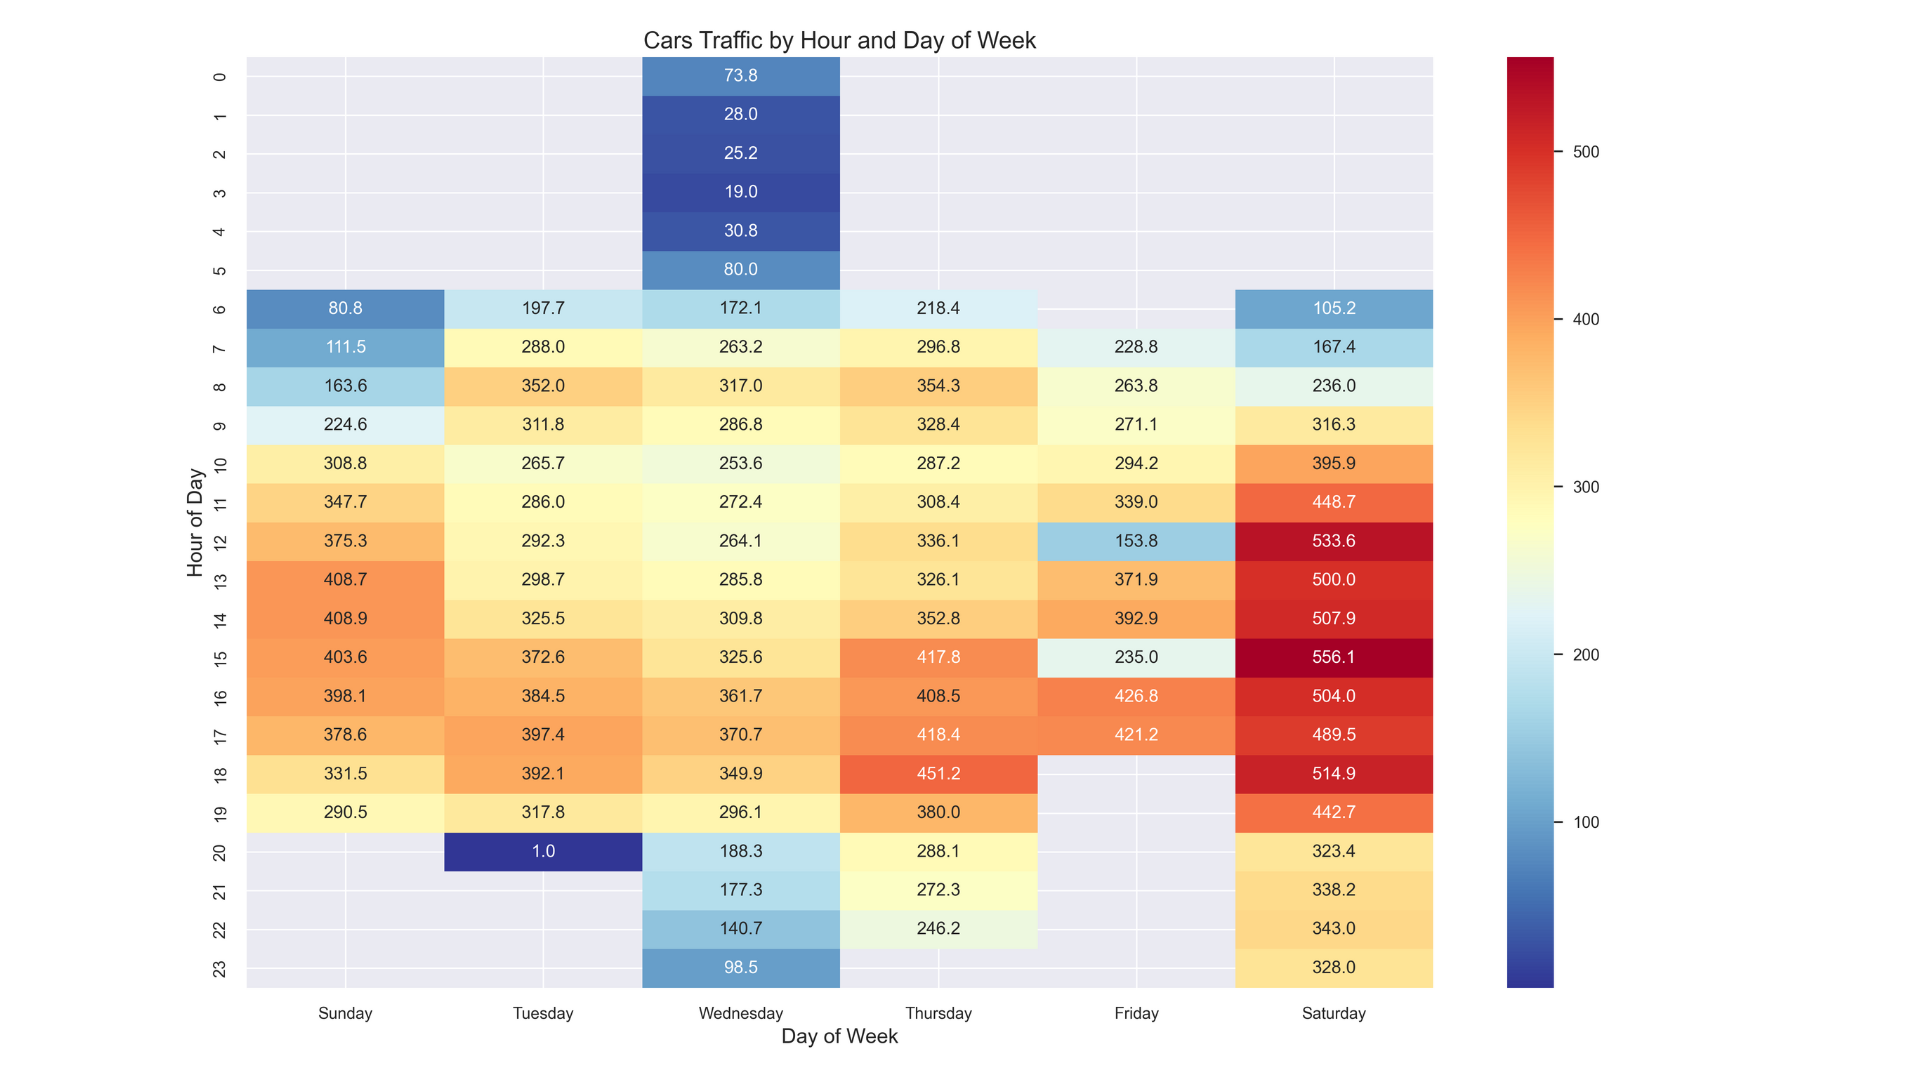
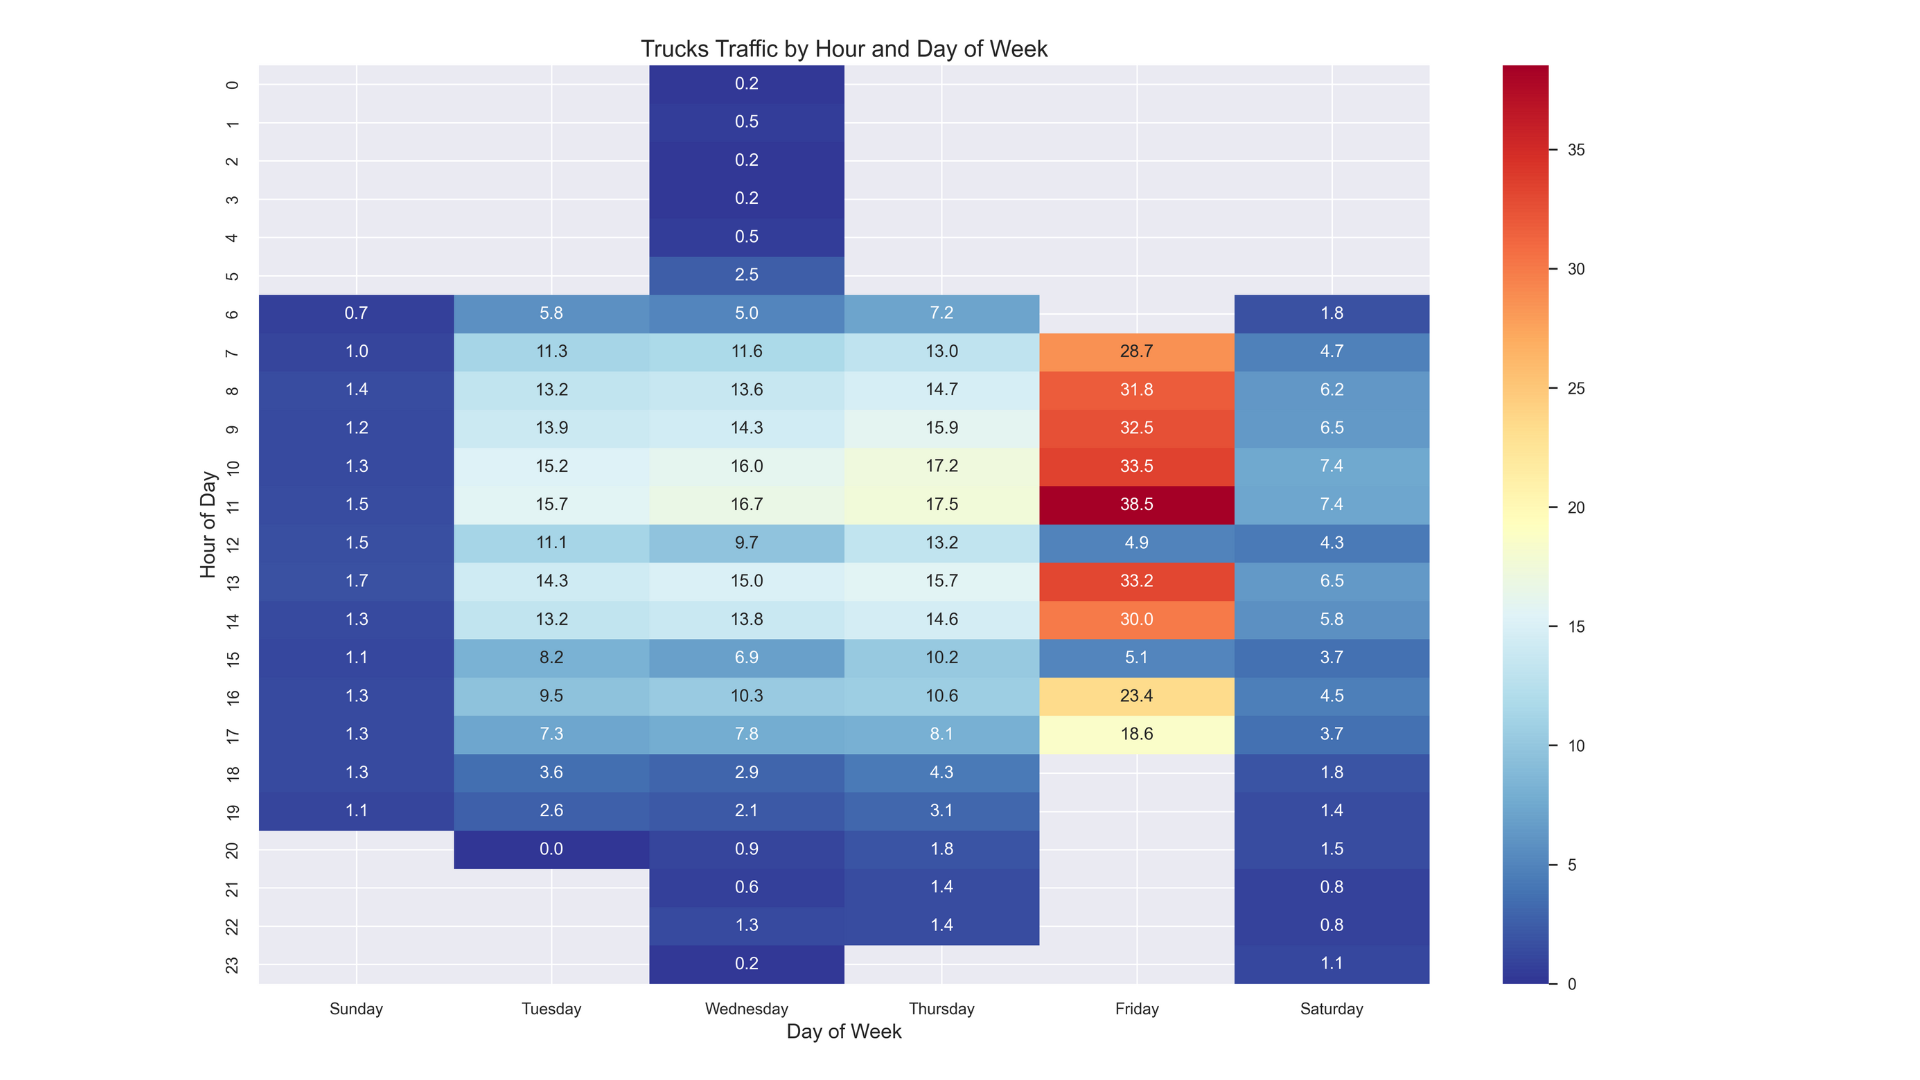
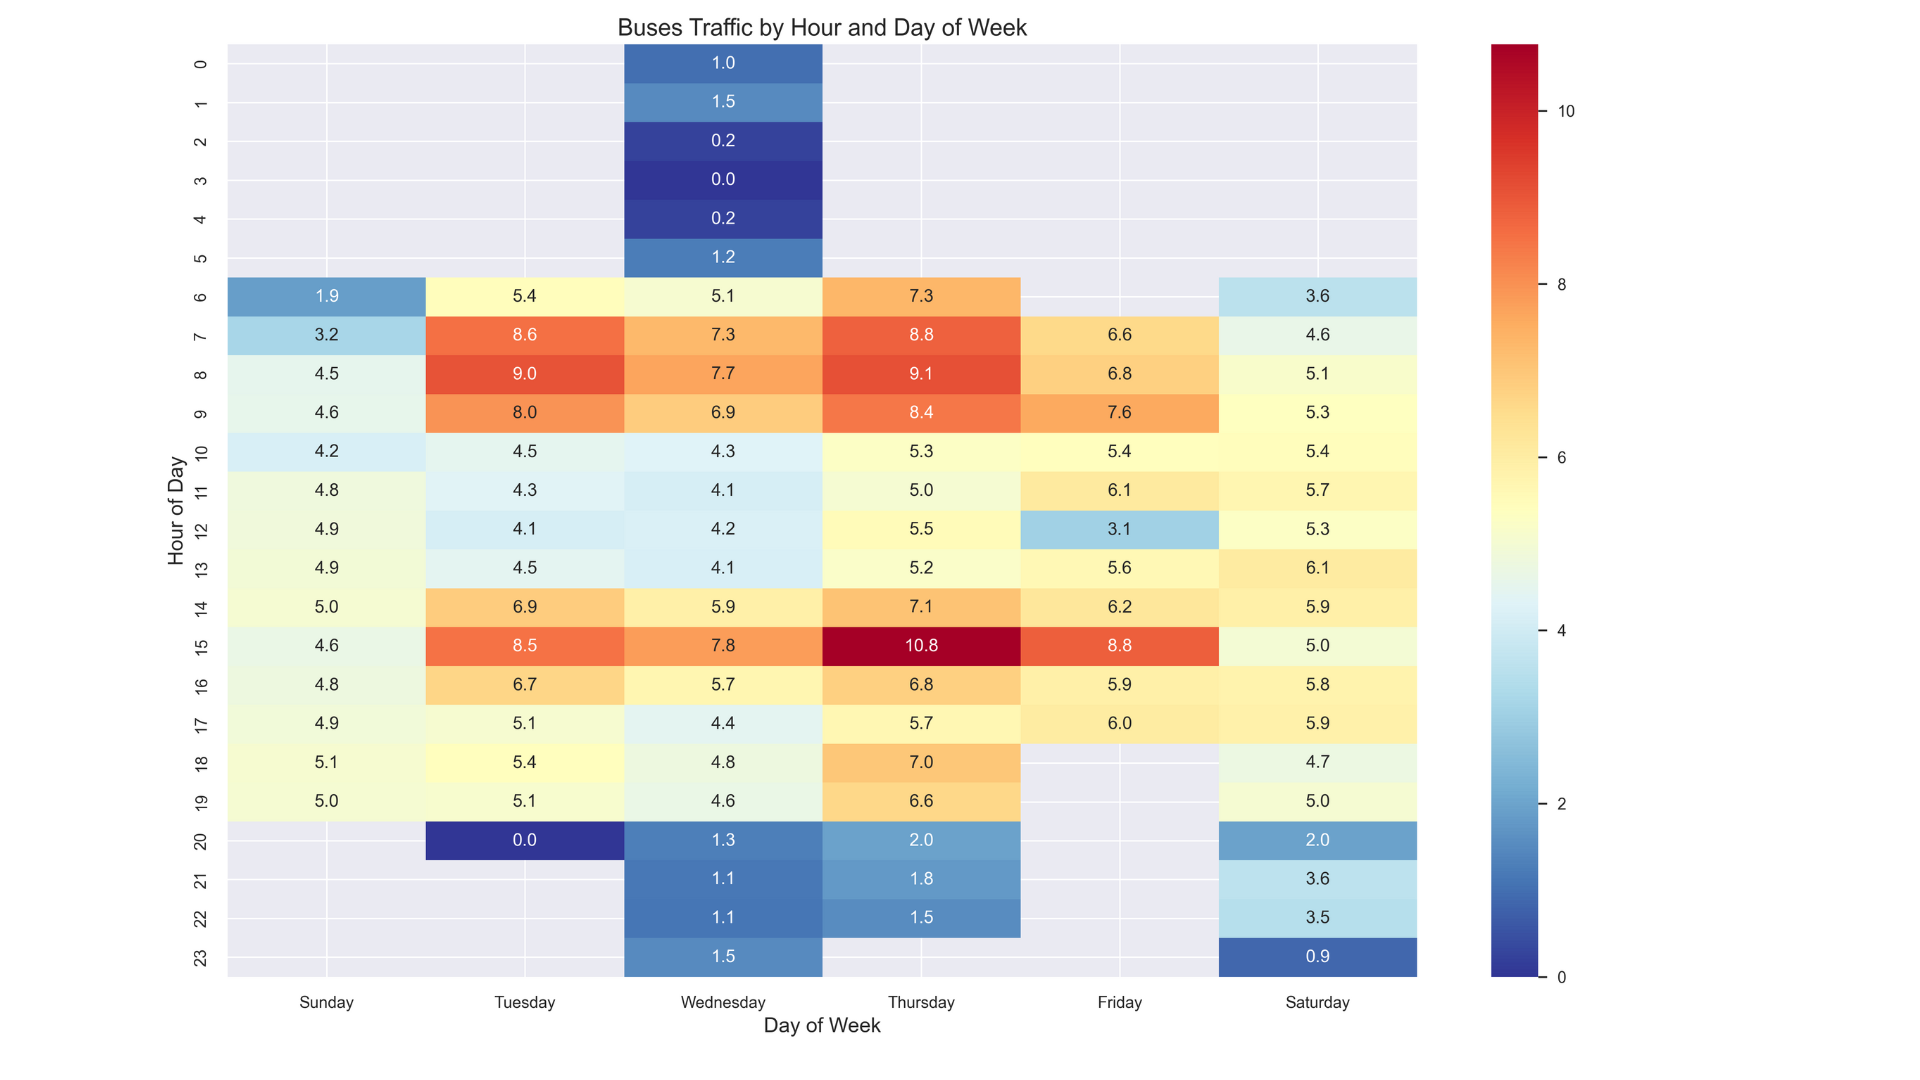
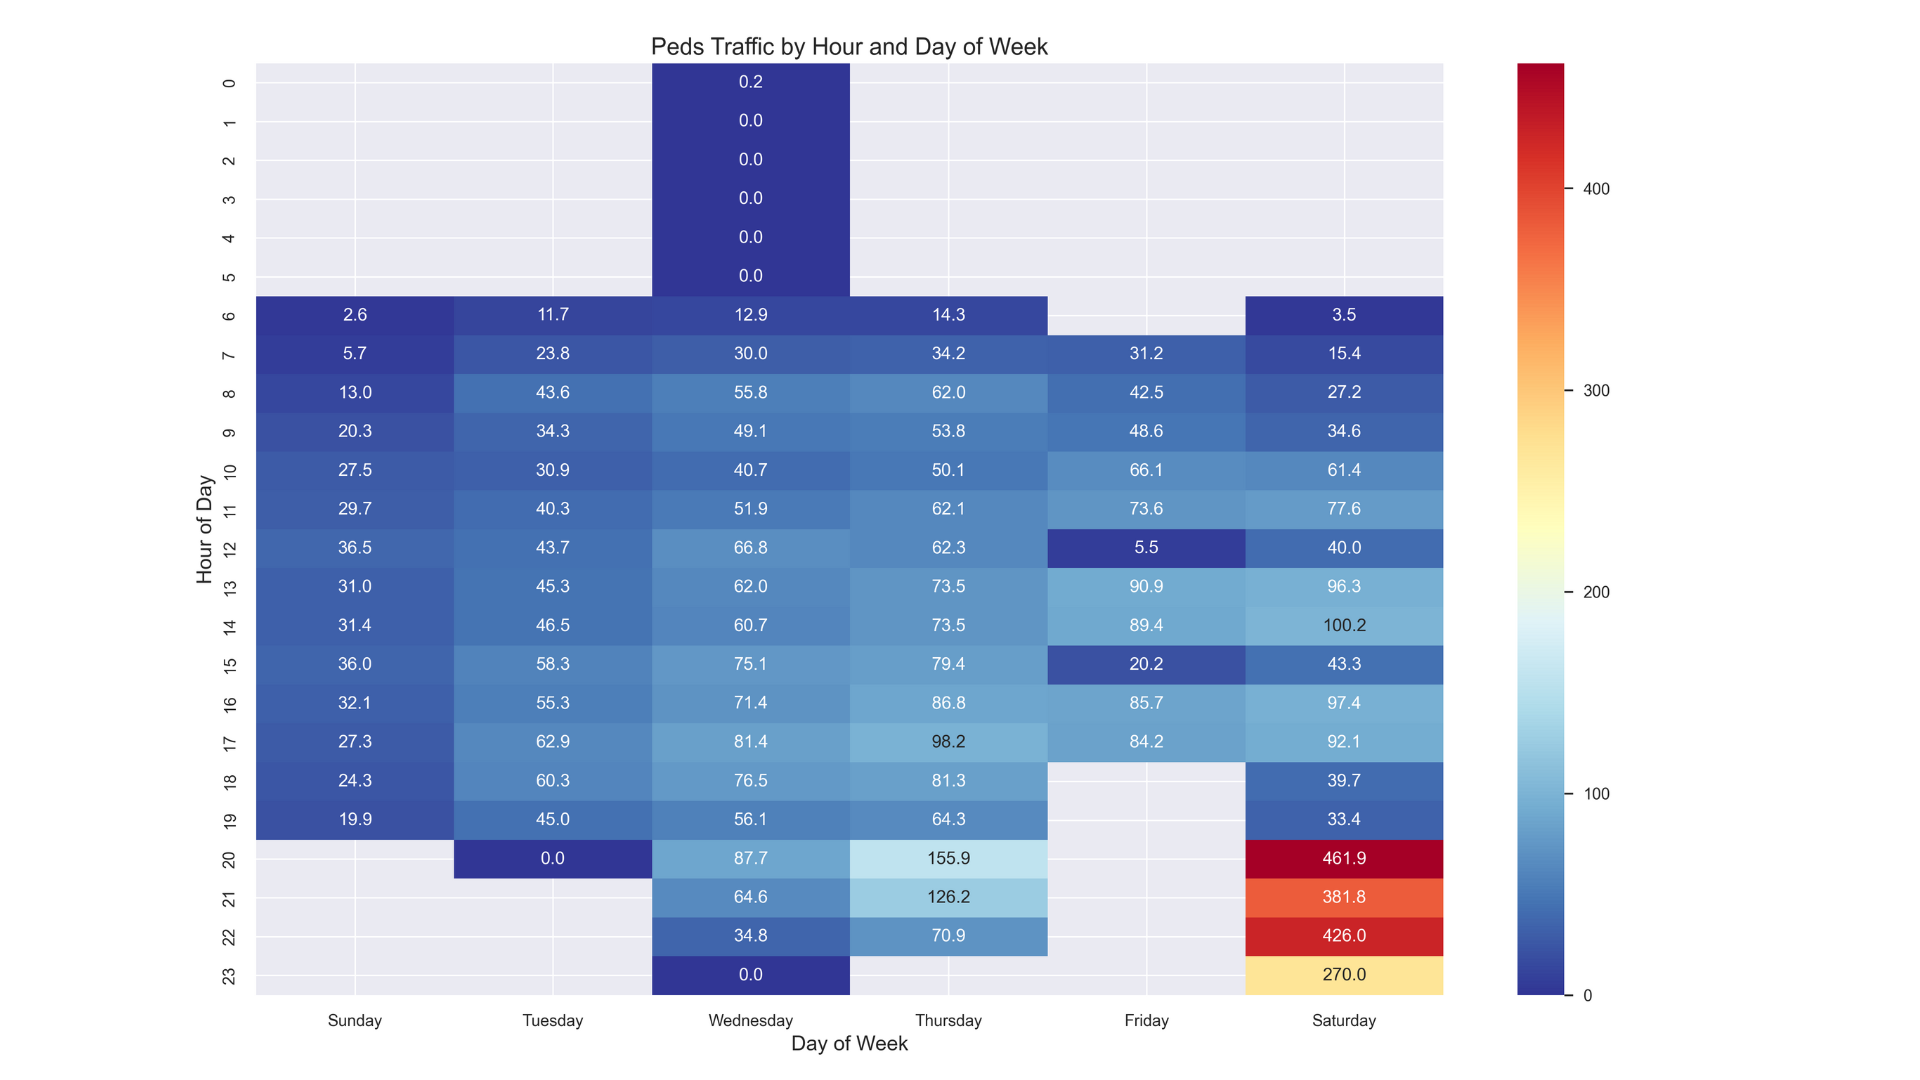
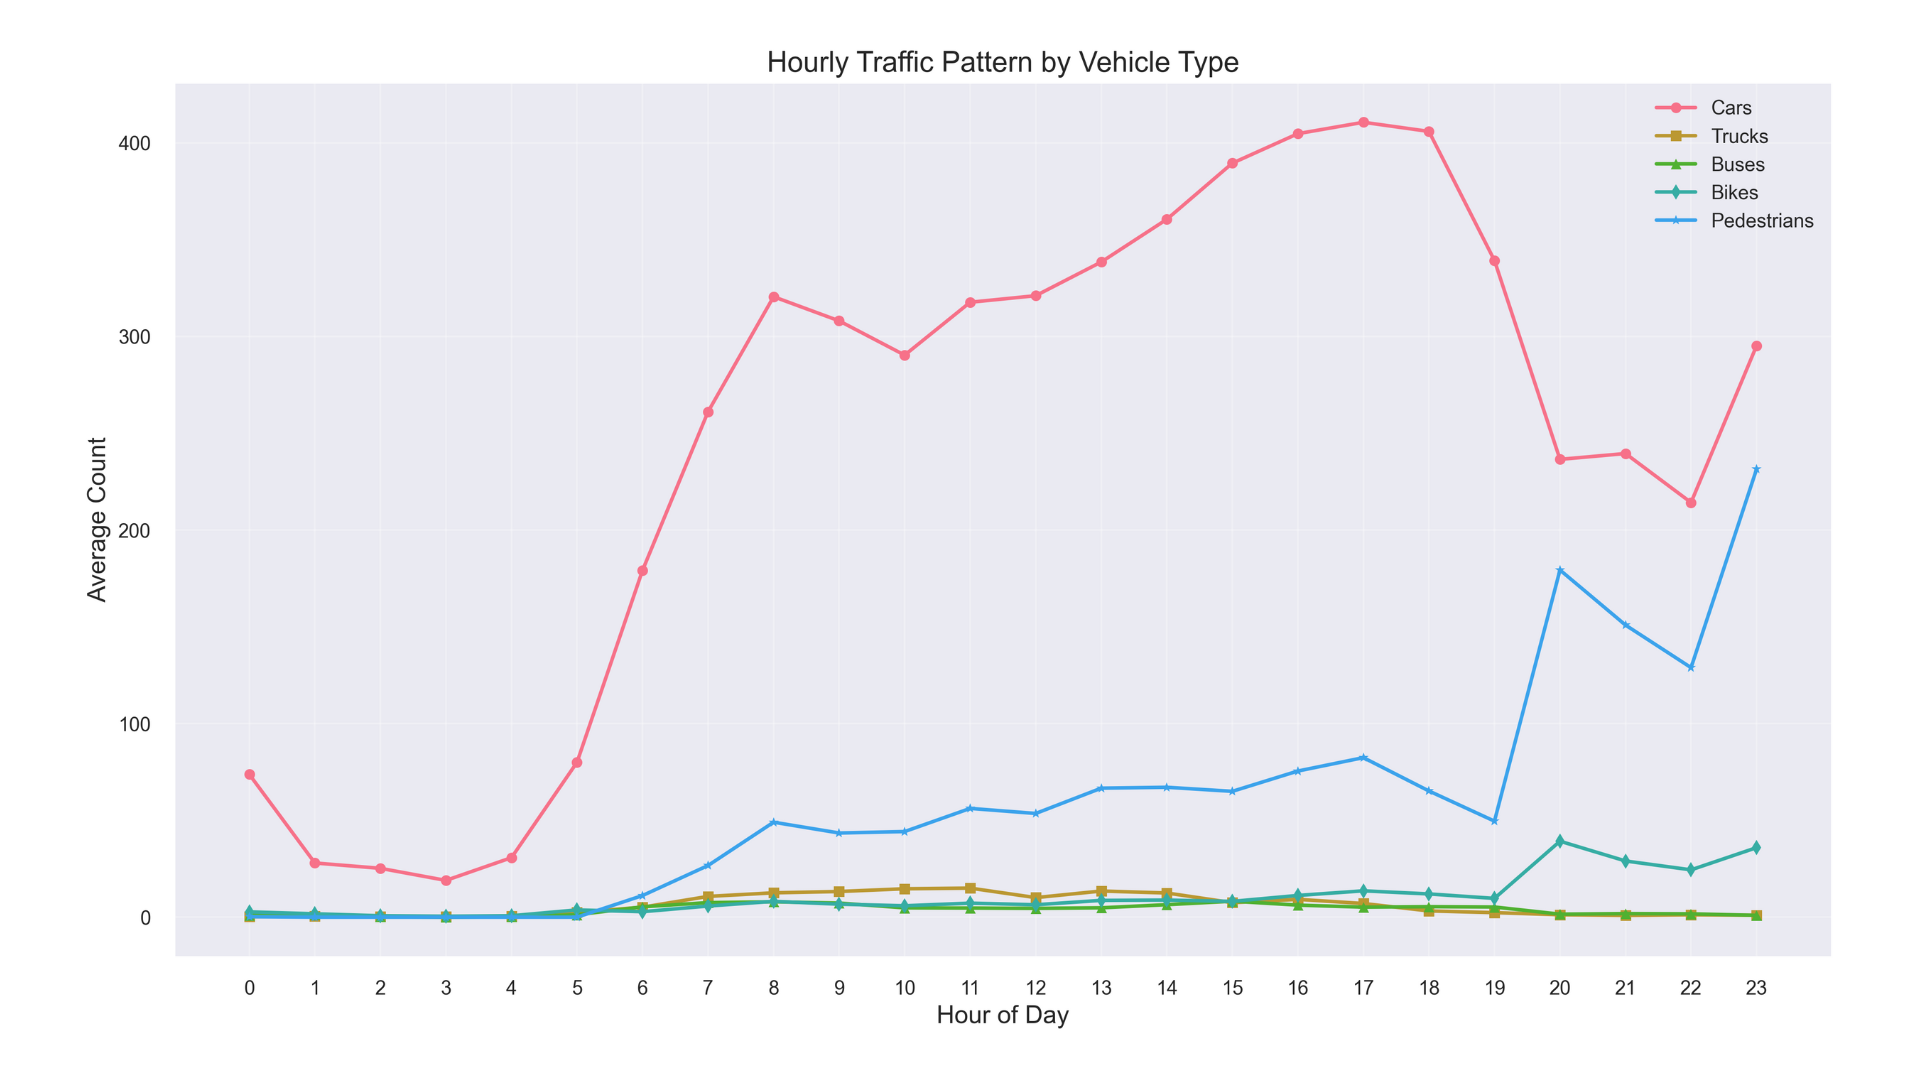
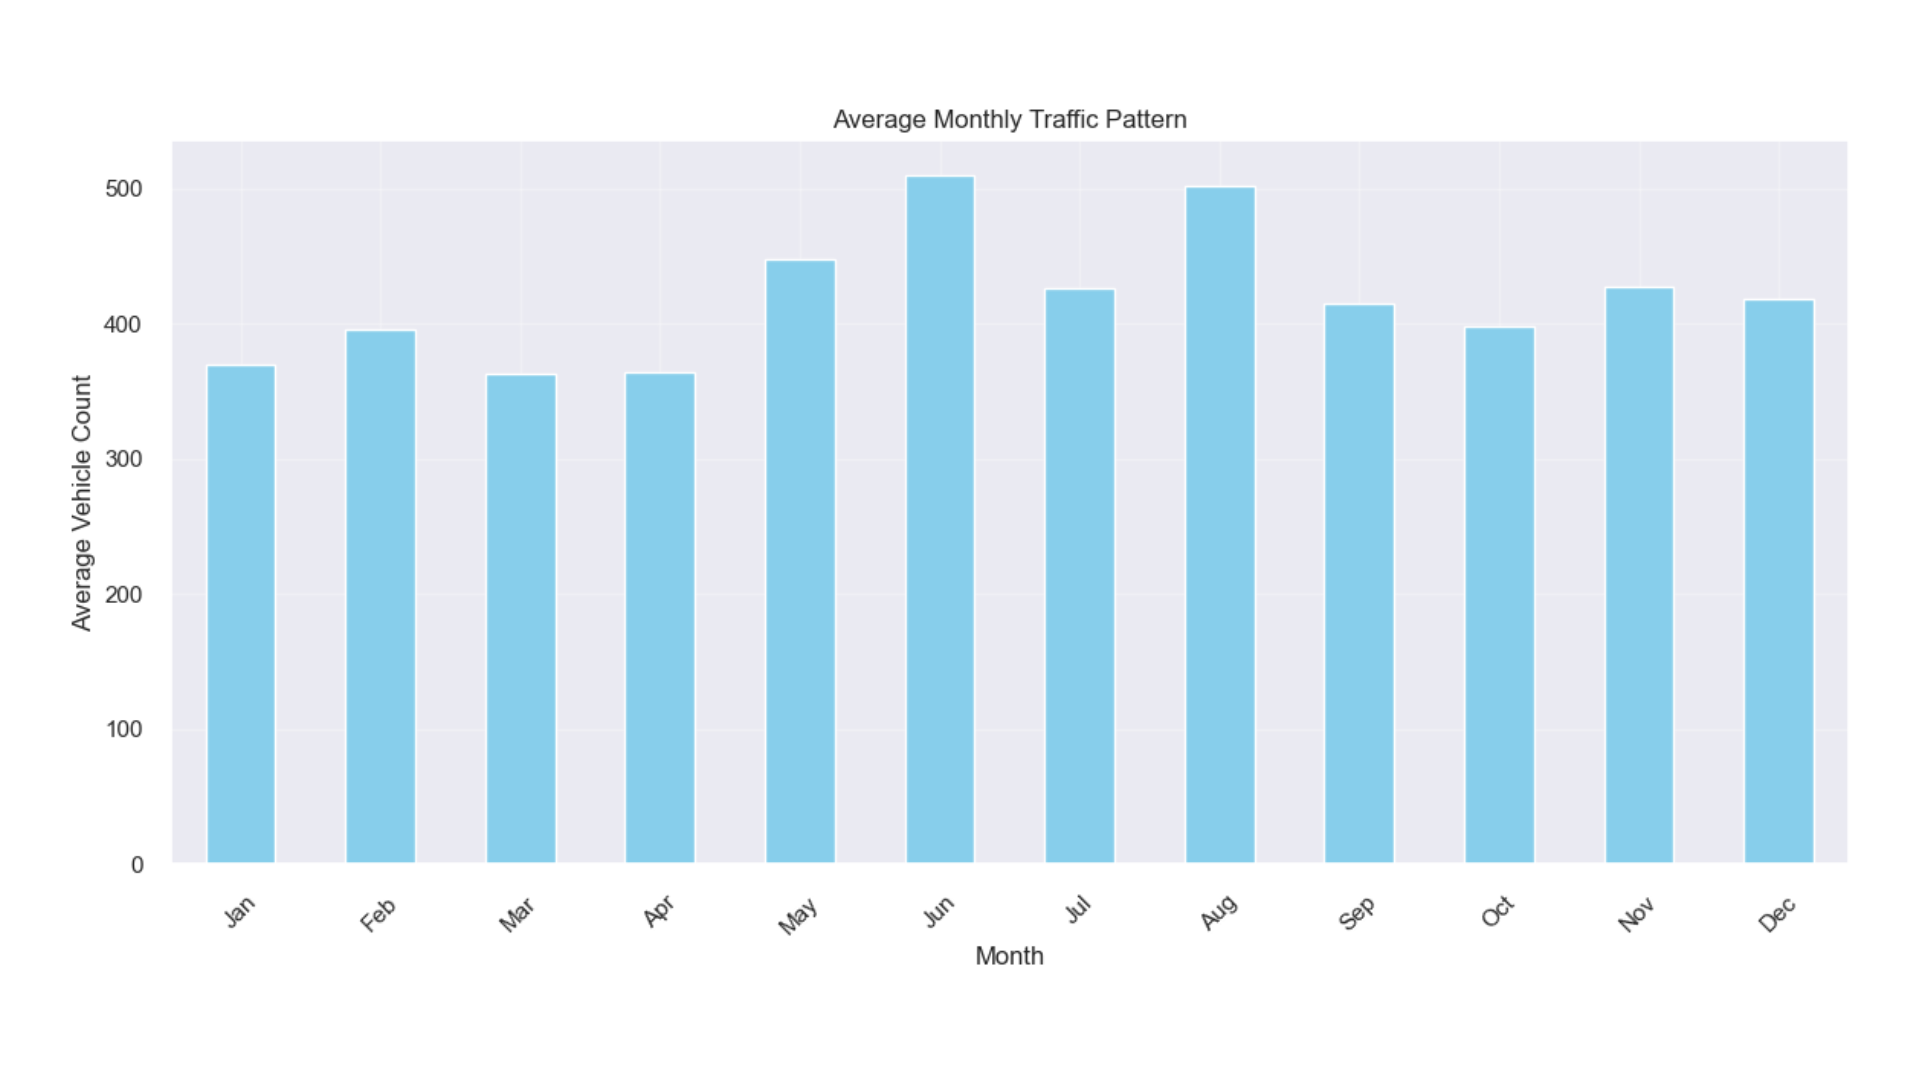
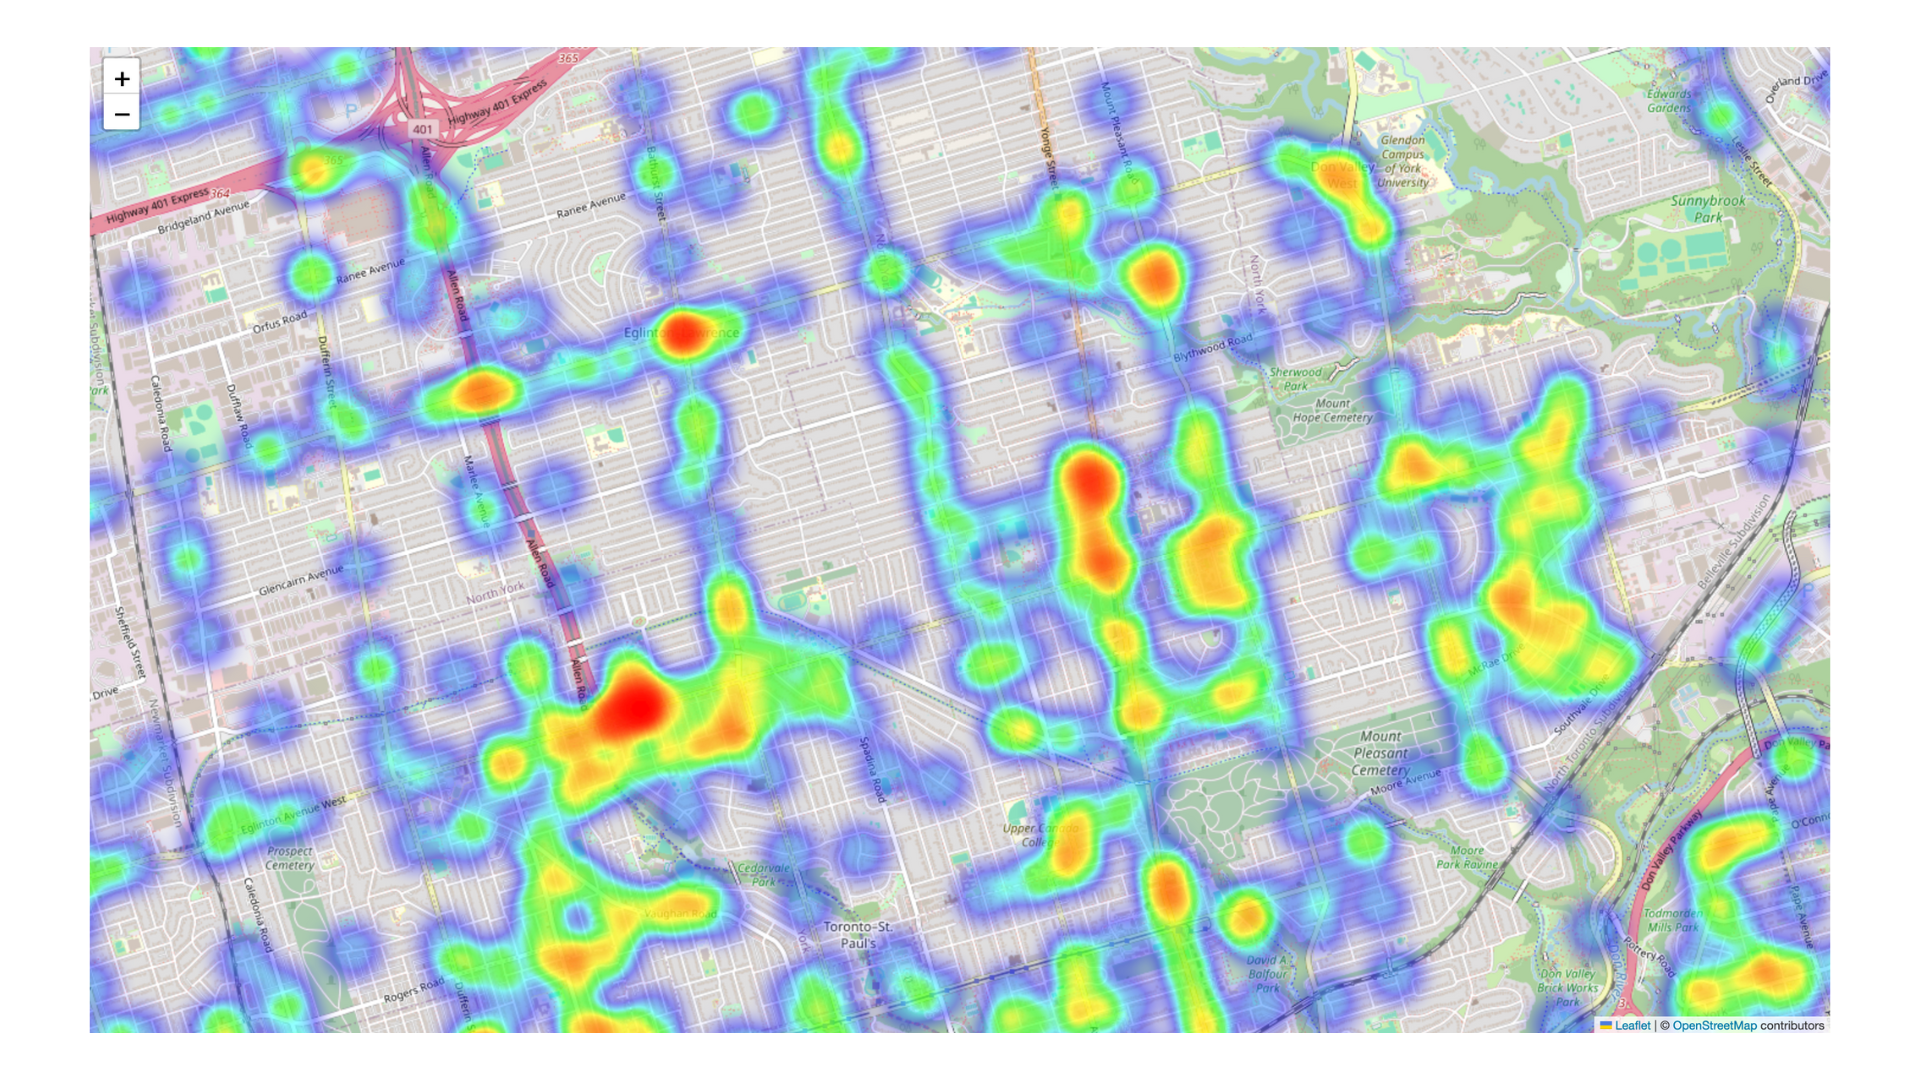
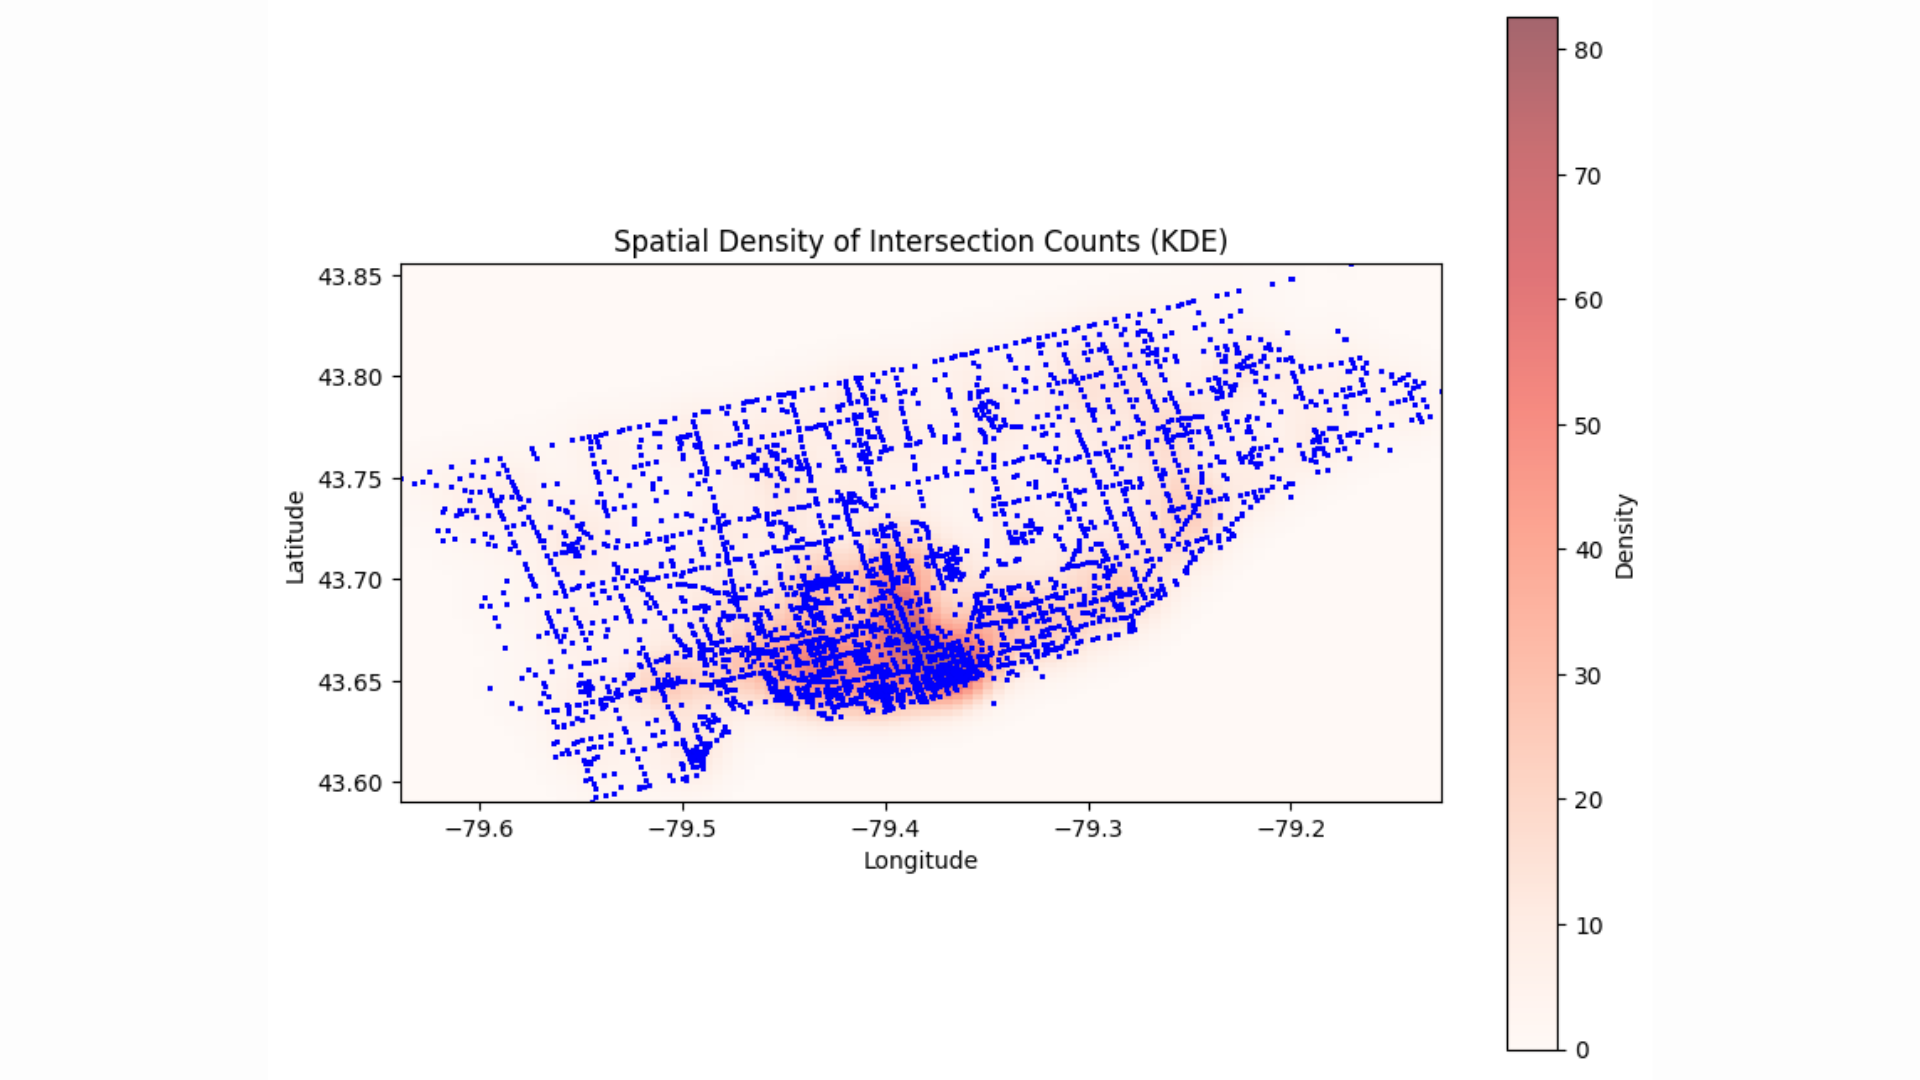
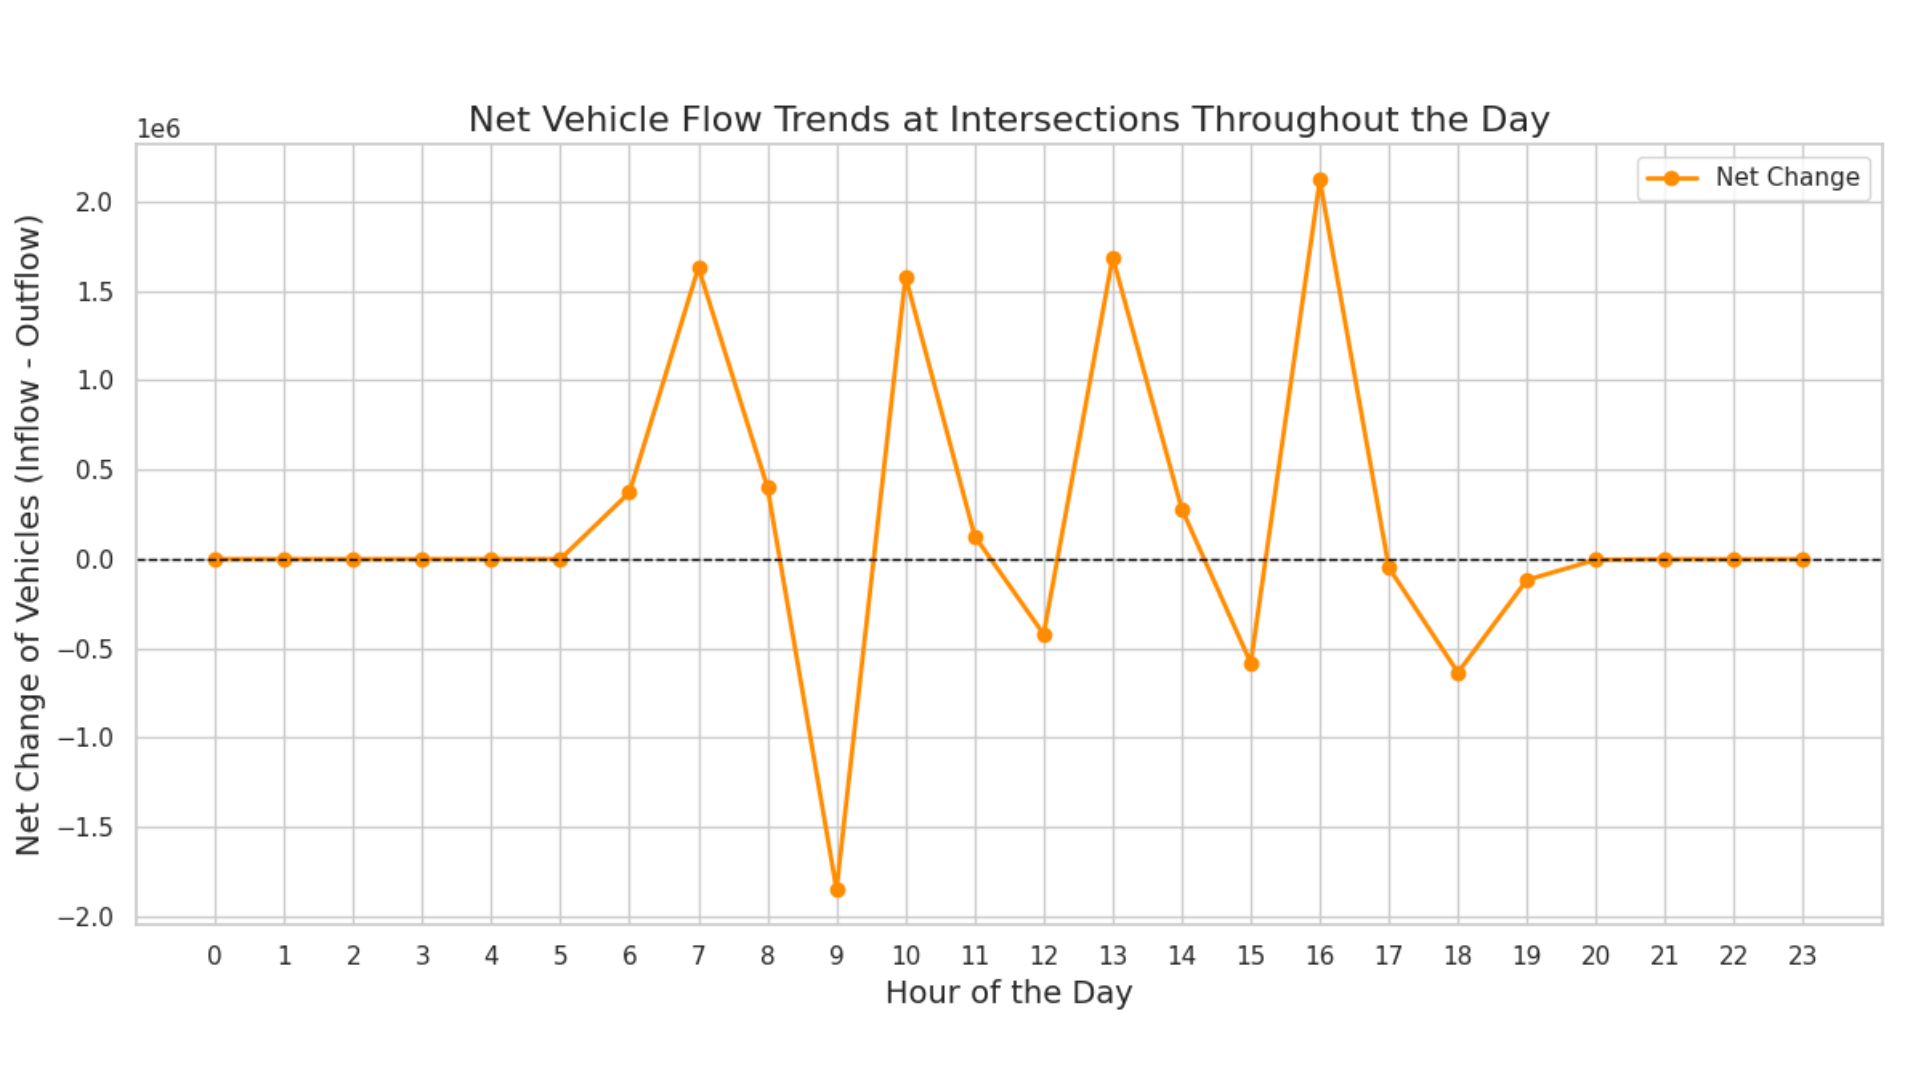
- Time-Series & Spatial Analysis: Using Python libraries (Pandas and Matplotlib), we analyzed the data to identify rush-hour peaks (7–9 AM and 4–6 PM) and pinpointed high-congestion areas across the city.
2. Data Visualization
We developed a suite of visualizations to uncover and communicate key insights:
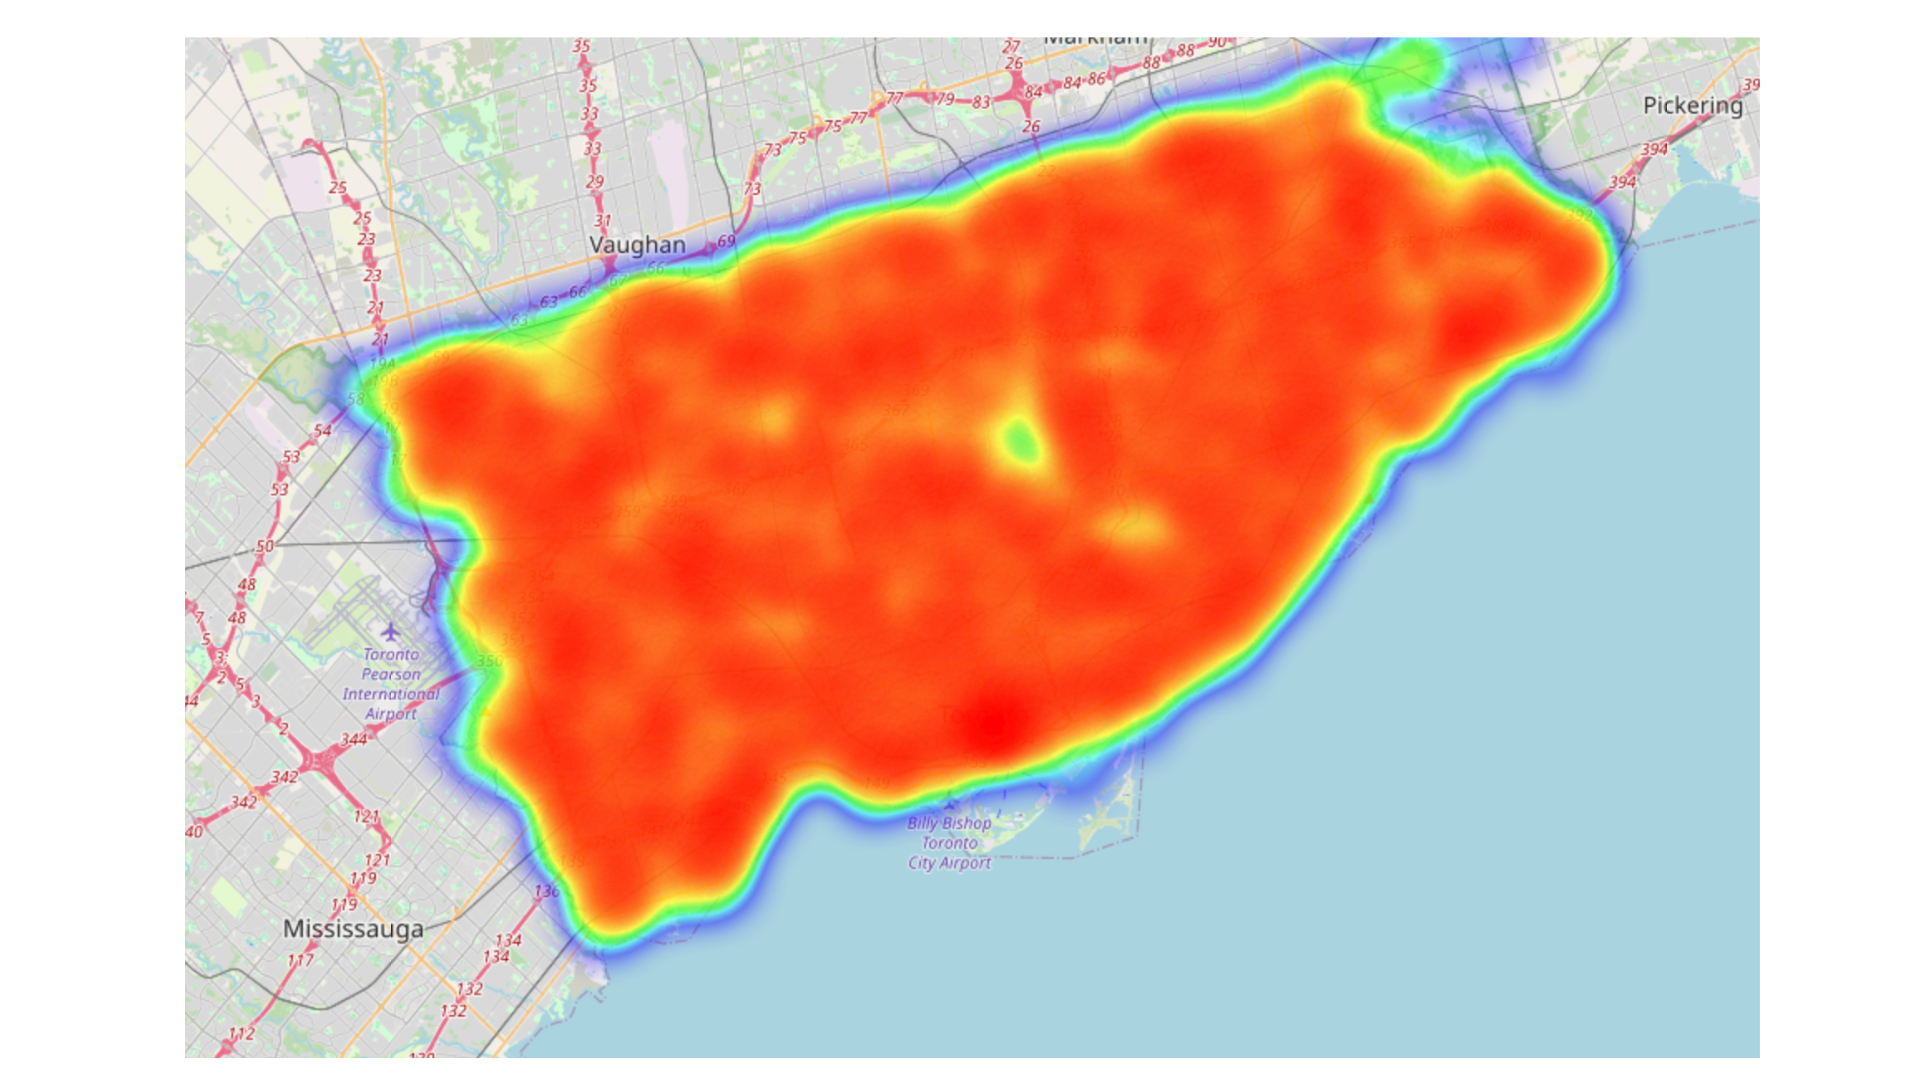
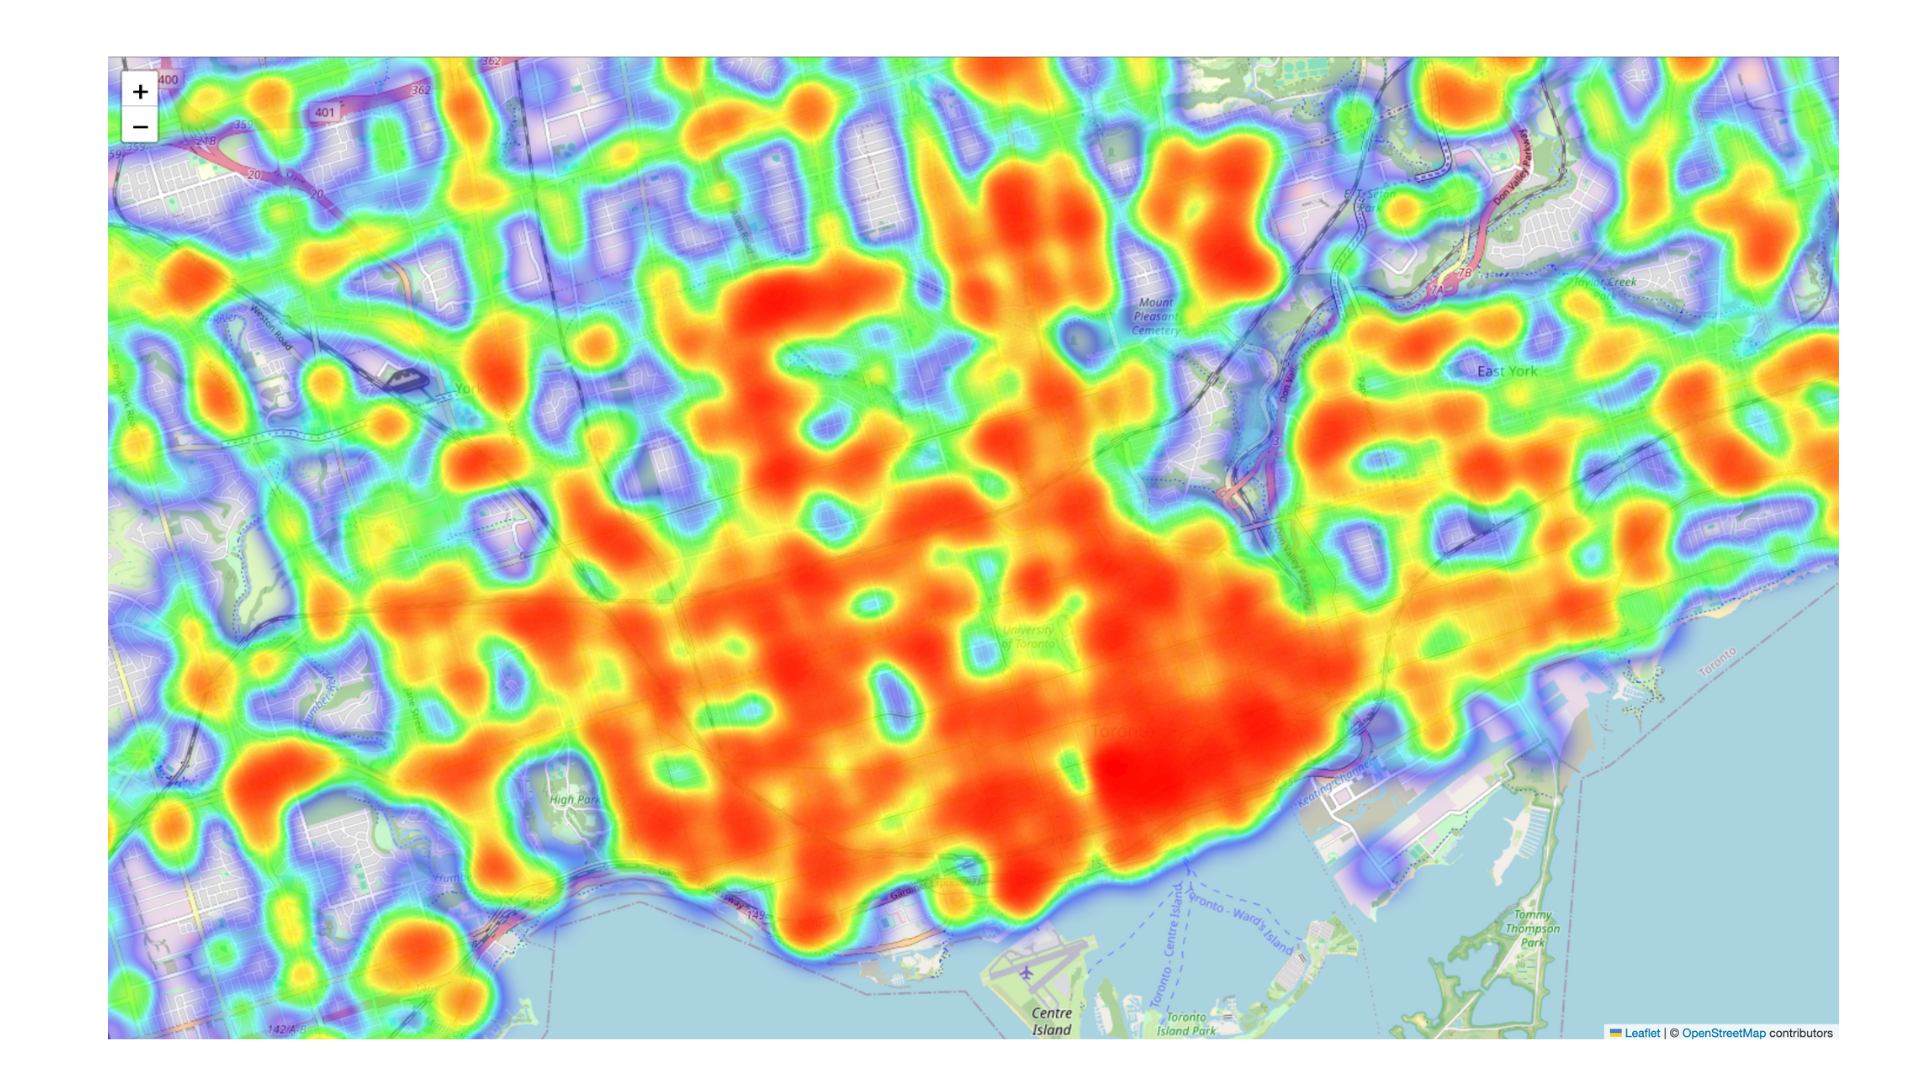
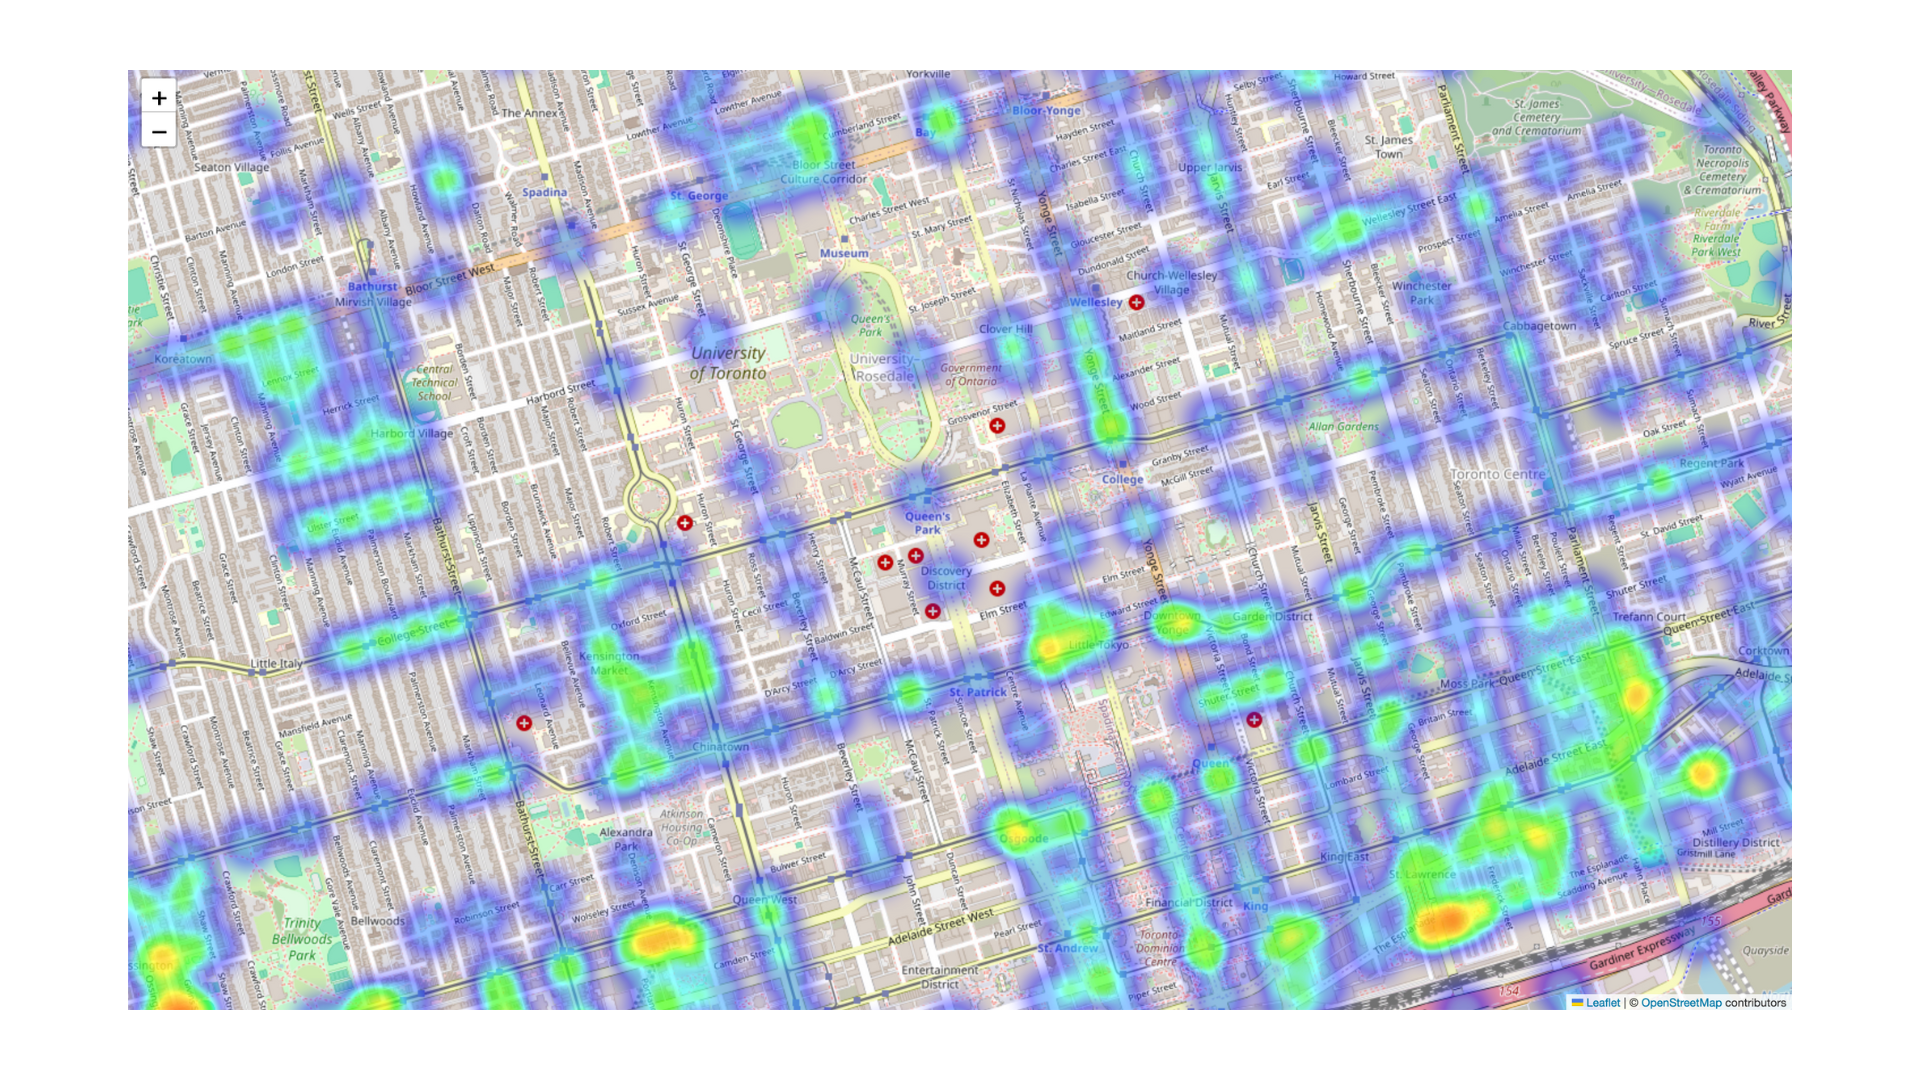
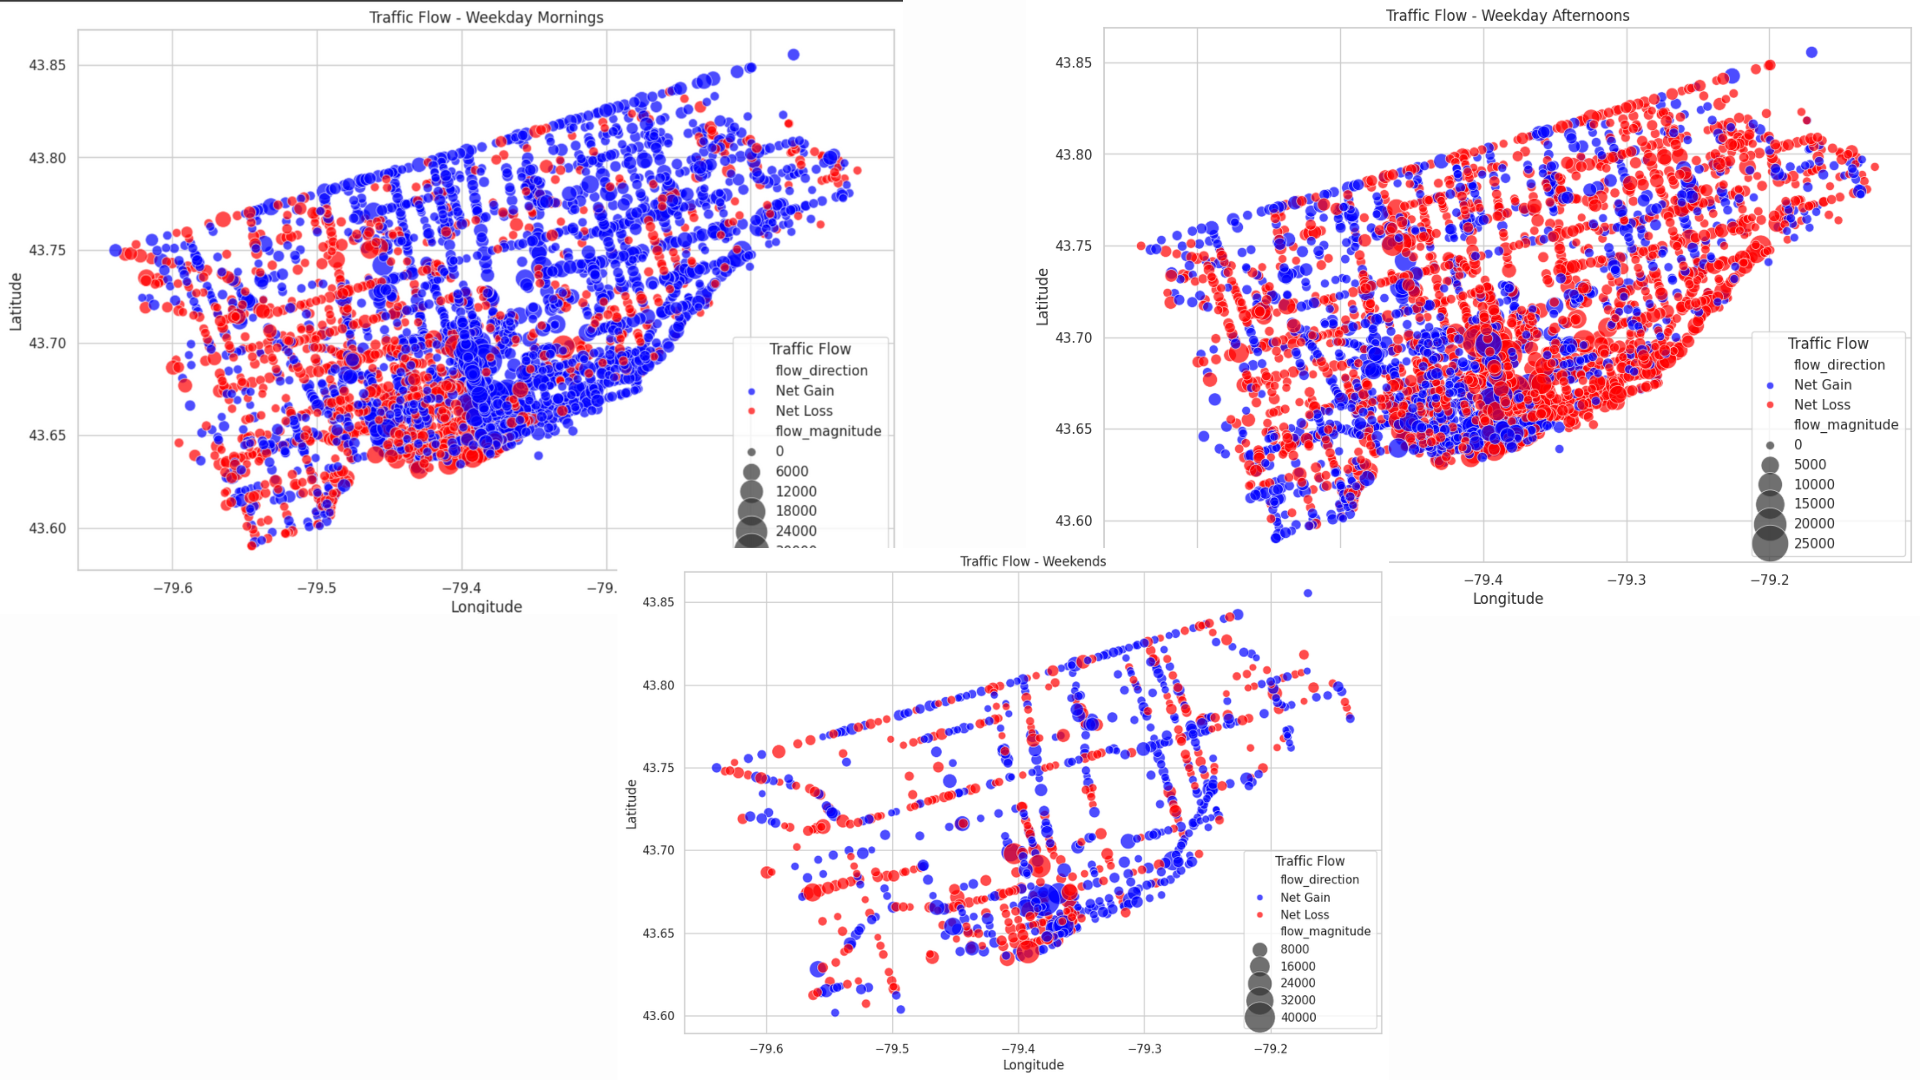
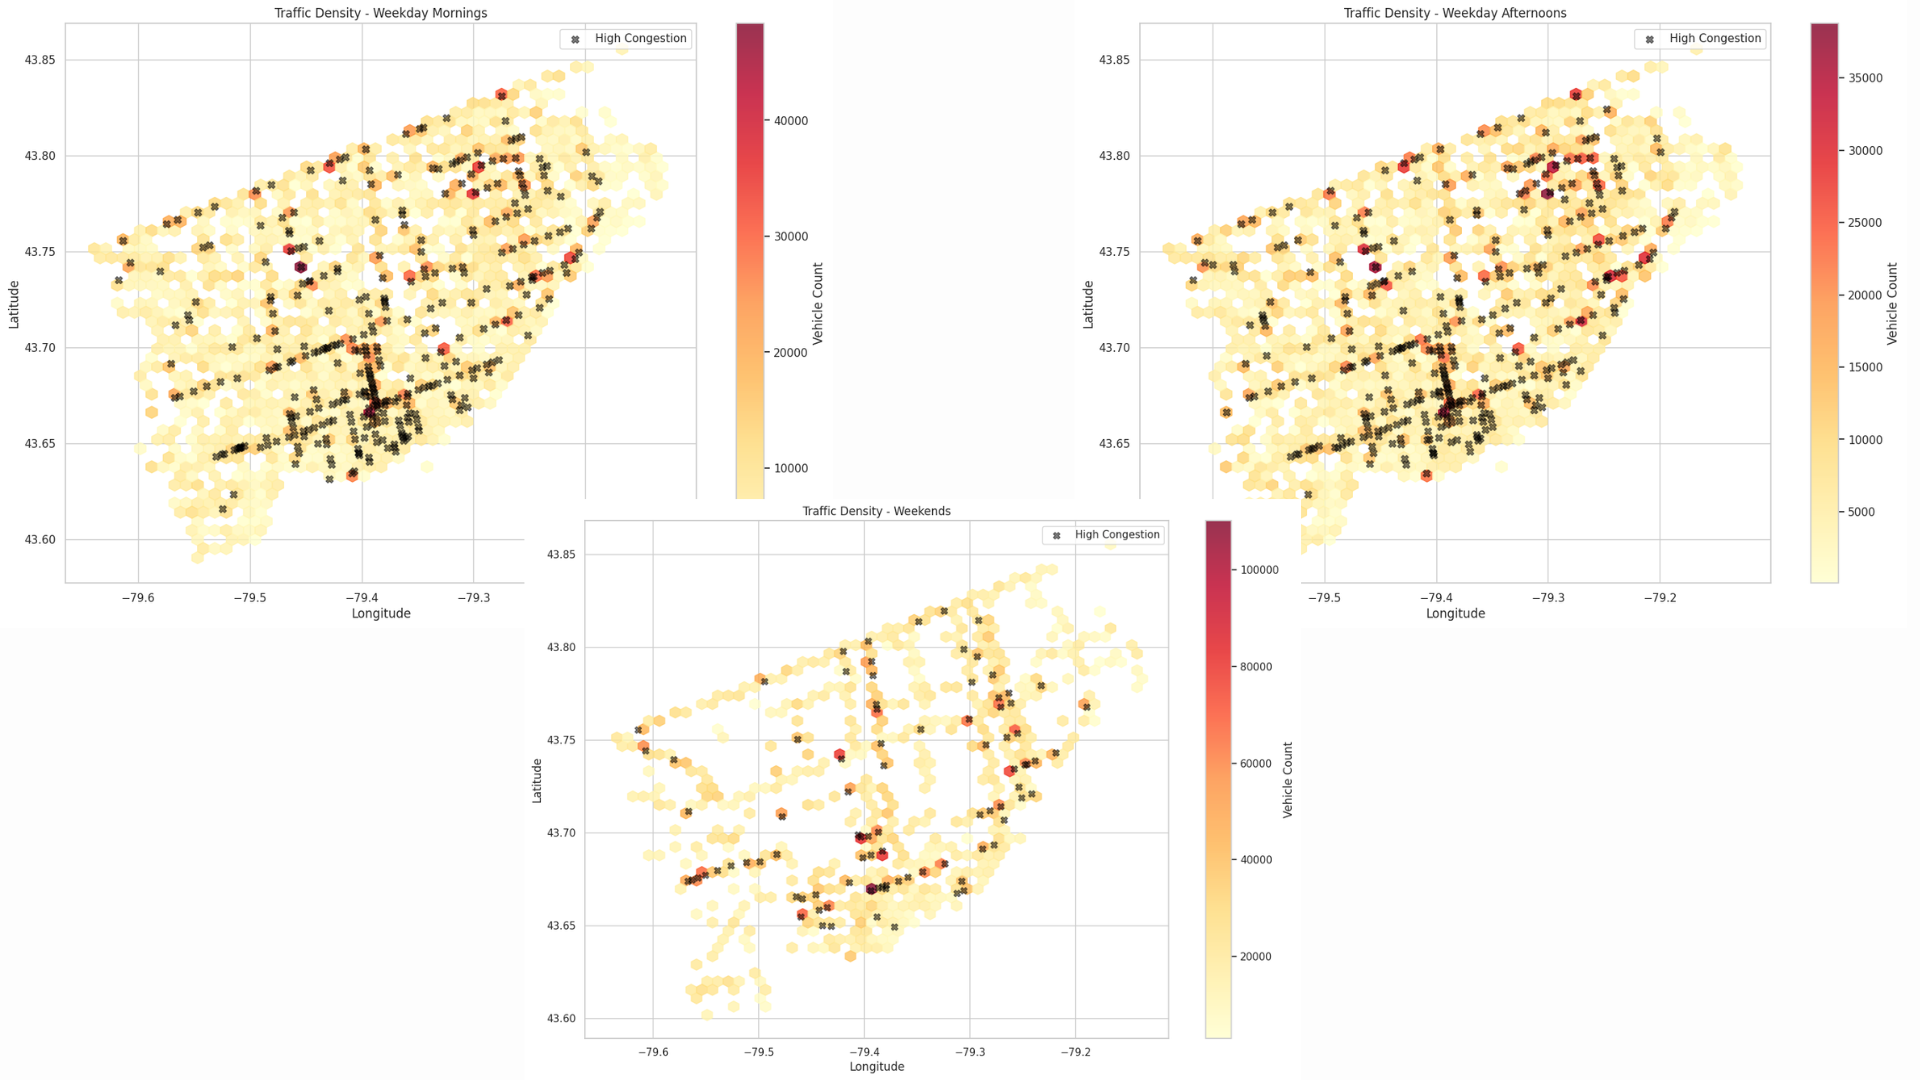
- Heatmaps & Flow Diagrams: Highlighting congestion hotspots and travel patterns.
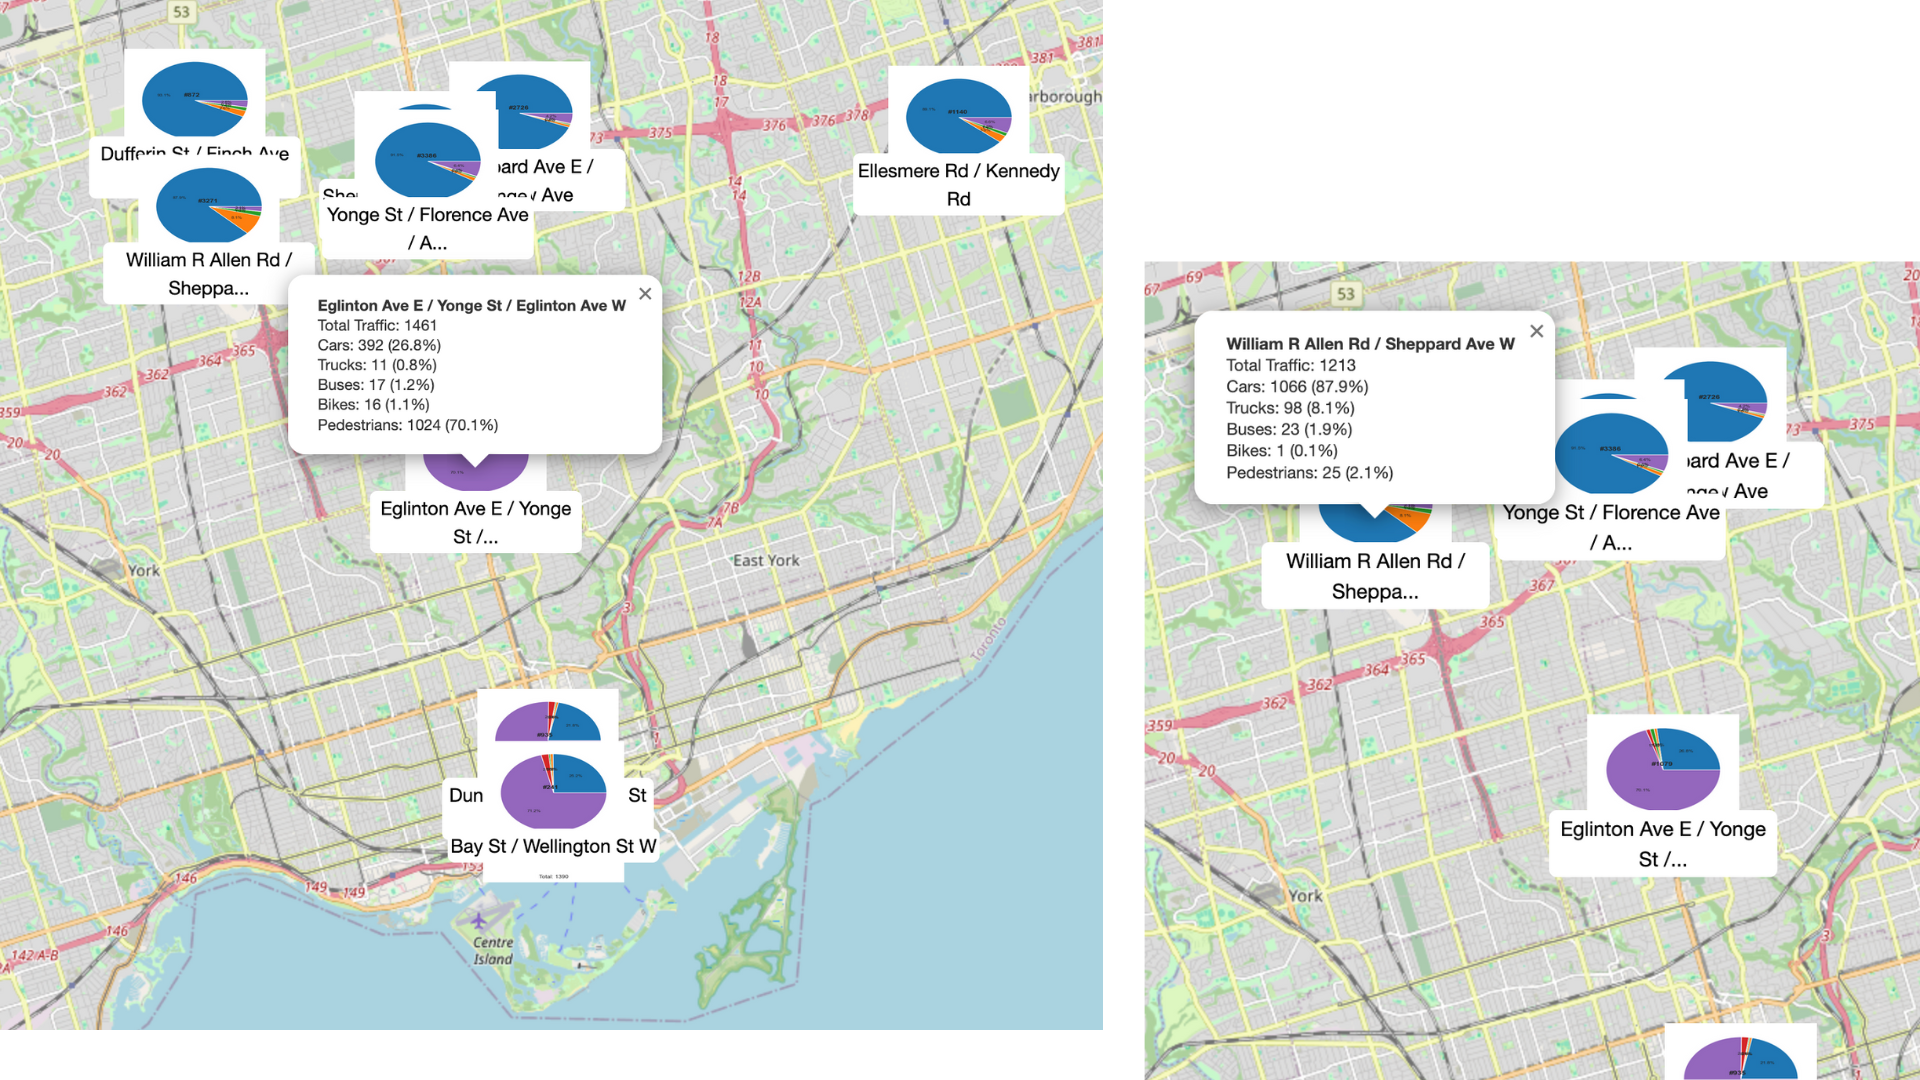
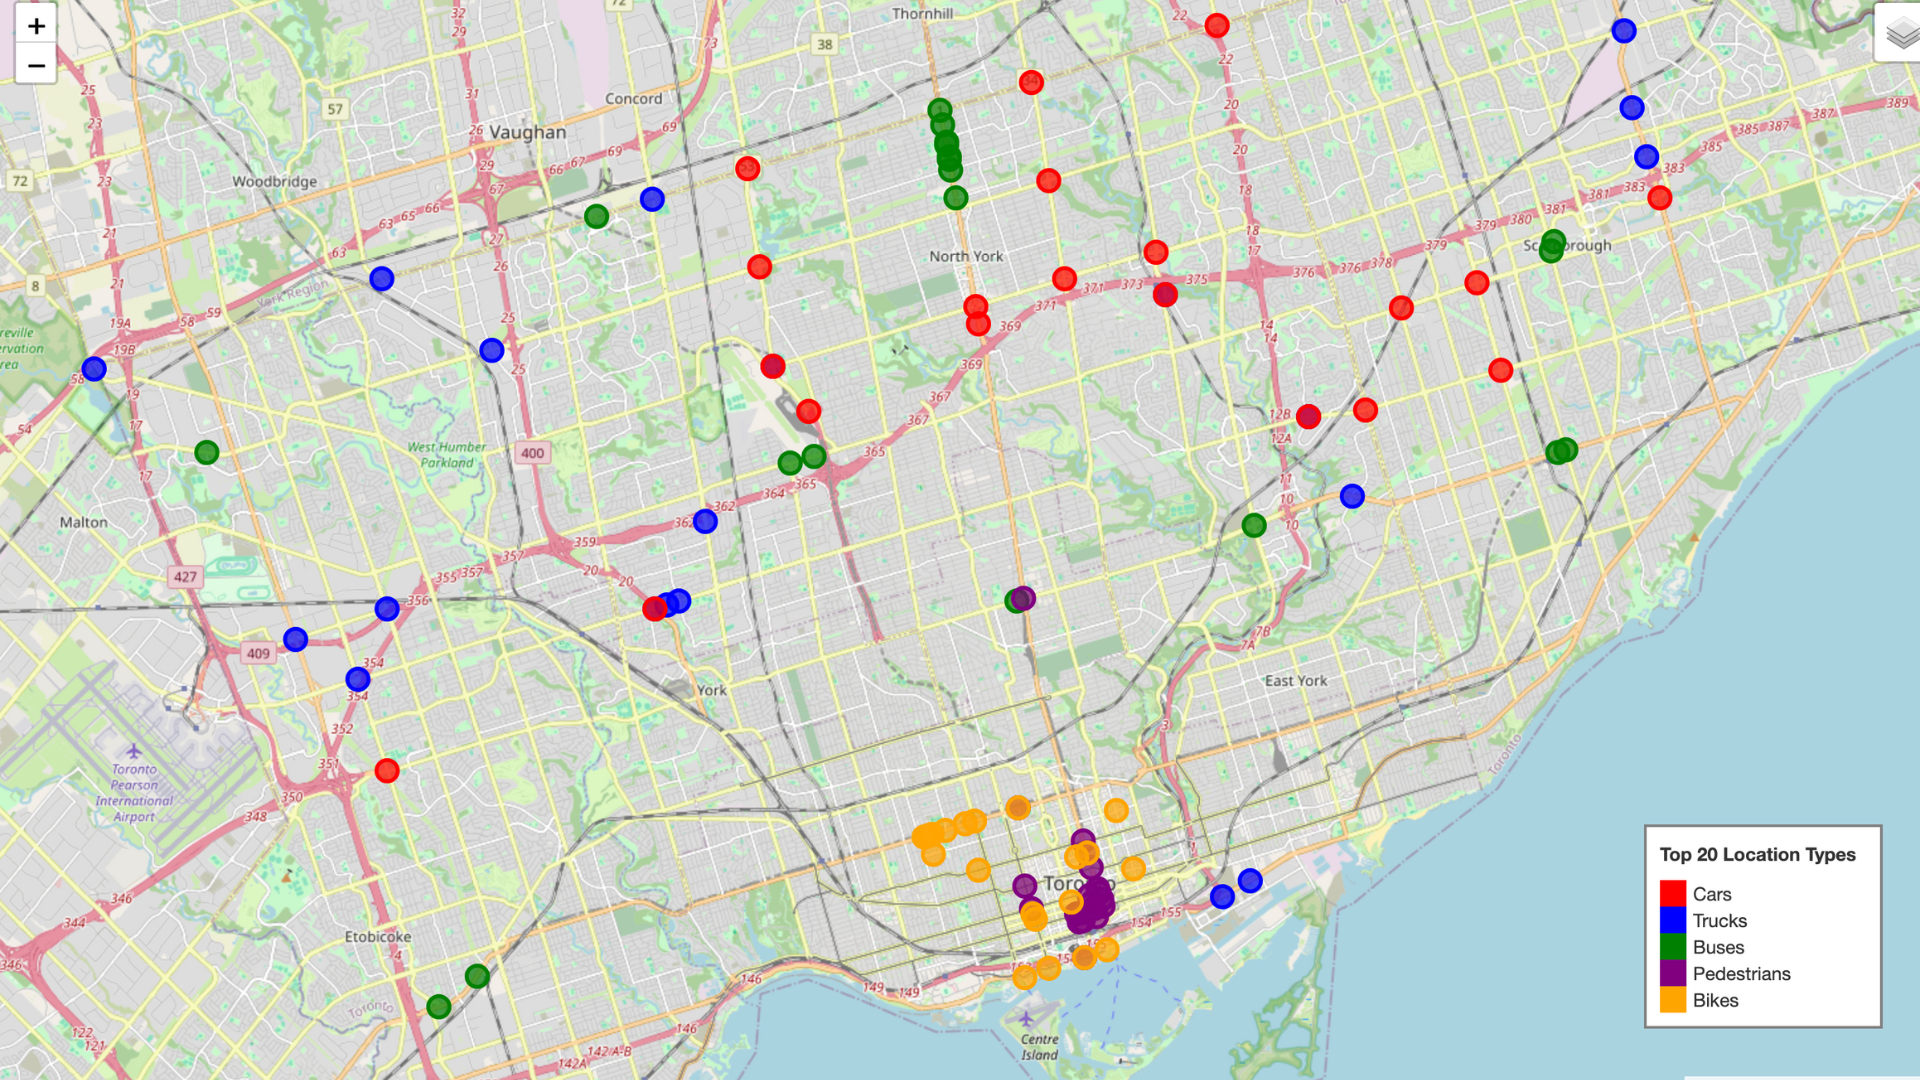
- Interactive Folium Maps: Displaying the top congested intersections in Toronto.
- Time-Series Plots: Comparing weekday versus weekend traffic trends and identifying peak periods.
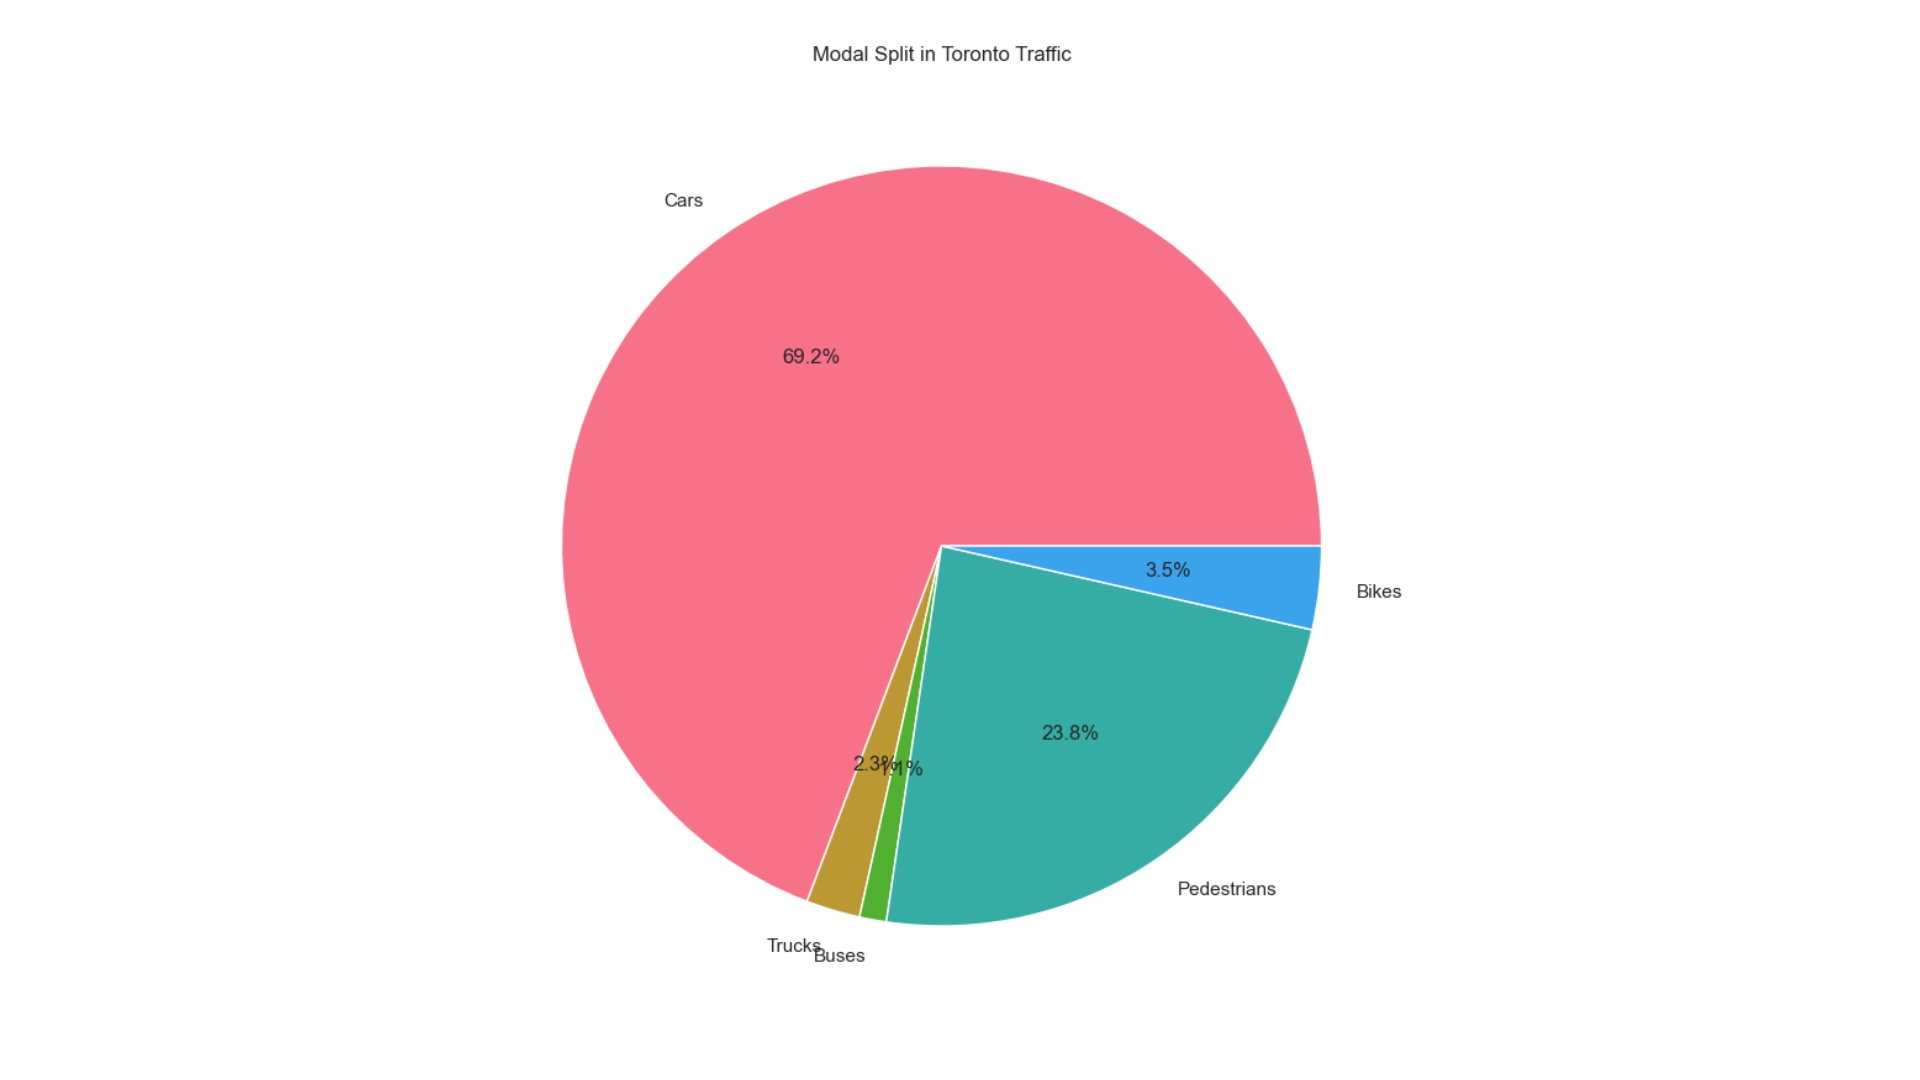
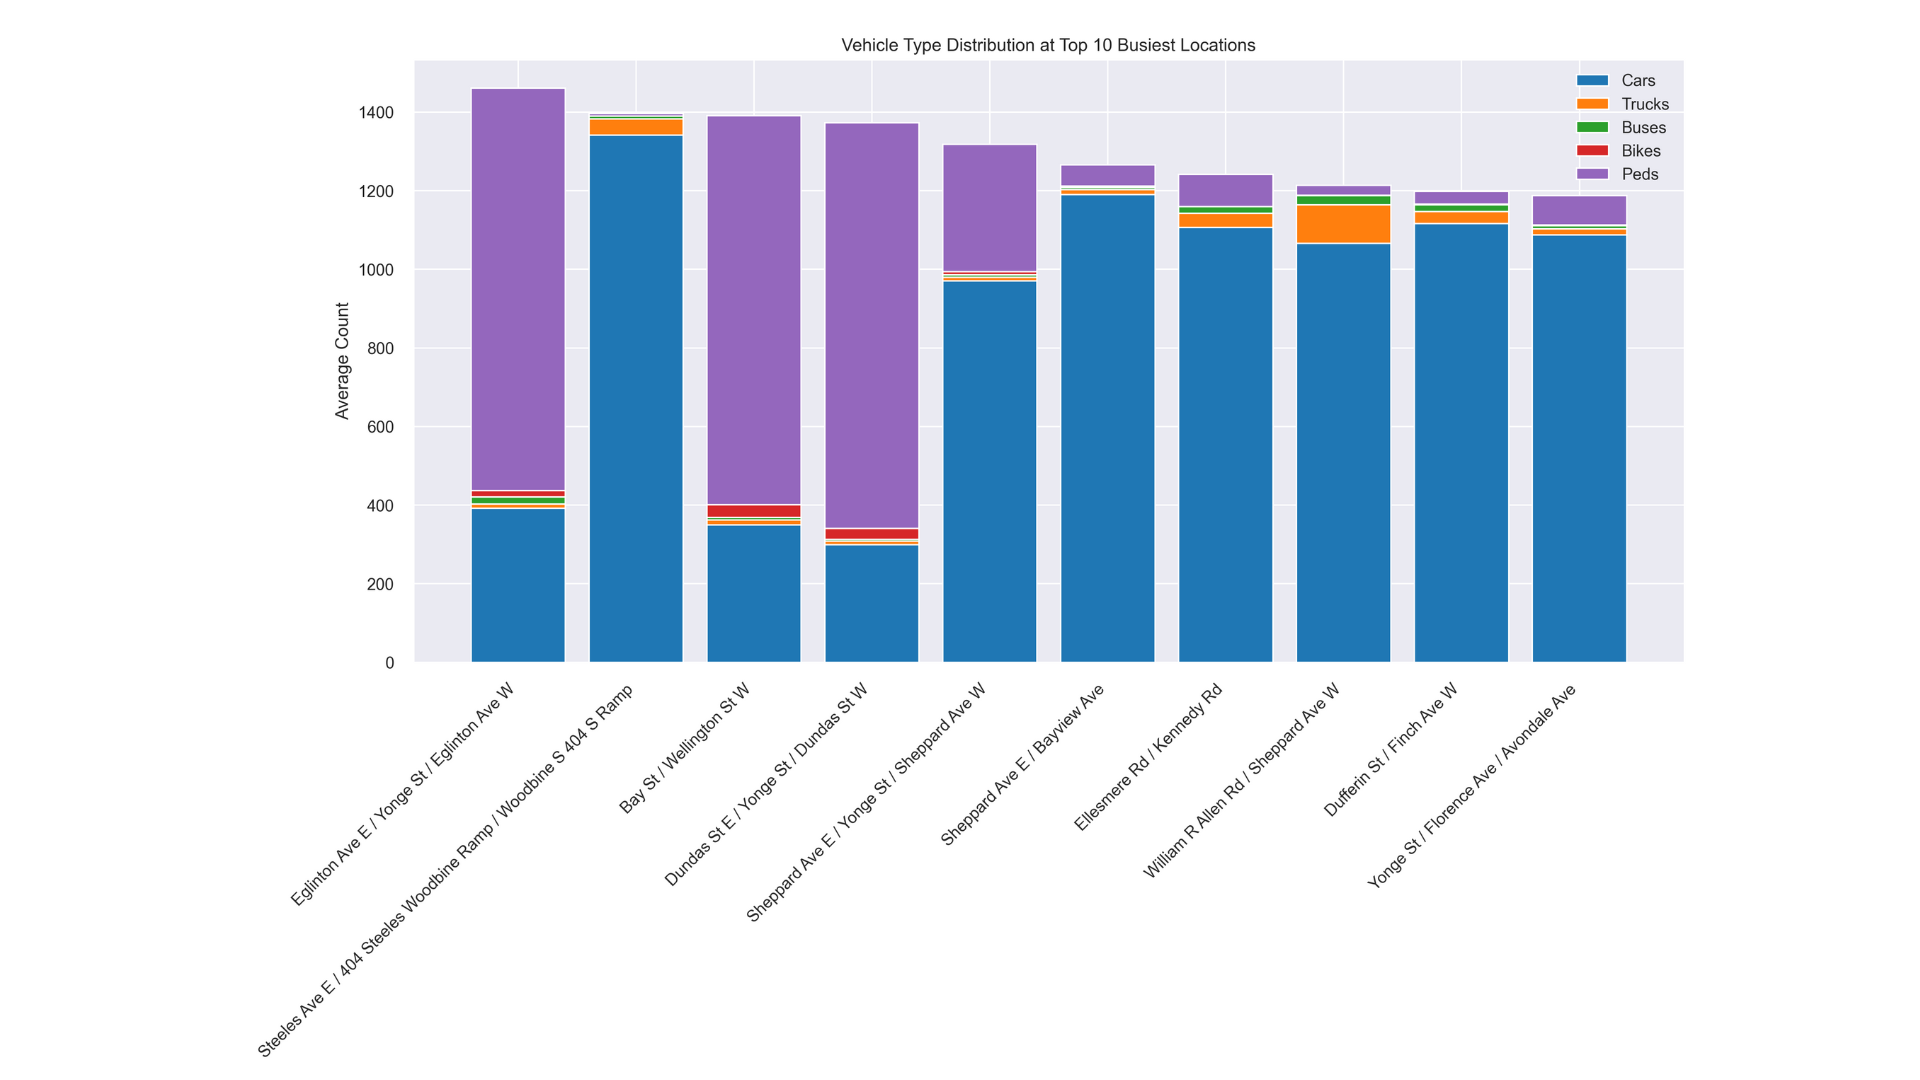
- Additional Charts: Bar charts and pie charts that break down the modal split between cars, buses, trucks, pedestrians, and cyclists.
3. Data-Driven Solutions
Based on our findings, we devised a set of targeted interventions:
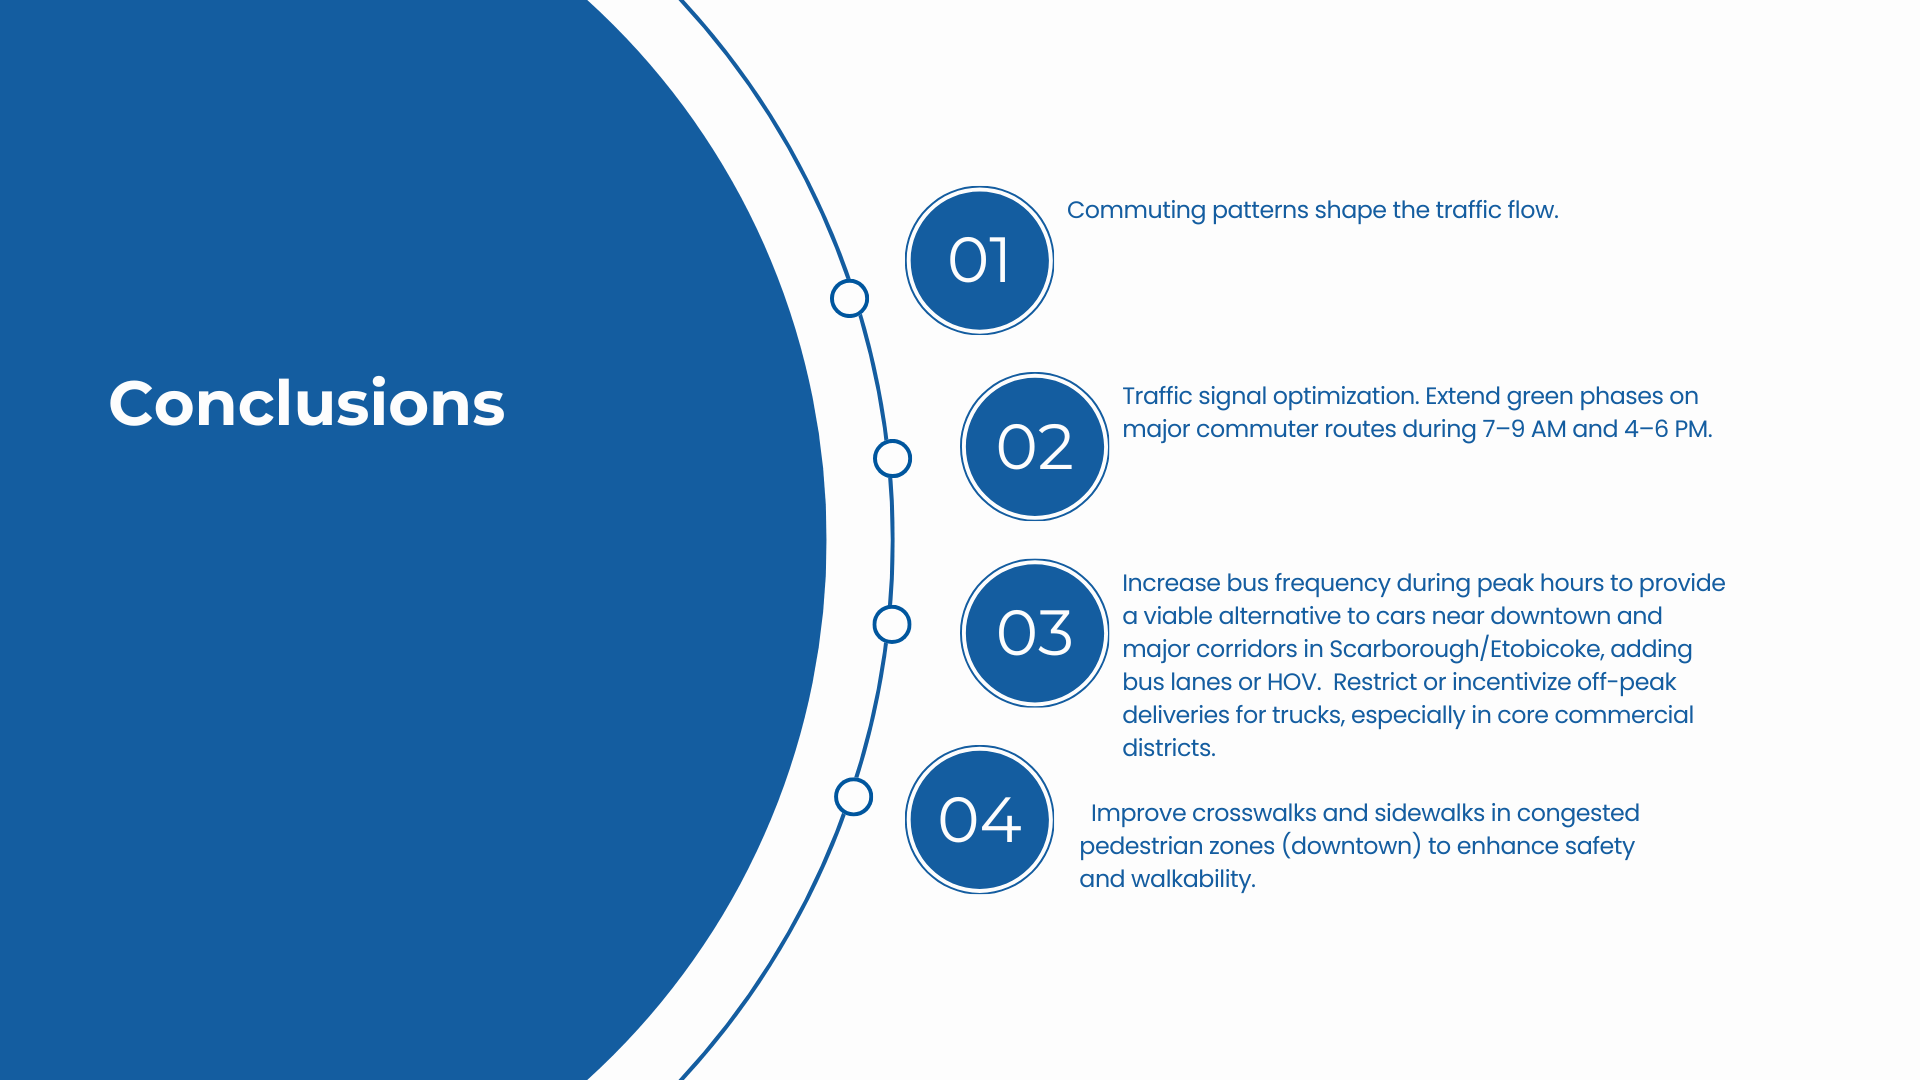
- Traffic Signal Optimization: Extend green phases on major commuter routes during peak hours to improve flow.
- Public Transit Enhancements: Increase bus frequency and add dedicated bus/HOV lanes near downtown and major corridors (Scarborough/Etobicoke).
- Logistics Management: Incentivize off-peak deliveries for trucks in core commercial districts.
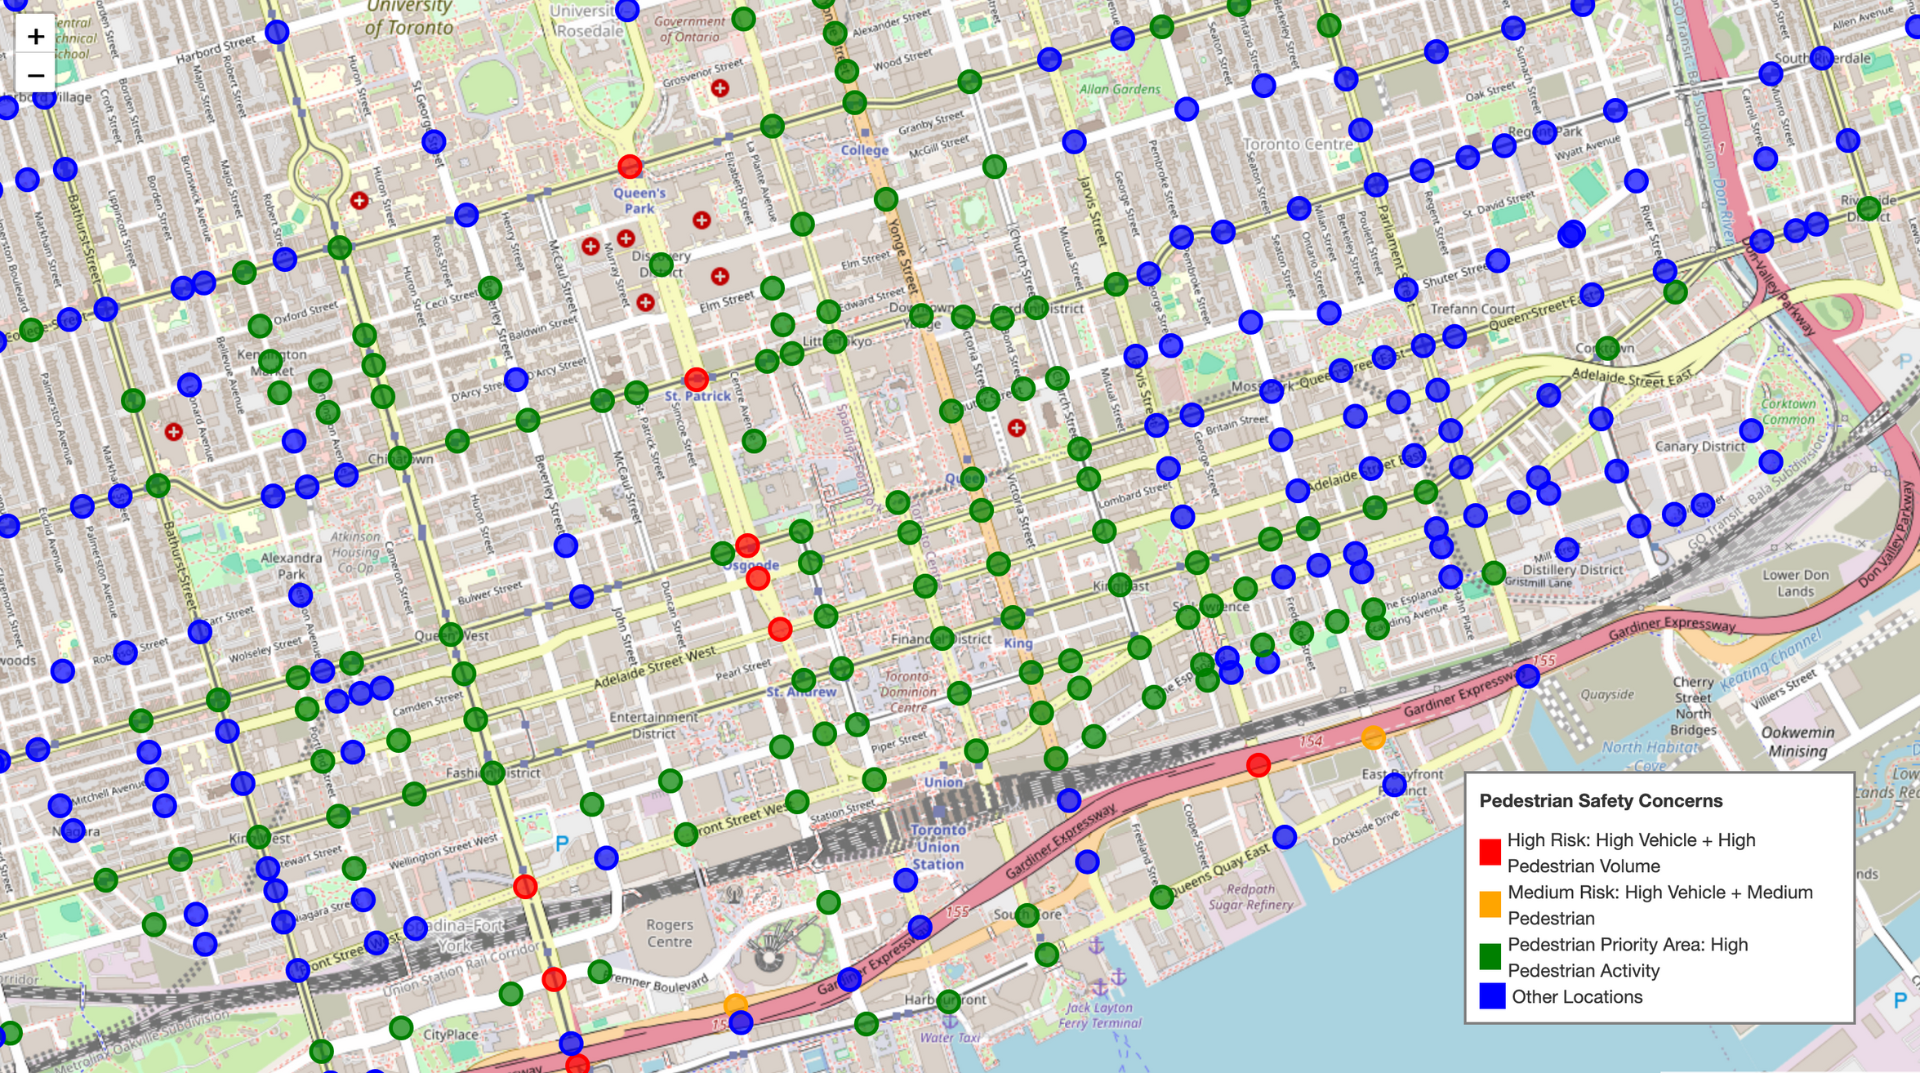
- Pedestrian & Cyclist Infrastructure: Improve crosswalks, sidewalks, and bike lanes in congested areas to boost safety and encourage modal shift.
Key Findings
- Commuting Patterns: Our analysis confirmed that peak congestion is driven by morning and evening rush hours, particularly in downtown Toronto.
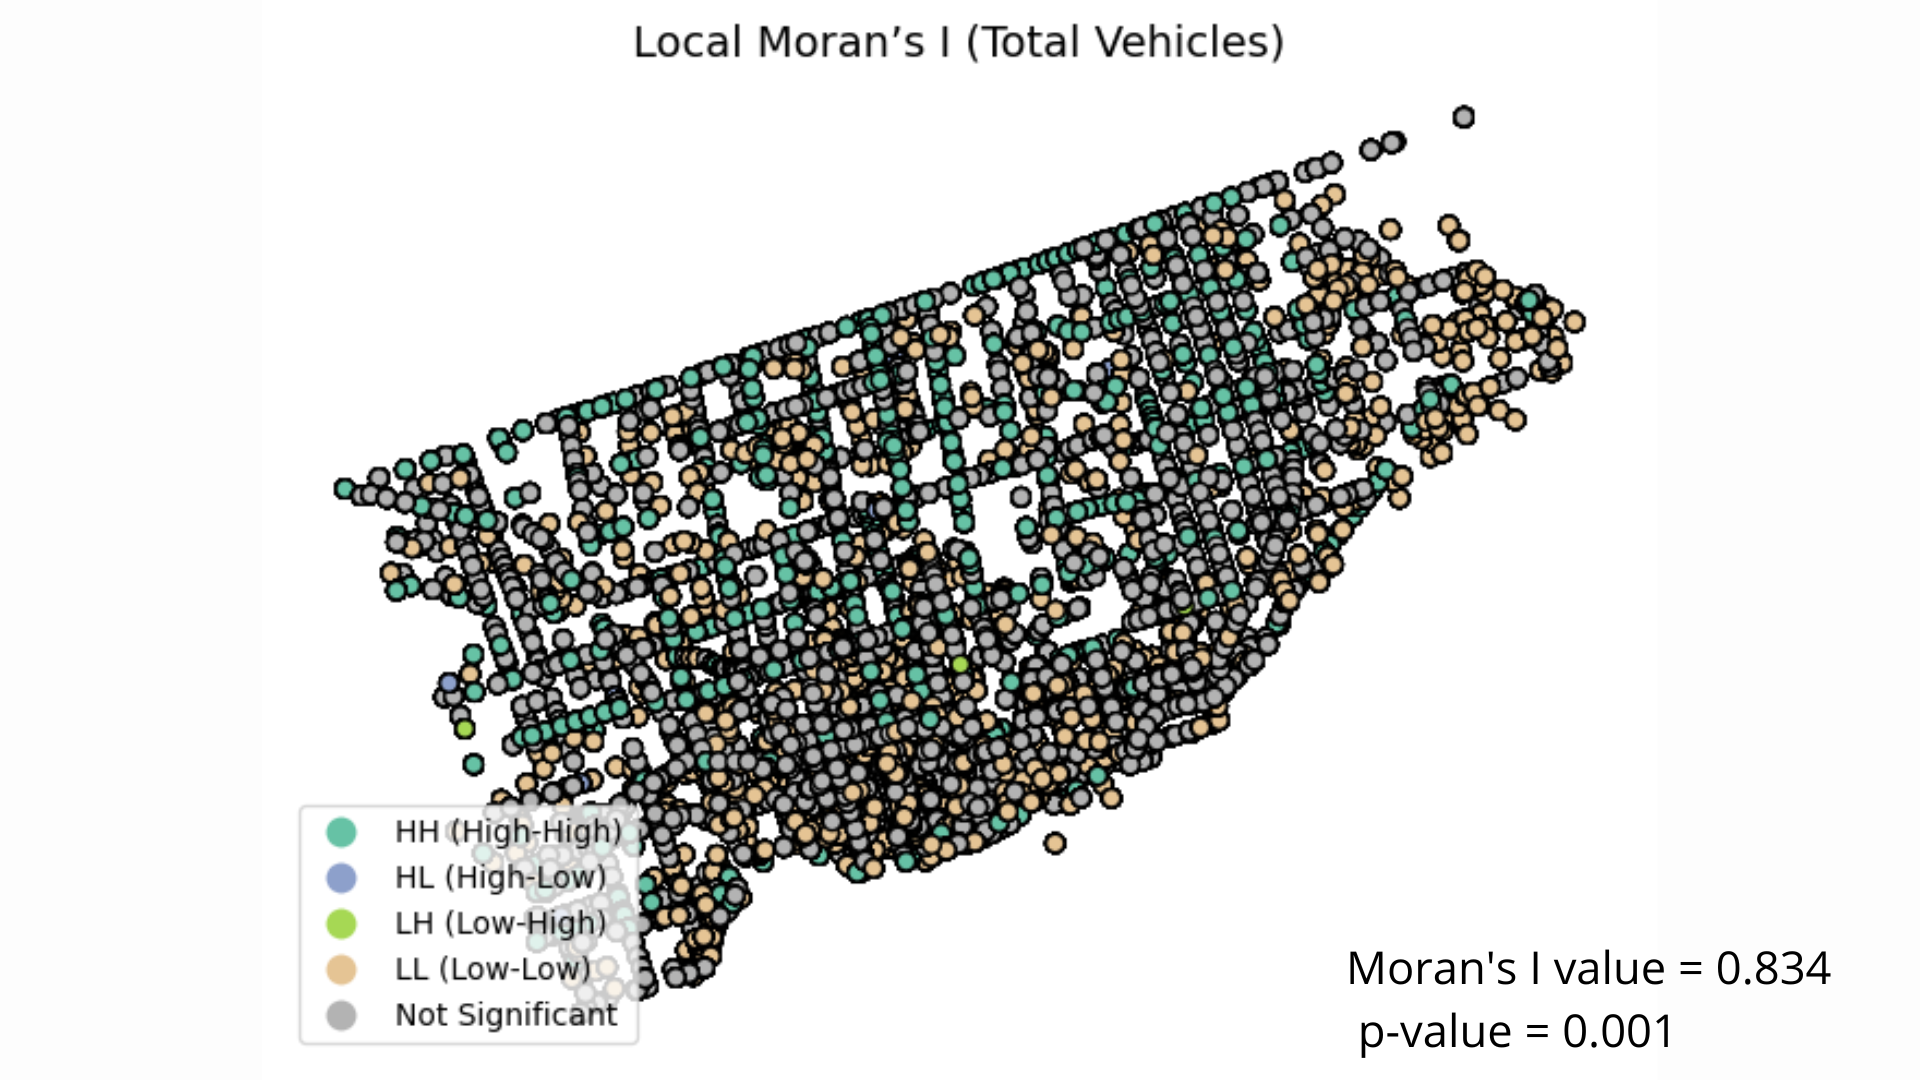
- Spatial Concentration: Major intersections and corridors are the primary congestion hotspots.
- Modal Dependence: A heavy reliance on private vehicles was evident, highlighting the need to boost public transit and non-motorized options.
Our results, including a Moran’s I value of 0.834 (p-value = 0.001), reinforce that commuting patterns significantly shape traffic flow.
(Qwerty Slidedeck)
Policy Recommendations
Adaptive Traffic Signal Control
Implement sensor-driven systems that dynamically adjust signal timings during peak hours.
Enhanced Public Transit
- Increase Bus Frequency: Particularly during rush hours, with new bus lanes/HOV corridors in key areas.
- Promote Alternatives: Incentivize off-peak truck deliveries and encourage staggered work hours to reduce commuter load.
Improved Pedestrian & Cycling Infrastructure
Upgrade crosswalks, sidewalks, and bike lanes to ensure safer, more attractive non-vehicular travel options.
Real-Time Traffic Information
Deploy digital dashboards and mobile apps that provide up-to-date congestion data and alternative routing options.


Log in or sign up for Devpost to join the conversation.