-
-
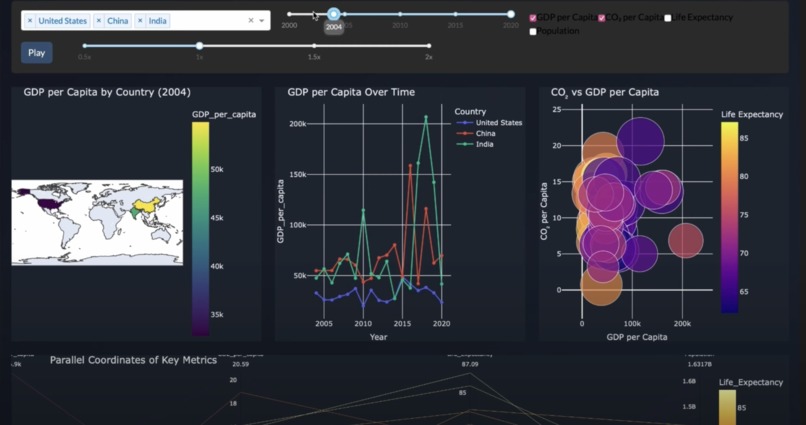
World Environment dashboard geenrated by viz.ai
-

-
-
-
-

viz.ai
Inspiration
During my Google Summer of Code experience with the R Project for Statistical Computing, I was amazed by the expressive power of interactive, animated data-visualization dashboards. However, building these dashboards required writing extensive code, making endless design choices, and manually specifying layouts and plot types.
Existing AI agents like ChatGPT or DeepSeek could help with fragments of code but failed to produce a coherent, well-designed, interactive dashboard end-to-end. This pain point inspired viz.ai — an AI agent that generates full-fledged, highly aesthetic, interactive dashboards from a single dataset prompt without manual intervention.
What it does
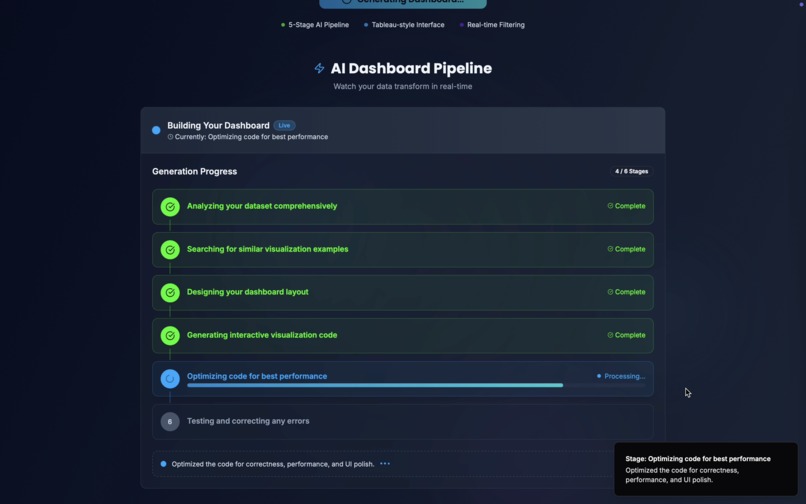
viz.ai takes a user-uploaded dataset (currently supporting up to ~150 rows × 10 columns CSV) and automatically:
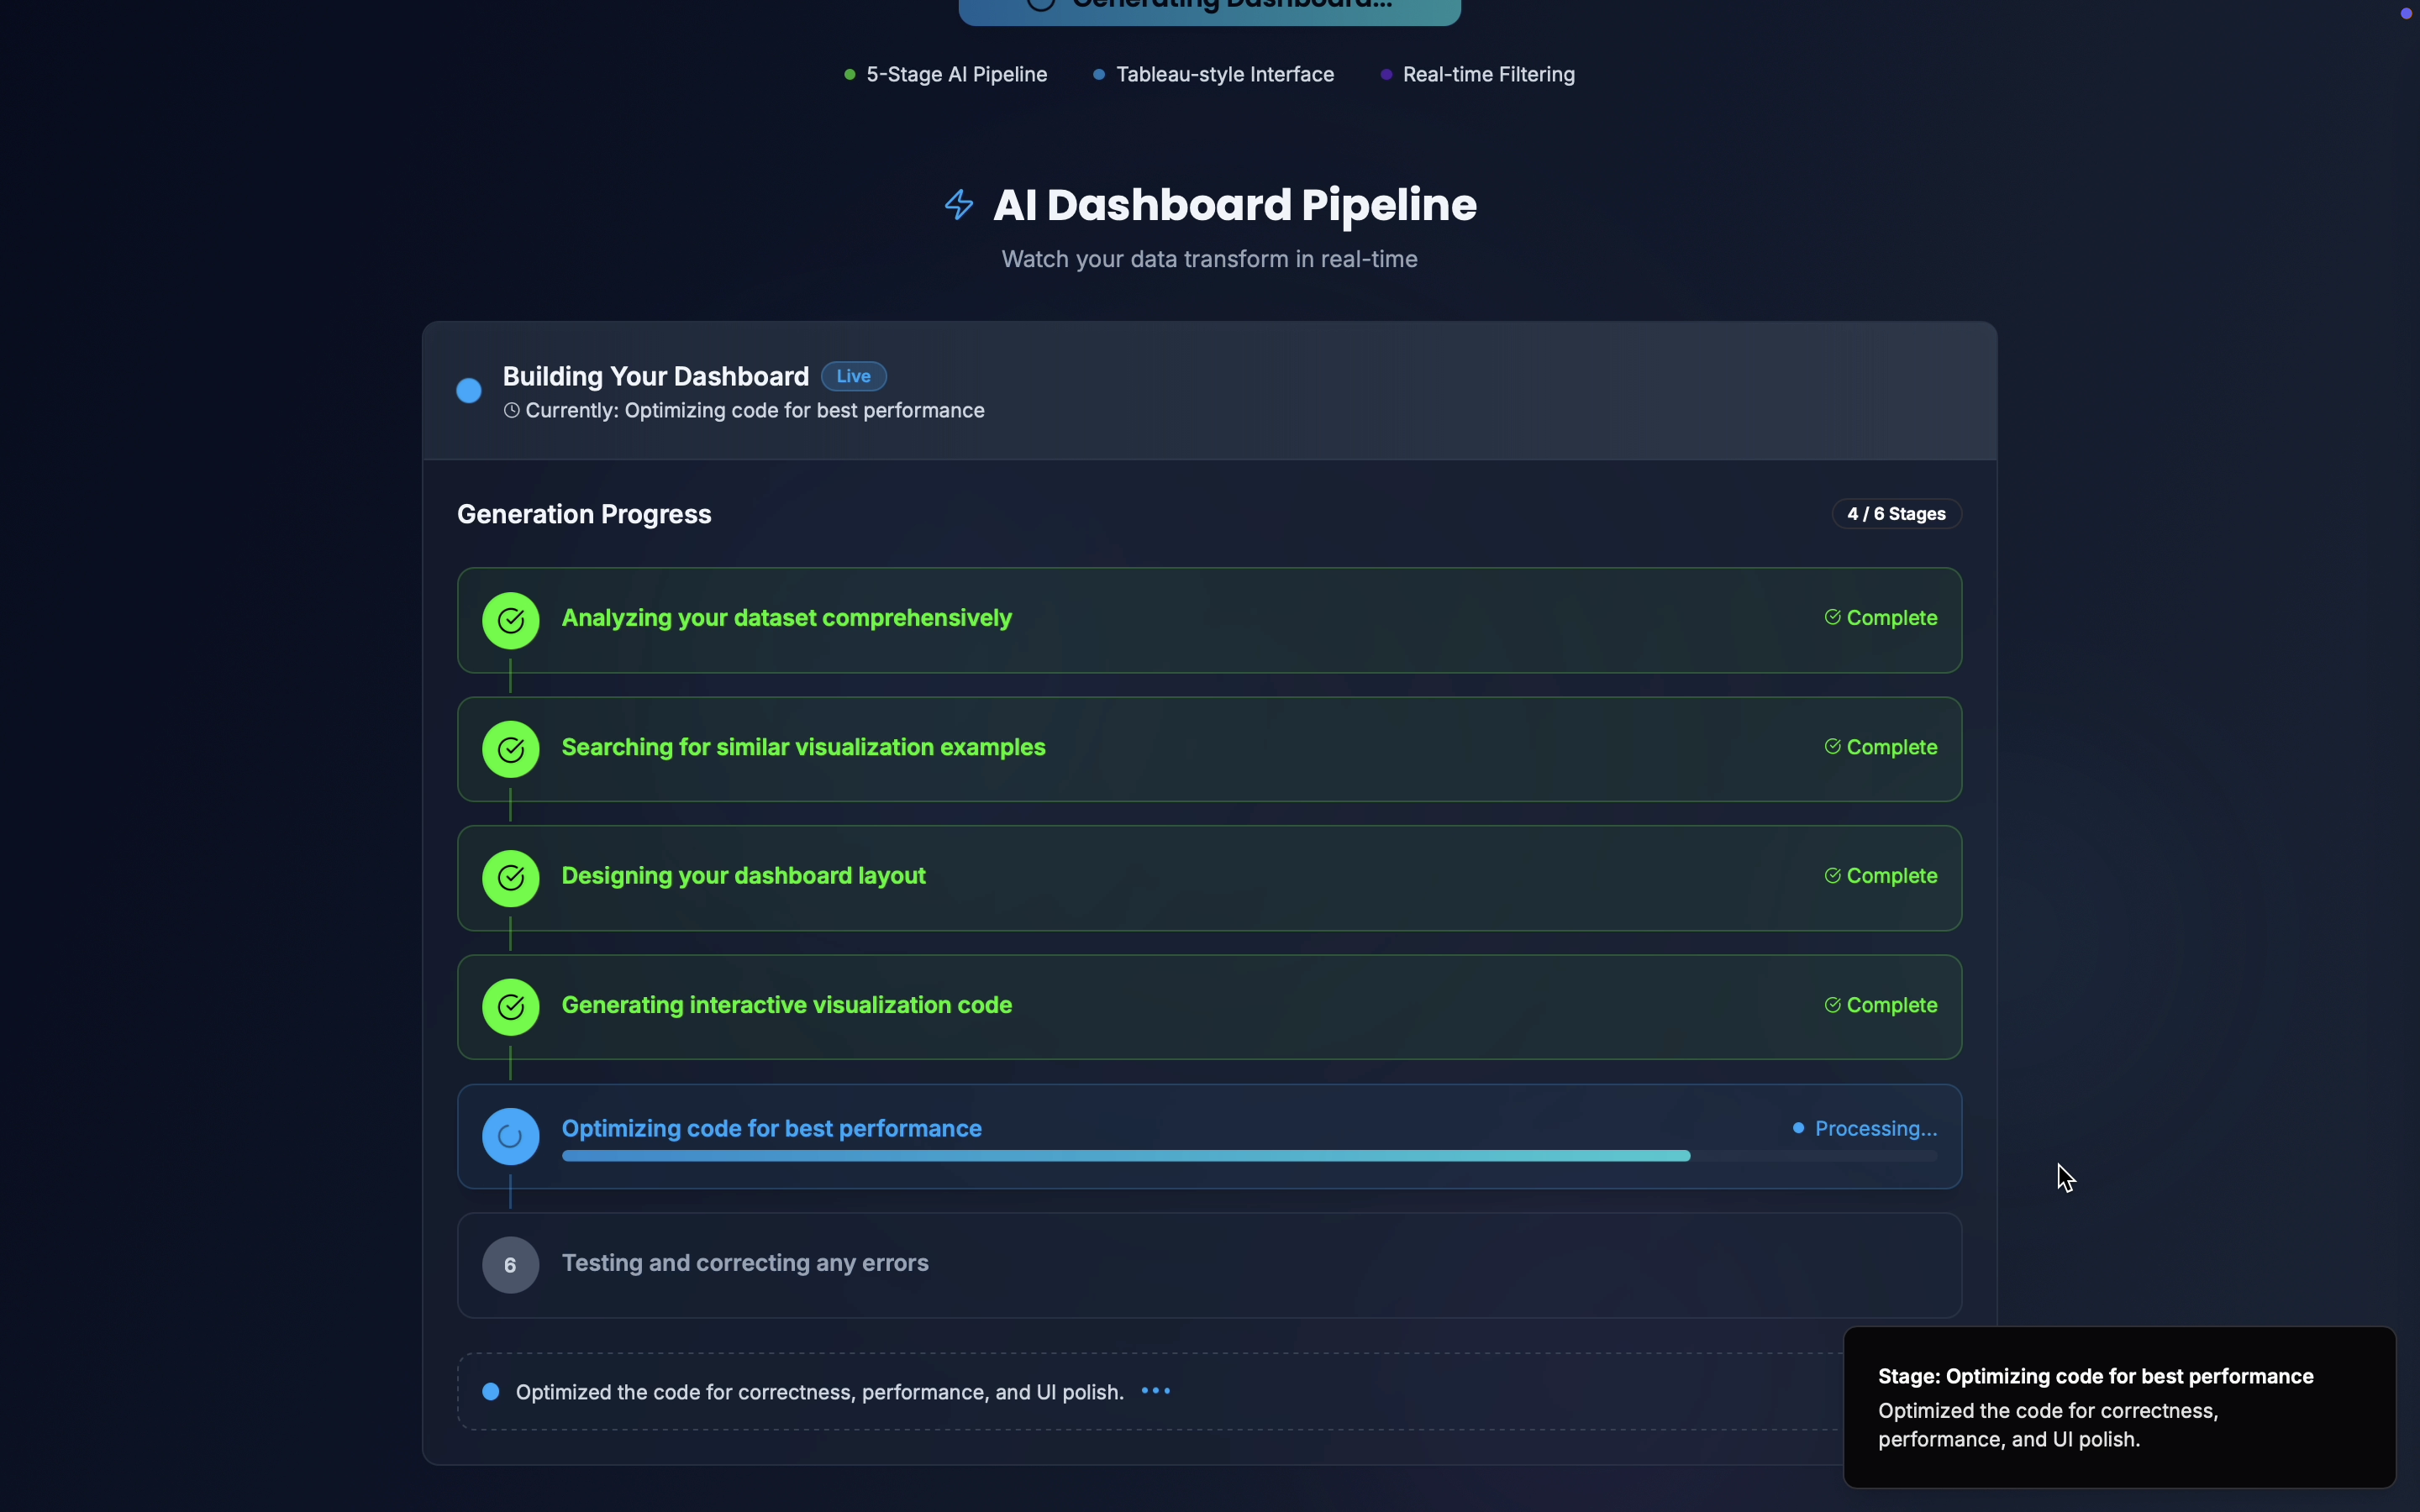
- Analyzes the dataset comprehensively.
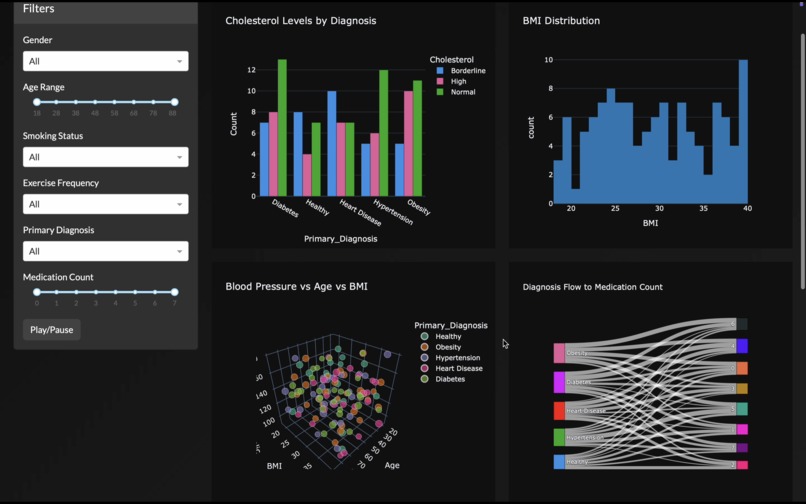
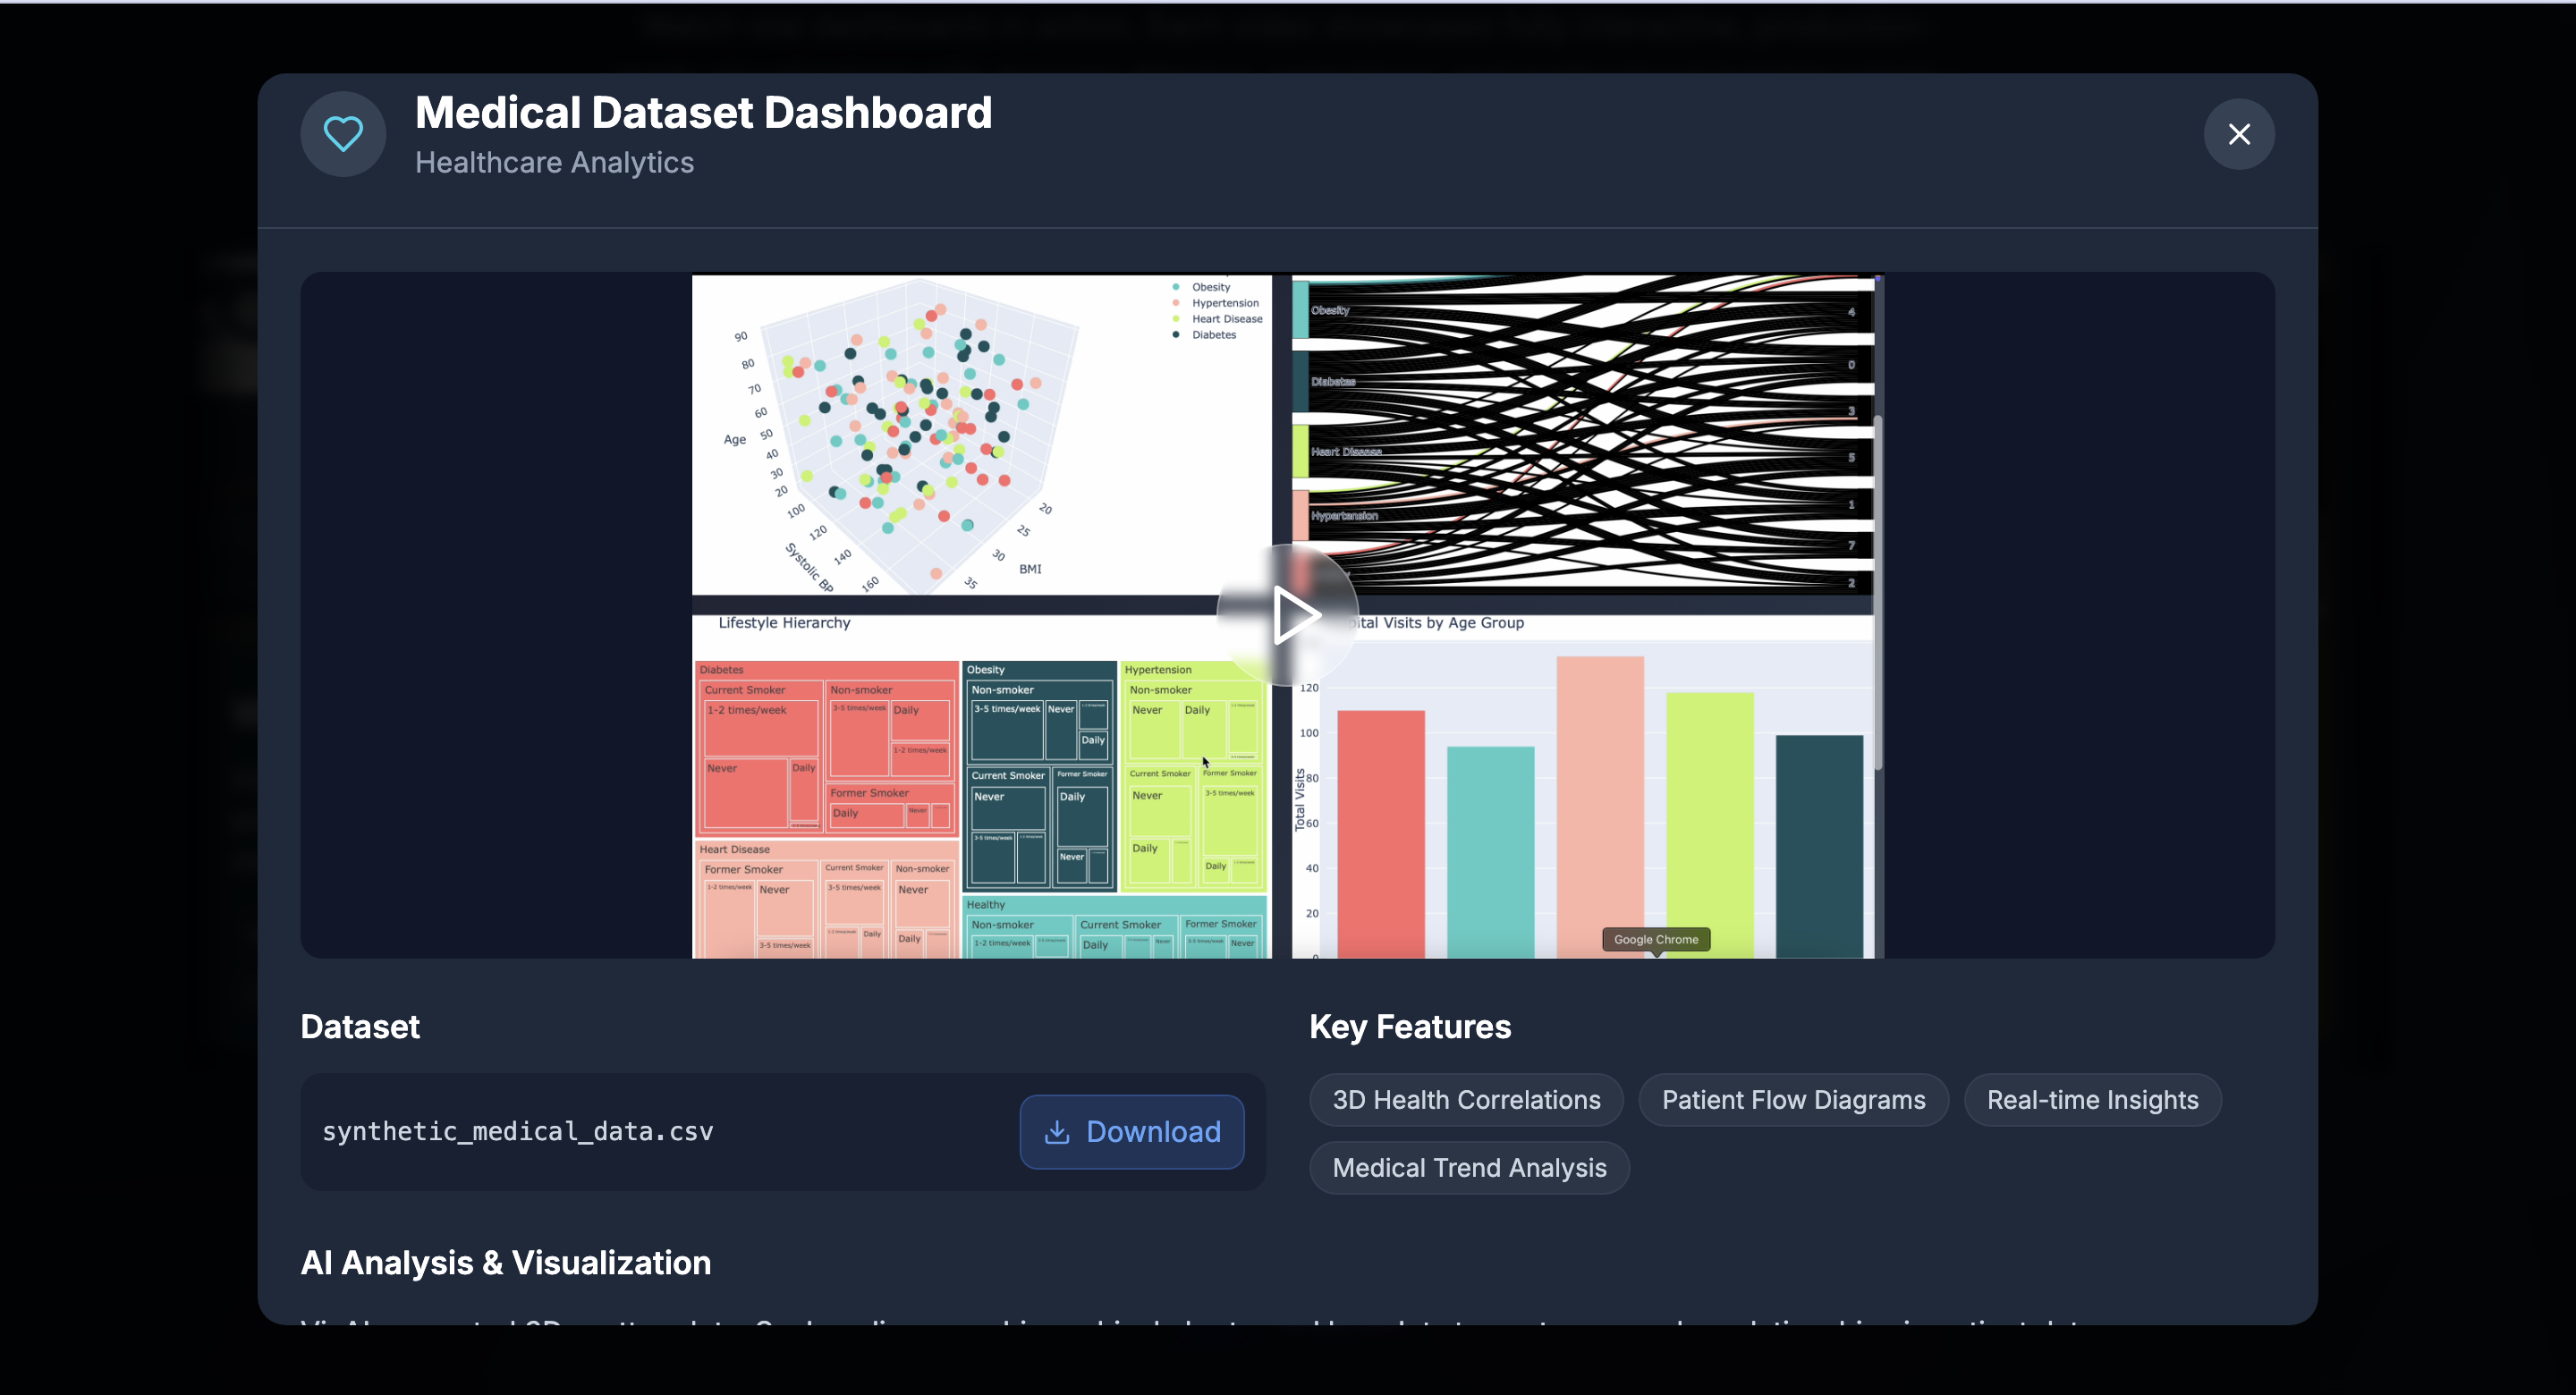
- Selects the most relevant plots, layouts, and interactions.
- Designs unique aesthetics and themes tailored to the dataset.
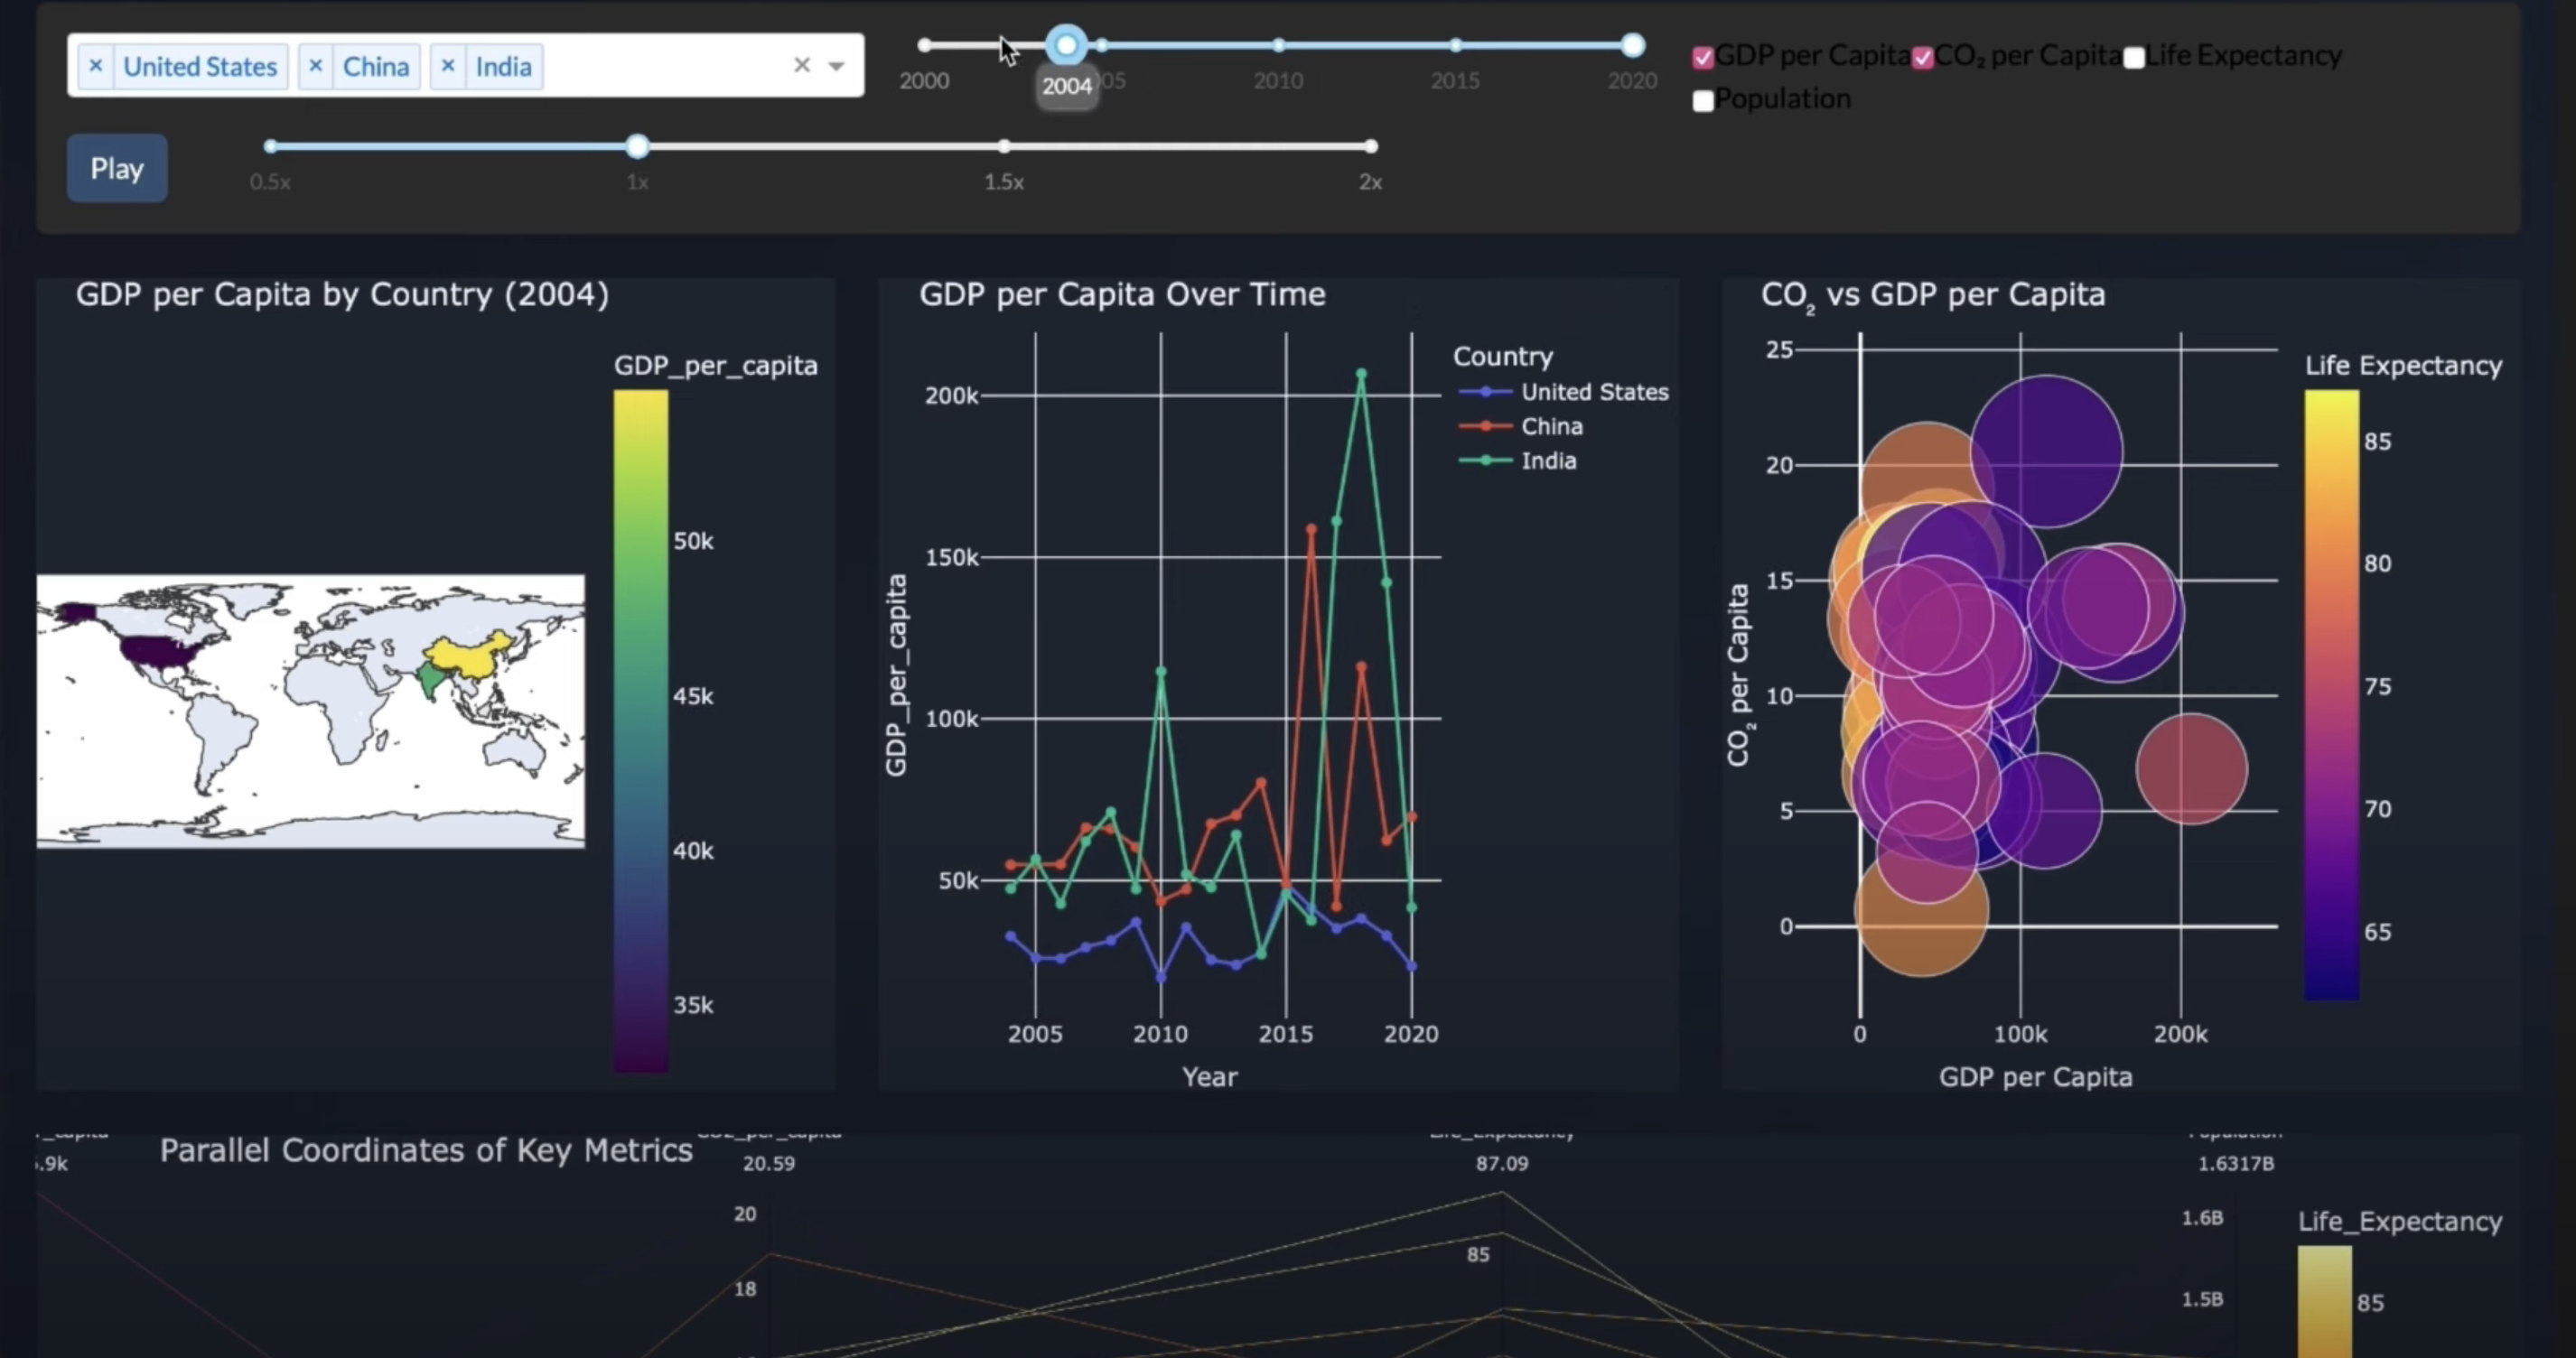
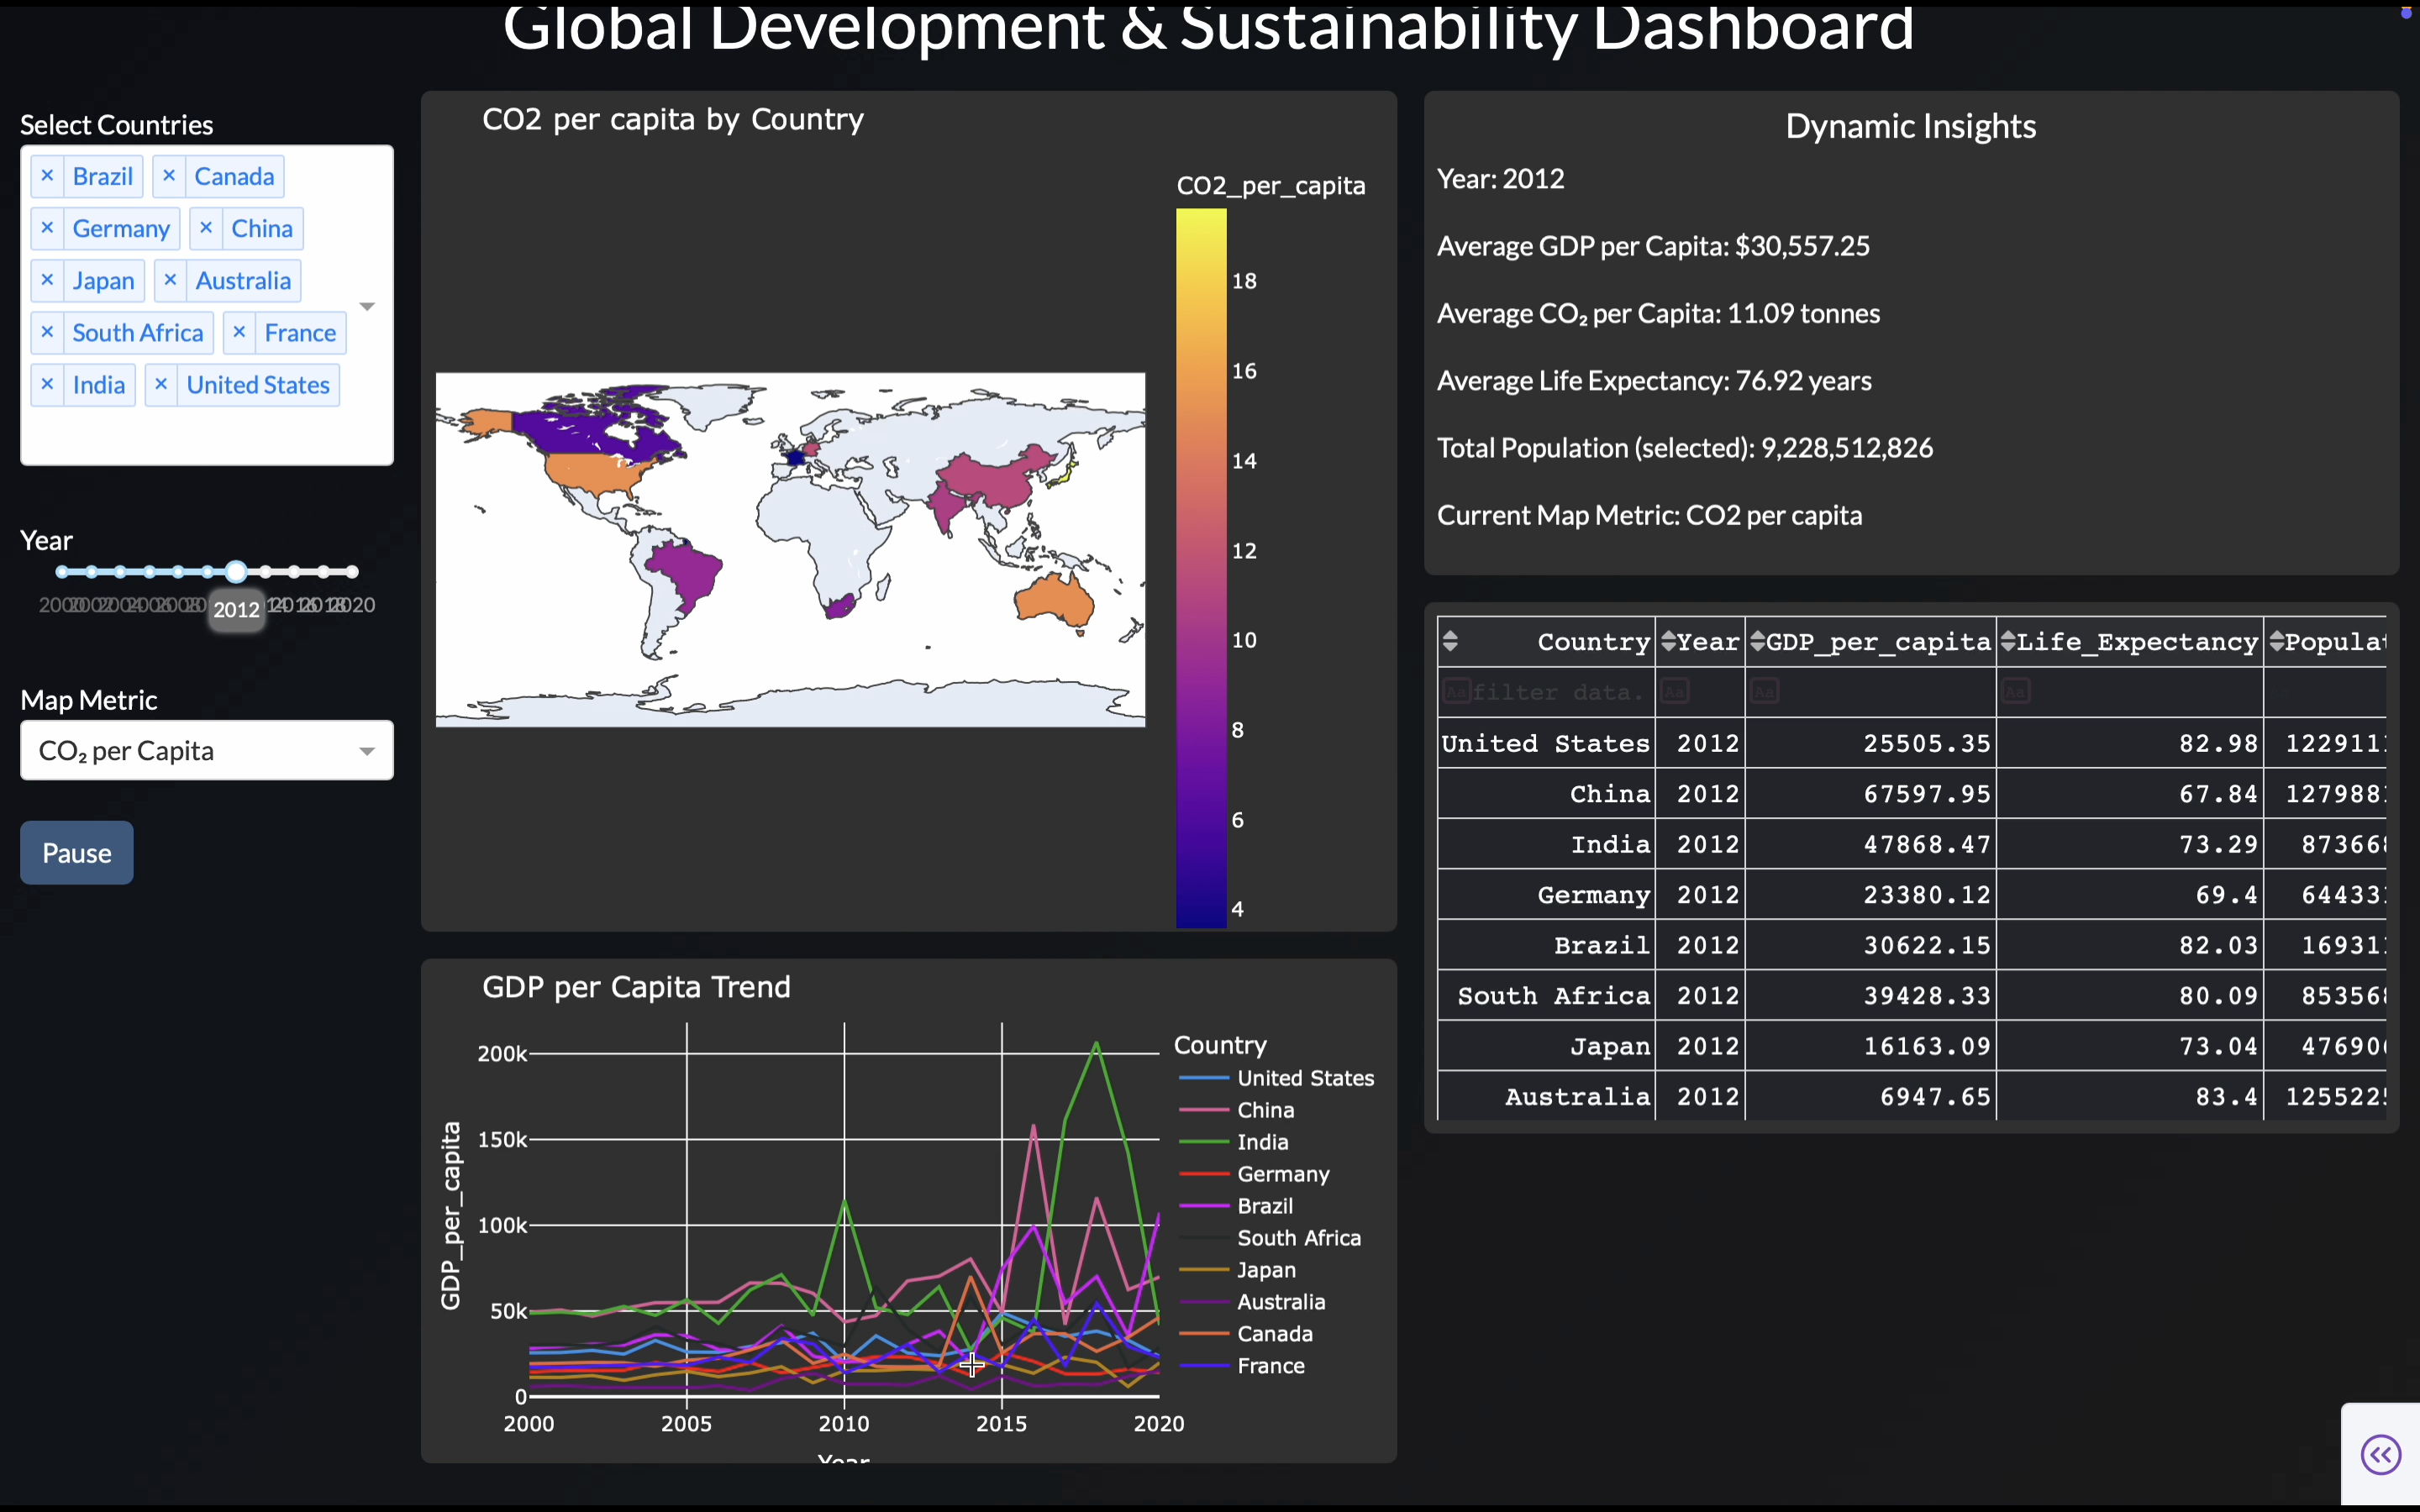
- Builds connected, filterable plots and animated visualizations over time if temporal fields exist.
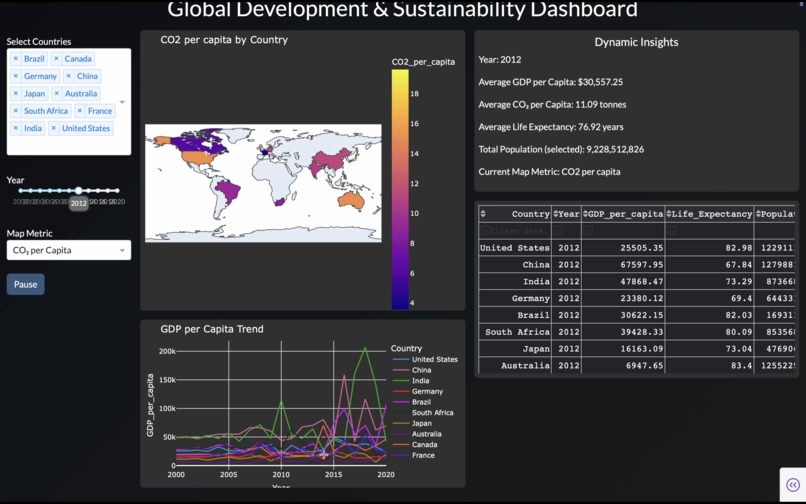
- Generates an Insights Panel that performs automated data storytelling and changing insights as filters are applied.
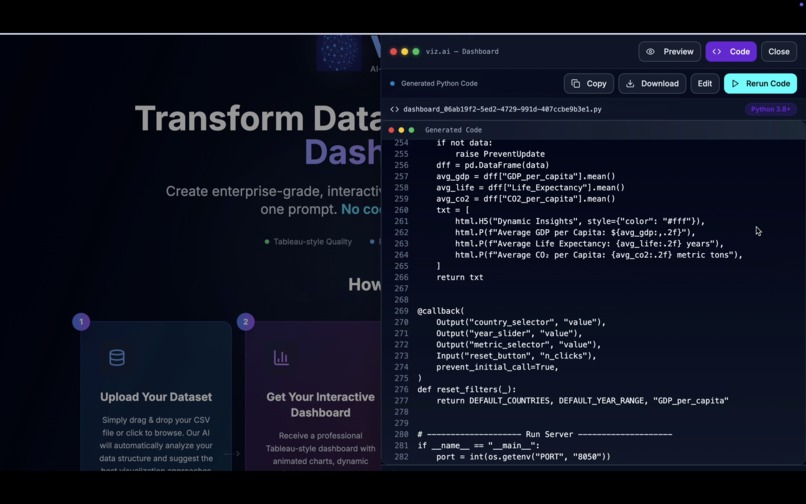
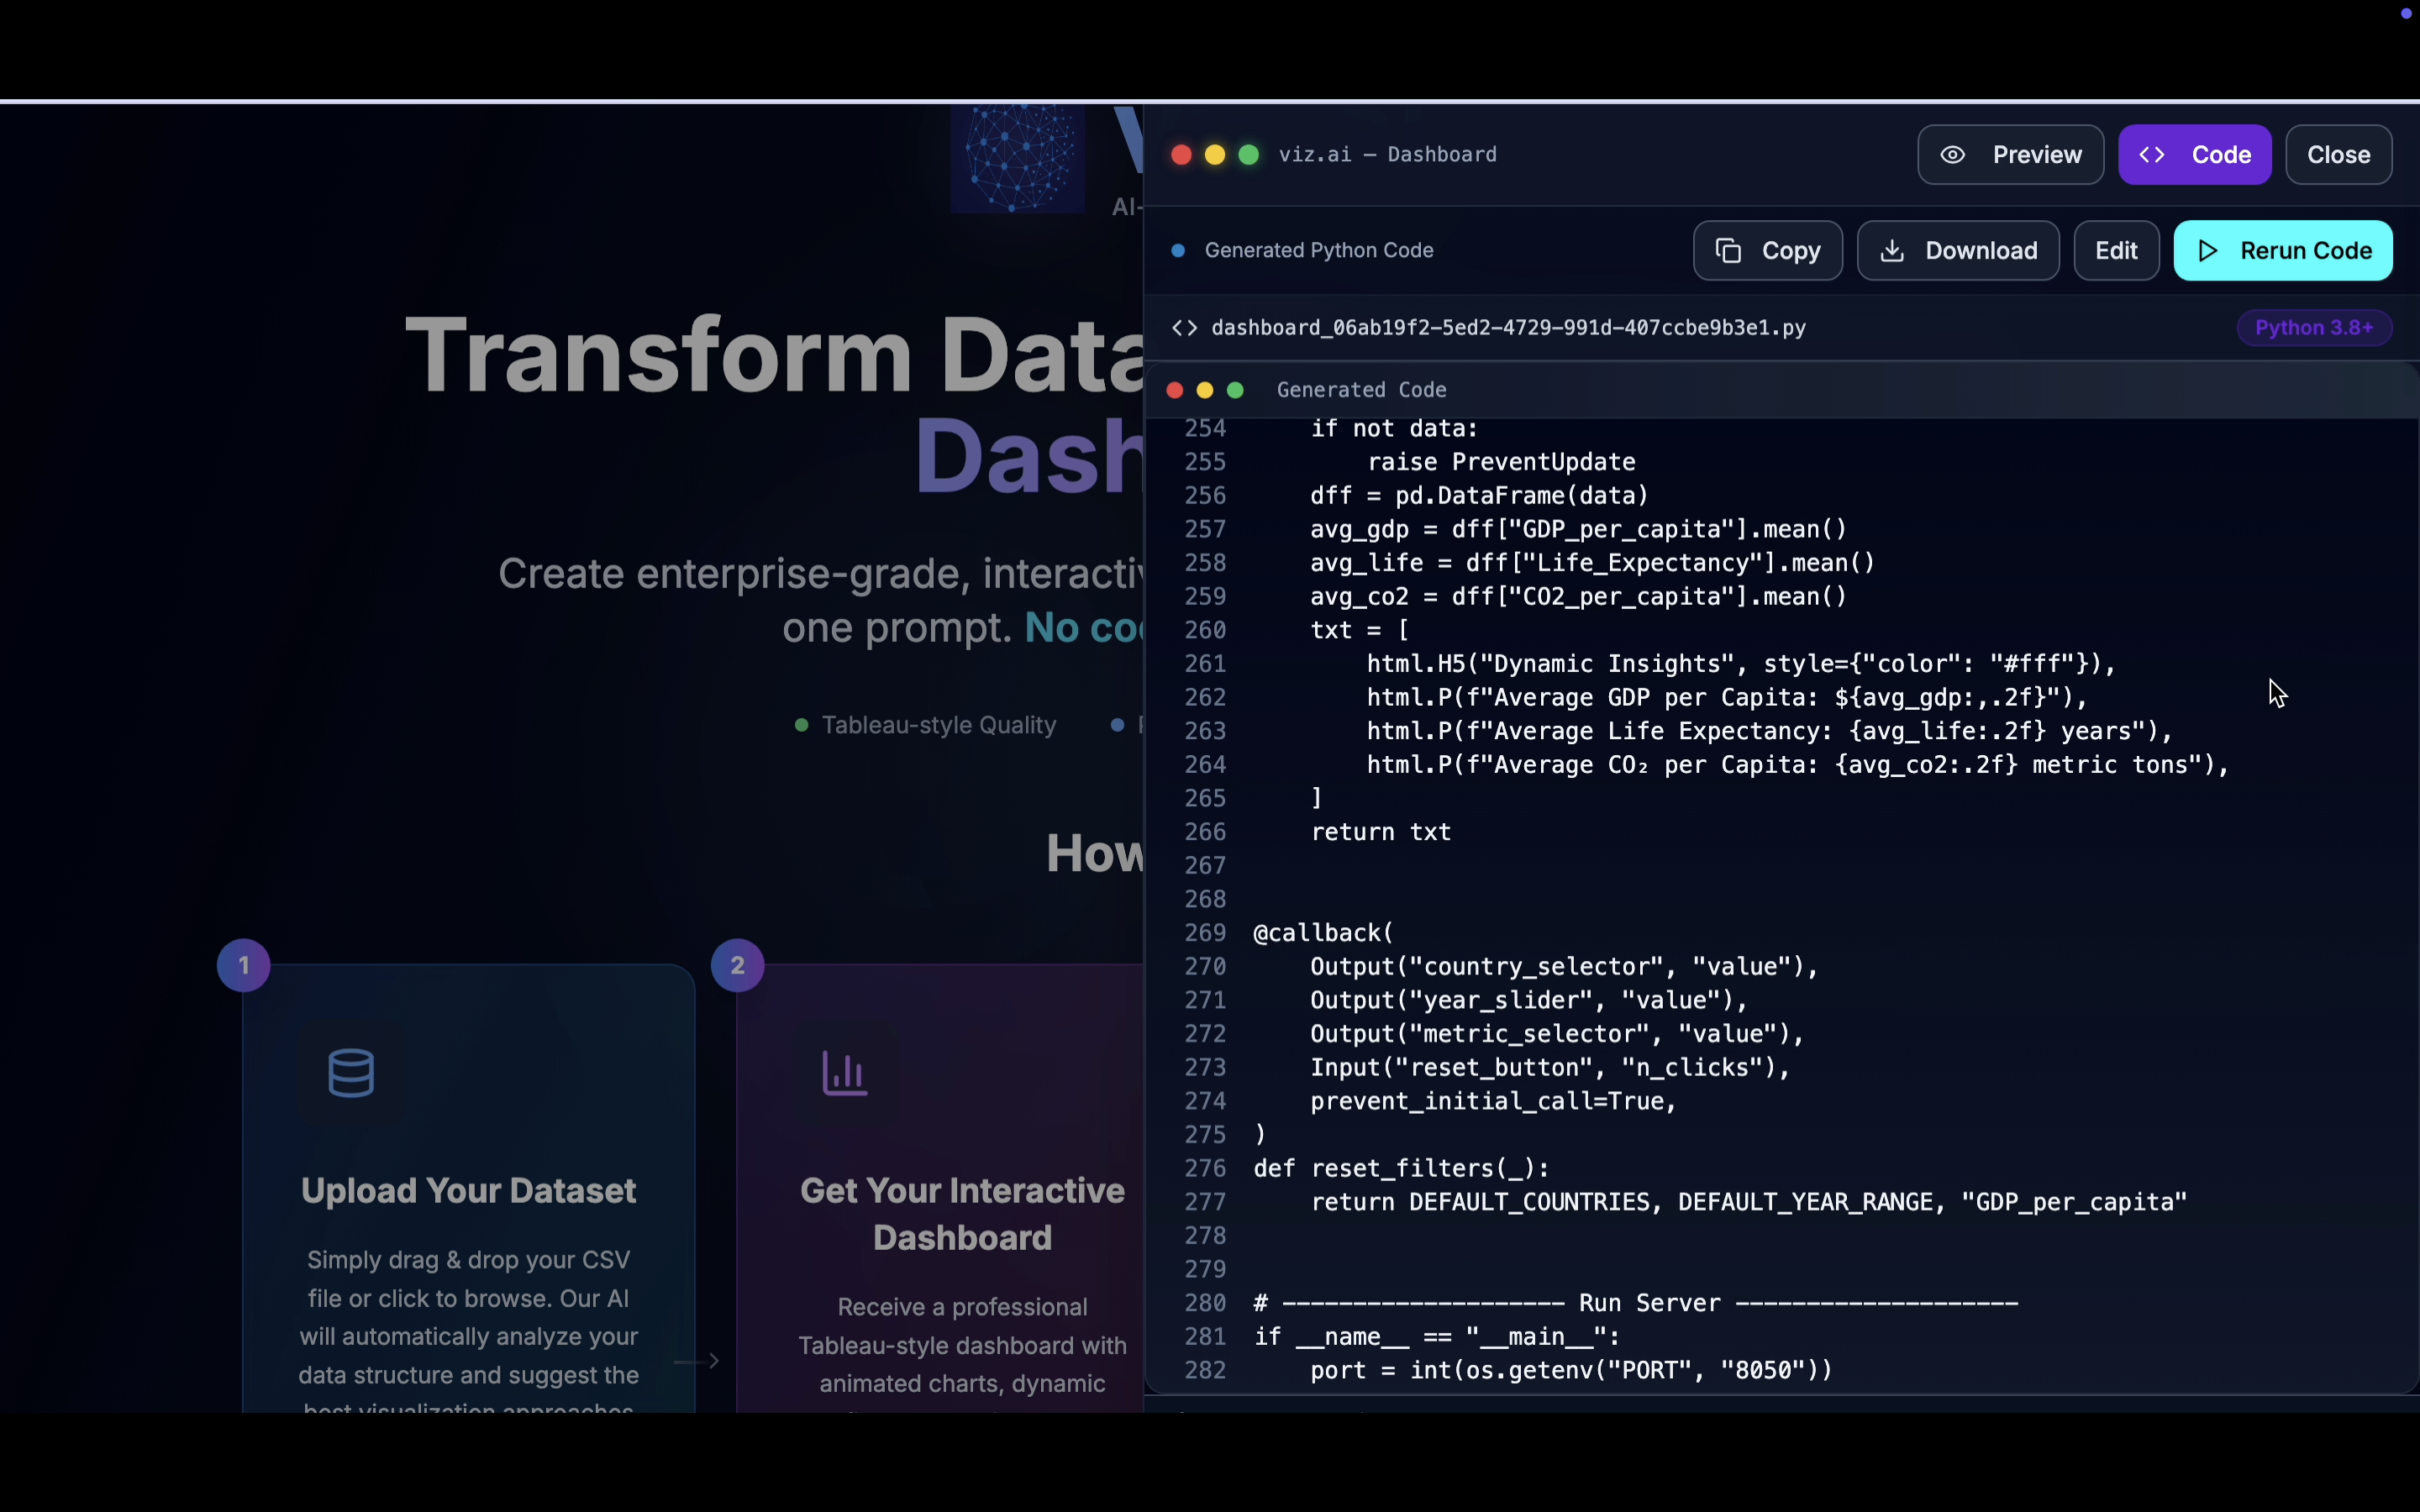
- Produces a fully editable dashboard codebase the user can view, refine, and rerun.
In short, one prompt = a fully working, highly polished, interactive data visualization dashboard.
How I built it
I designed viz.ai as a multi-LLM orchestration pipeline to overcome context and reasoning limits:
- Dataset Analysis Agent – An OSS LLM (meta-llama/llama-4-scout-17b-16e-instruct) ingests the dataset and produces a comprehensive analysis summary (field types, correlations, temporal aspects, categorical distributions, etc.).
- RAG Retrieval Engine – Using ChromaDB vector embeddings, we retrieve the closest matches from a large example dataset containing curated dashboard designs, aesthetic templates, and interaction patterns.
- Dashboard Designer Agent – Another OSS LLM (openai/gpt-oss-20b) converts the analysis + retrieved patterns into a complete dashboard specification (plots, filters, control panels, animation logic, insights panel, aesthtics, colour schemes acccording to the type od data, etc.).
- Code Generator Agent – (openai/gpt-oss-120b) Generates the actual
pythoncode for the dashboard according to the design specifications and aesthetics. - Refinement Agent – A separate LLM model refines and optimizes the generated code and adds the Insights Panel logic.
- Auto-Fix Pipeline – Executes the dashboard code in a sandbox. If errors occur, the pipeline automatically diagnoses and fixes them before presenting the dashboard to the user.
Users can then interactively command viz.ai to adjust visuals, aesthetics, or plots, with all changes propagated automatically by oss llms.
Challenges I ran into
- First-time LLM orchestration: Combining multiple open-source LLMs to work as a pipeline required designing clear interfaces and intermediate JSON schemas.
- Context window limits: Large datasets would exceed model limits, so I implemented pre-summarization and segmented analysis.
- Consistent aesthetics: Ensuring a cohesive look across automatically chosen plots required a robust aesthetic engine linked to dataset metadata.
- Autonomous error correction: Designing the self-healing pipeline to catch and fix code execution errors was non-trivial but essential for a smooth UX.
Accomplishments that I am proud of
- Building a completely automated “prompt-to-dashboard” pipeline.
- Achieving dataset-aware aesthetics — colors, interactions, and animations tuned automatically to the dataset content.
- Integrating a dynamic Insights Panel that produces evolving commentary as users interact with the dashboard.
- Enabling users to view, edit, and rerun dashboards directly from the generated codebase, merging transparency with usability.
What I learned
- Multi-agent architectures dramatically extend what LLMs can do beyond a single prompt.
- Retrieval-augmented generation (RAG) paired with curated examples improves output quality and consistency.
- Building dashboards isn’t just about plotting; data storytelling (insights, narration, and interaction) drives adoption.
- Automated code execution + self-repair loops are key to production-grade AI agents.
What's next for viz.ai
Handle much larger datasets: Scale beyond the current ~150×10 CSV limit by implementing smart chunking, distributed pre-analysis, and streaming ingestion pipelines so users can upload enterprise-scale datasets.
Persistent user memory via database integration: Build a secure, cloud-hosted database (already partially deployed on AWS) to store:
- User interaction histories
- Dashboard refinements and preferences
- Generated insights and analytics logs
This will allow session continuity, richer personalization, and context-aware improvements over time.
- User interaction histories
Multi-user support and collaboration: Enable real-time, collaborative editing of dashboards with role-based permissions, team workspaces, and shared interaction histories so multiple stakeholders can iterate on the same dashboard.
Enhanced recommendation engine: Use the stored interaction data to train models that recommend better visualizations, filters, or insights for similar future datasets.
Advanced analytics and forecasting: Integrate time-series modeling, anomaly detection, and forecasting plots directly into dashboards to move from descriptive to predictive analytics.


Log in or sign up for Devpost to join the conversation.