-
-

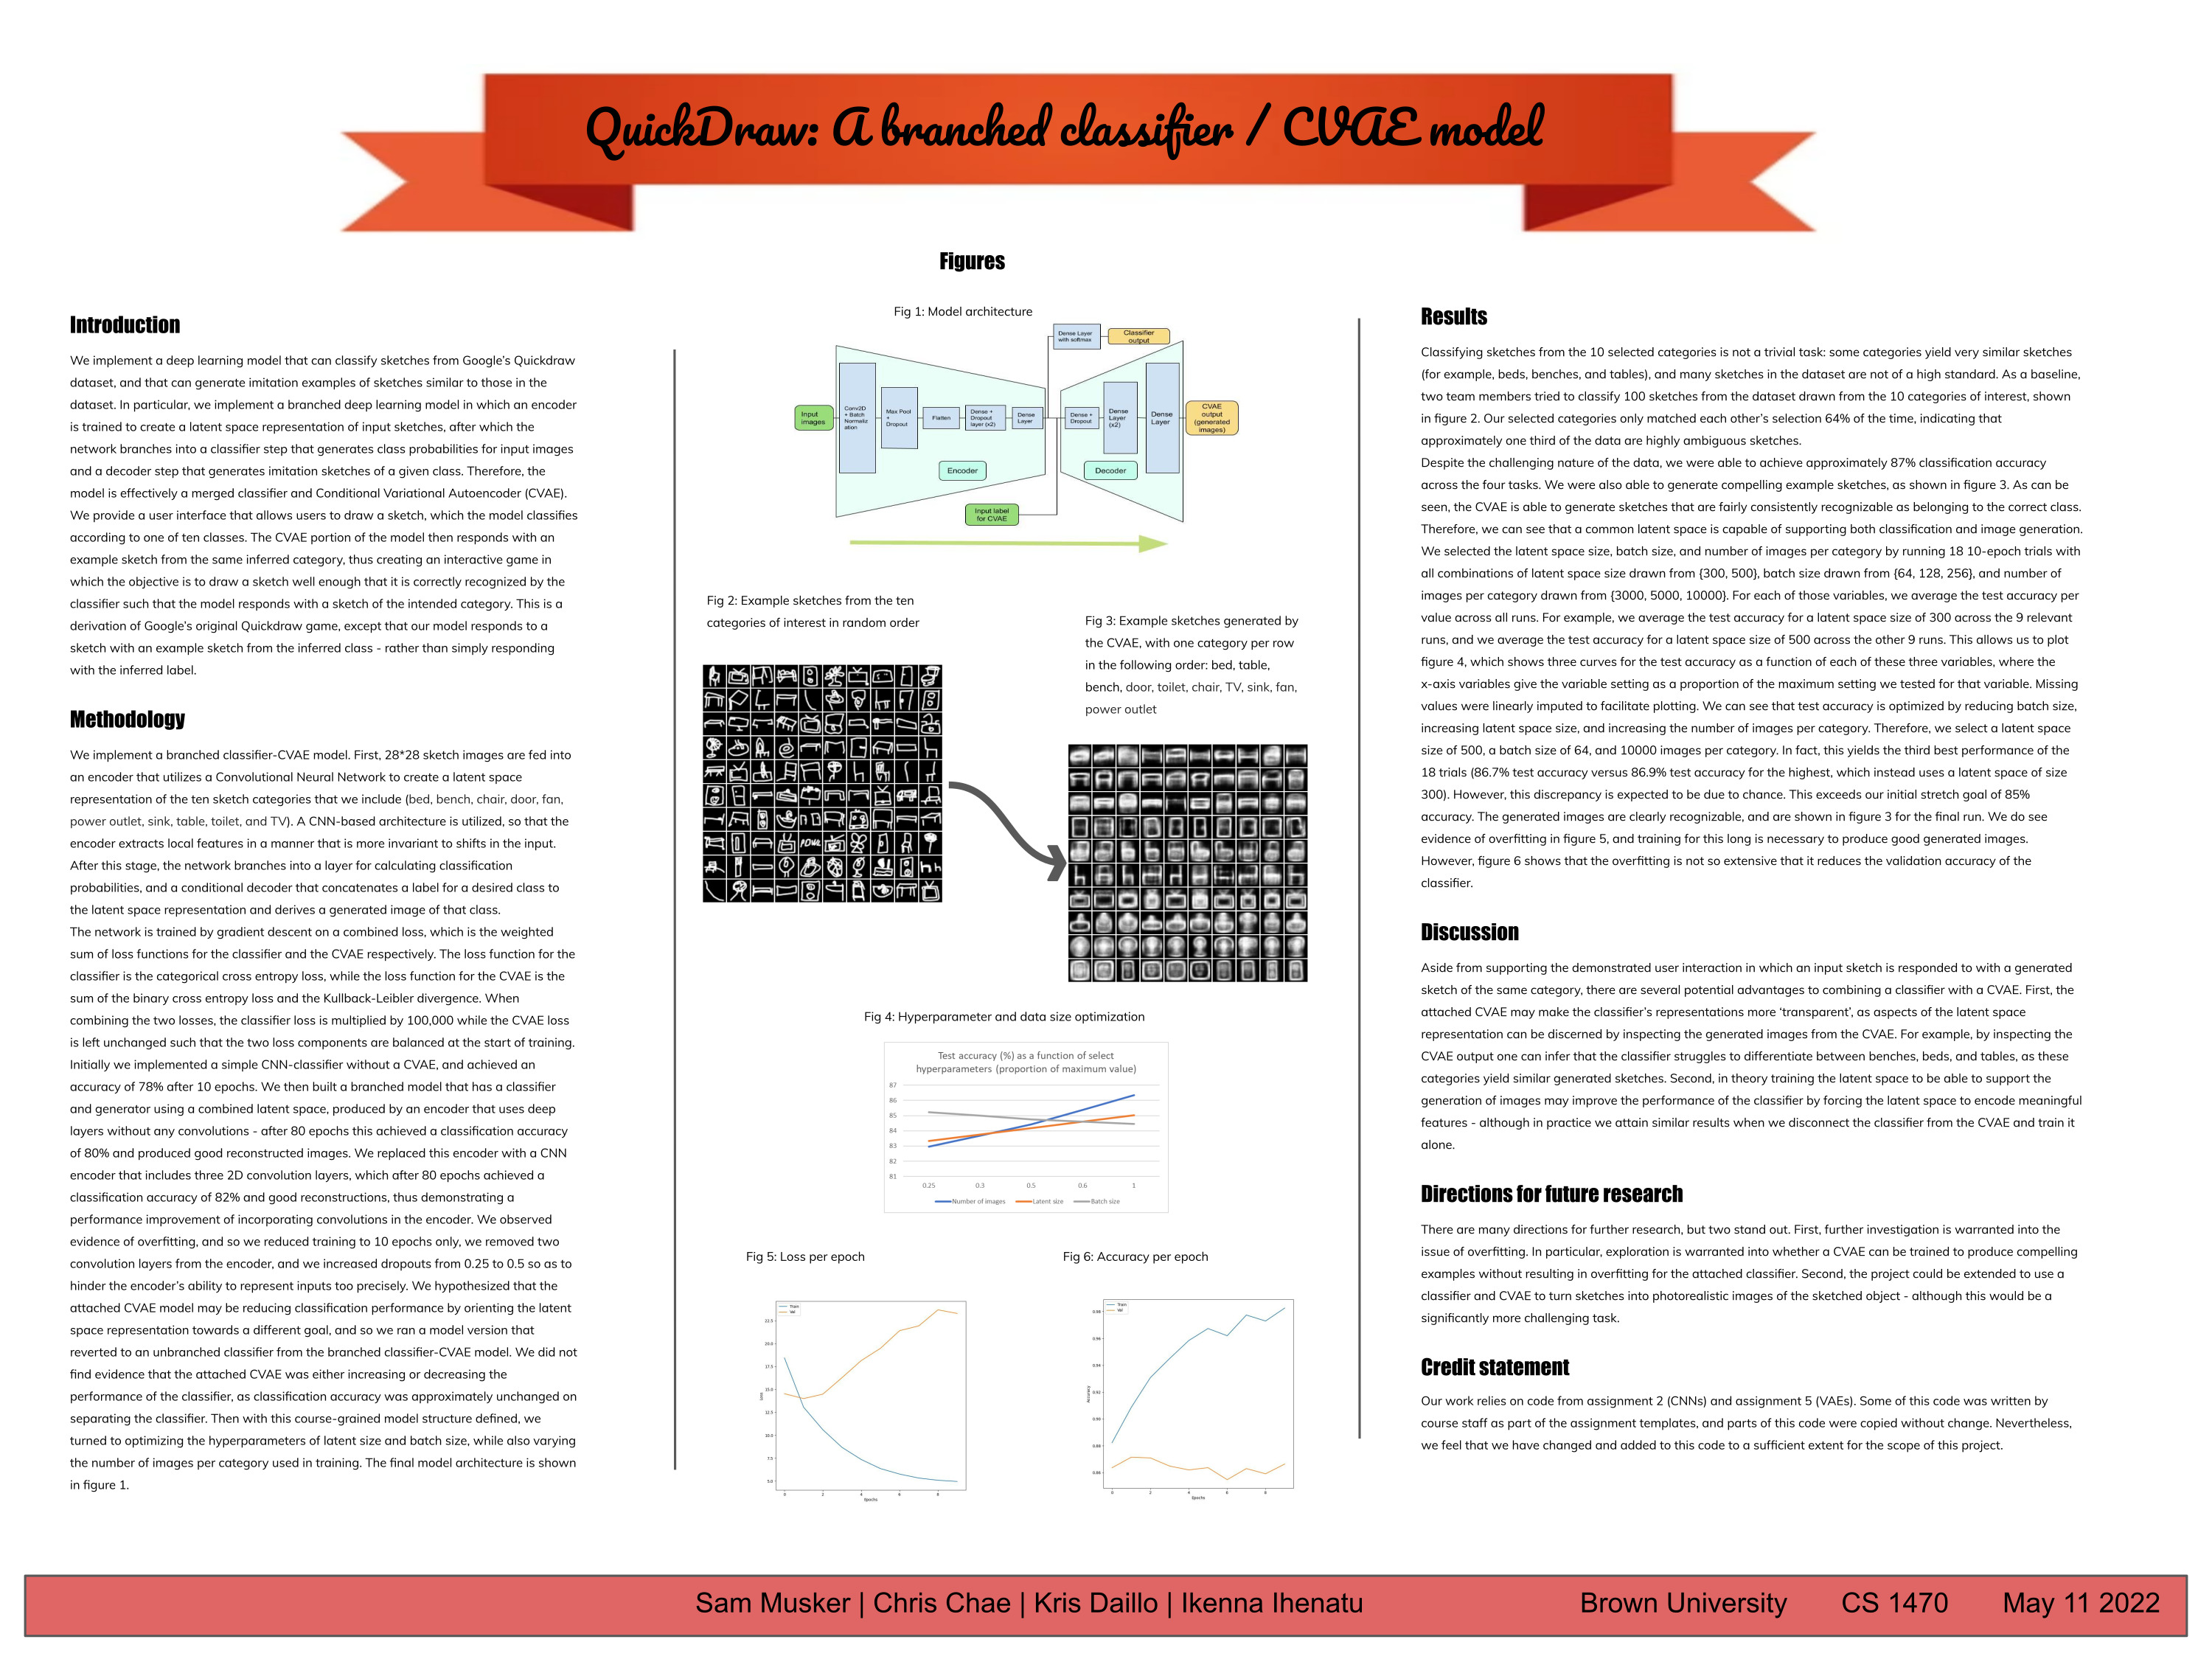
Final project poster
*Please note that this text is from an earlier submission. For the final project writeup, please see the second link in the "Try it out links" section.
Title: Brunonian QuickDraw by the Sasketchewan Selects
Team Members: Kenny Ihenatu [iihenatu], Kris Diallo [kdiallo2], Chris Chae [cchae2], Samuel Musker [smusker]
Introduction: Google’s Quickdraw is an online game that challenges players to draw a picture of an object or idea and then uses artificial intelligence to guess what the drawings represent. The AI learns from each drawing, increasing its ability to guess correctly in the future. The game is similar to Pictionary in that the player only has a limited time to draw. The concepts/objects that it guesses can be simple, like 'foot', or more complicated, like ‘bird migration’. We all enjoyed this application as a kid but had no idea of the actual mechanics that were behind the game’s main appeal. This led us to the idea of creating our own version of Google’s Quickdraw, albeit a simplified one dealing with a much smaller dataset of objects. Implementing QuickDraw will involve classification, seeing as how we are largely dealing with identifying what the drawn submitted image is. We expect a lot of the framework and ideation for our code will draw largely on Homework 2, the convolution neural network project.
Relevant literature: I will briefly summarize Kunuhiko Fukushima’s 1980 paper titled ‘Neocognitron: A Self-organizing Neural Network Model for a Mechanism of Pattern Recognition Unaffected by Shift in Position’ (https://www.cs.princeton.edu/courses/archive/spr08/cos598B/Readings/Fukushima1980.pdf ). Wikipedia credits Fukushima’s paper as introducing the crucial components of a CNN, namely convolution and downsampling layers. Fukushima credits the work of Hubel and Wiesel in the 1950s and 1960s as inspiration for his work. Interestingly, he also makes several references to the ‘gestalt’ nature of visual object recognition, an apparent result of the influence of the early-20th century gestalt perceptual psychologists, as exemplified in Metzger’s ‘Laws of Seeing’ (1936). In 1981, Hubel and Wiesel would go on to win the Nobel Prize in physiology for their work on the visual system of cats, in which they discovered ‘simple’ cells feeding into ‘complex’ cells in the visual cortex, picking up increasingly abstract levels of features from local regions of stimulus in the visual field. Early cell layers were shown to be responsive to primitives like lines and circles, while later cell layers were shown to be responsive to progressively more complex features. Fukushima uses this as the inspiration for his algorithm, in which he proposes a multi-layer neural network with excitatory and inhibitory connections, in which low-level cells are responsive to local regions of the visual field, with progressively more sparse layers of cells responsive to correspondingly larger segments of the visual field. Fukushima identifies two advantages to his algorithm. First, his algorithm promotes invariance to spatial shifts in the inputs: this is because low-level layers corresponding to ‘simple’ cells are responsive to local features, wherever they appear. Second, his algorithm prevents an explosion of required networks cells with an increase in the number of image classification bins. This is because low-level cells are expected to be re-used efficiently across tasks, as basic visual features such as lines and circles are expected to be important in the classification of very many different types of objects. Thus far, the algorithm seems extremely similar to the contemporary CNNs we have been studying. However, two differences should be noted. First, a relatively minor difference is that Fukushima uses ‘spatial averaging’ instead of max pooling, which would be introduced in 1993 by J Weng et al. Second, a large difference is that Fukushima’s algorithm is partially unsupervised. He emphasizes that “The network is self-organized by "learning without a teacher". In section 3, “Self-organization of the Network”, he summarizes the unsupervised component of the algorithm as follows: “At first, several "representative" S-cells are selected from each S-layer every time when a stimulus pattern is presented. The representative is selected among the S-cells which have yielded large outputs, but the number of the representatives is so restricted that more than one representative are not selected from any single S-plane.” So it seems that feature-selection units are selected based on the strength of their activation. How this results in meaningful and useful feature recognition units in the absence of labeled data is opaque to me, although Fukushima does demonstrate successful computation results. Last, a major difference that should be emphasized is that Fukushima does not seem to use backpropagation and gradient descent in the training of the network. These techniques were invented in 1970 by Seppo Linnainmaa, but do not seem to have been employed by Fukushima at this time (https://people.idsia.ch/~juergen/who-invented-backpropagation-2014.html#:~:text=Efficient%20backpropagation%20(BP)%20is%20central,Finnish%20master%20student%20Seppo%20Linnainmaa. ). In conclusion, Fukushima presents a remarkably similar algorithm to modern CNNs, but with important differences. The replacement of unsupervised portions of the algorithm with supervised portions, in addition to the employment of gradient descent with backpropagation, seem to have been crucial developments of the algorithm since then.
Public implementations: https://github.com/anubhavshrimal/Quick-Draw https://github.com/clfkenny/quickdraw-sketch-classifier https://github.com/kolszewska/QuickDrawClassifier/blob/master/README.md https://github.com/Lexie88rus/quick-draw-image-recognition/blob/master/README.md https://github.com/amelie-vogel/image-classification-quickdraw/blob/master/README.md
Data: What data are you using (if any)? The Quick Draw Dataset is a collection of 50 million drawings across 345 categories, contributed by players of the game Quick, Draw!. The drawings were captured as timestamped vectors, tagged with metadata including what the player was asked to draw and in which country, the player was located. 50 million drawings with 345 categories is a very massive dataset, our plan is to narrow the categories down to about 50 categories which (if somewhat evenly distributed) would be about 144927 drawings
Methodology: What is the architecture of your model? The architecture of the model will be a Convolutional Neural Network with 2dconv layers with pooling, dropout layers, and dense layers. We expect to start with conv layers to identify the features from the images, then using a dropout layer with dense layers alternatively for outputting the prediction for the classification task How are you training the model? We will be feeding the image dataset as 28 x 28 images through a series of convolution and max pooling layers and outputting it into an output space the number of classes we are predicting for If you are implementing an existing paper, detail what you think will be the hardest part about implementing the model here. The hardest part will be processing the data to be compatible with our model and creating a UI through which someone can input their drawings
Metrics: What constitutes “success?” What experiments do you plan to run? We plan to split our quickdraw dataset into train/test, then running our model. We will continue to add layers and add more complexity to the architecture of our model until we reach overfitting For most of our assignments, we have looked at the accuracy of the model. Does the notion of “accuracy” apply for your project, or is some other metric more appropriate? Accuracy is a good metric for our model. Our model aims to correctly guess the real-world object from a hand-drawn image If you are implementing an existing project, detail what the authors of that paper were hoping to find and how they quantified the results of their model. We are not. If you are doing something new, explain how you will assess your model’s performance. We will be calculating the accuracy of our model to assess performance. For example, if the model correctly predicts the labels for 3 of the 5 images, then we would give the model a performance score of 60% accuracy. What are your base, target, and stretch goals? Our base goal is to reach 75% accuracy for 3 classes, target is 75% for 4 classes, and stretch is 85% for 5 classes.
Ethics: Why is Deep Learning a good approach to this problem? Deep learning is ideal because we are classifying images, which machine learning algorithms are not suitable for. We can use convolutional layers to identify features that are prominent in certain classes. What is your dataset? Are there any concerns about how it was collected, or labeled? Is it representative? What kind of underlying historical or societal biases might it contain? We are using the QuickDraw dataset, where each image contains metadata including what the player was asked to draw and in which country the player was located. There might be geographical/societal biases present because the data might be concentrated in a particular country (United States). We can approach this bias by ensuring that each country is represented equally or voice the generalization that this is using data majorly from a single/couple country/countries.
Division of labor: Briefly outline who will be responsible for which part(s) of the project. Kenny: Dataset collection and supporting backend Chris: model implementation/architecture Sam: model implementation/architecture Kris: UI and preprocessing

Log in or sign up for Devpost to join the conversation.