-
-
Logo
-
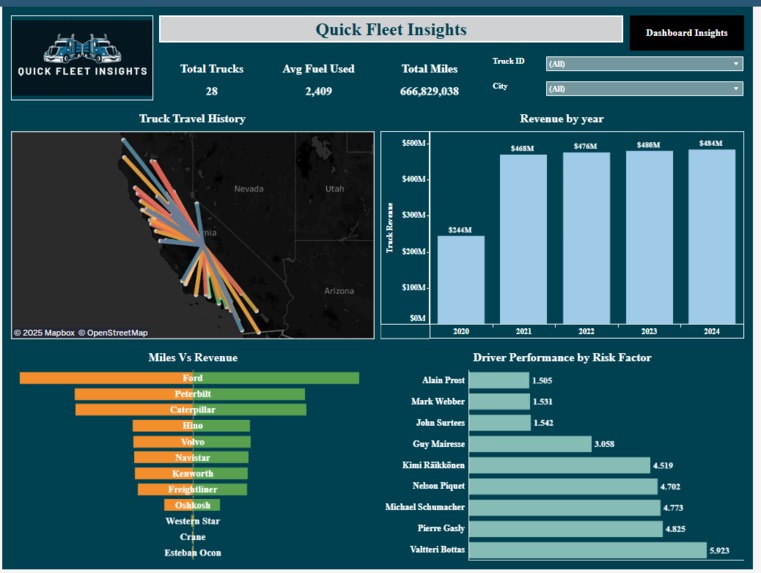
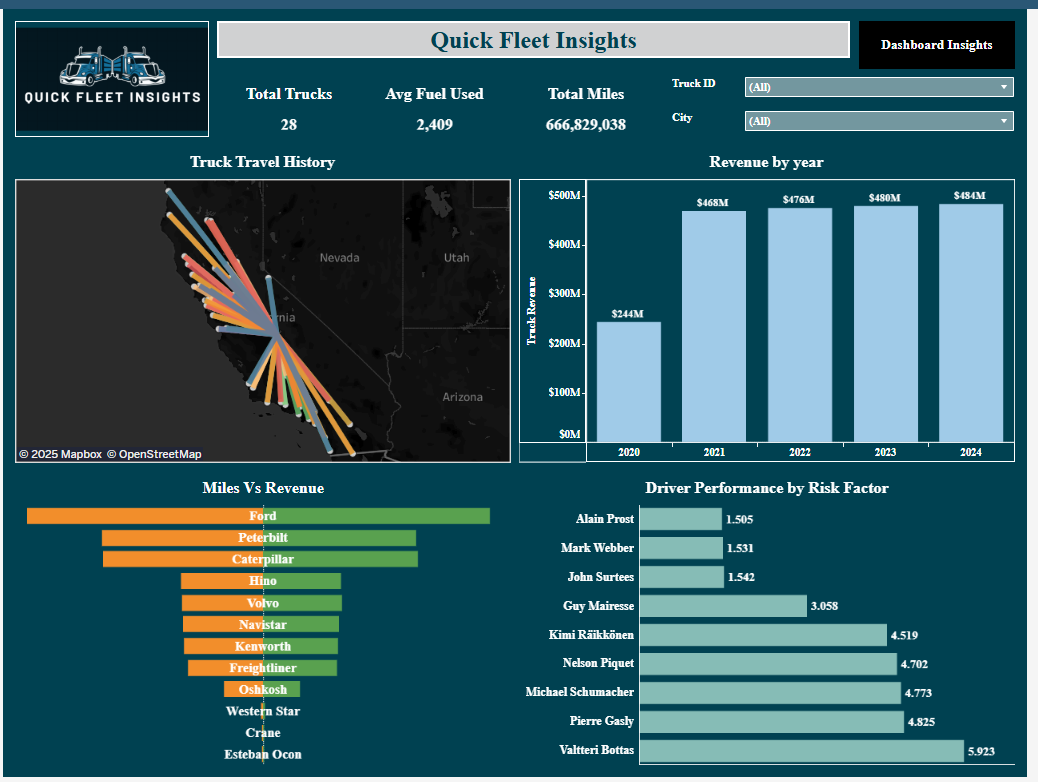
Quick Fleet Insights Dashboard
-
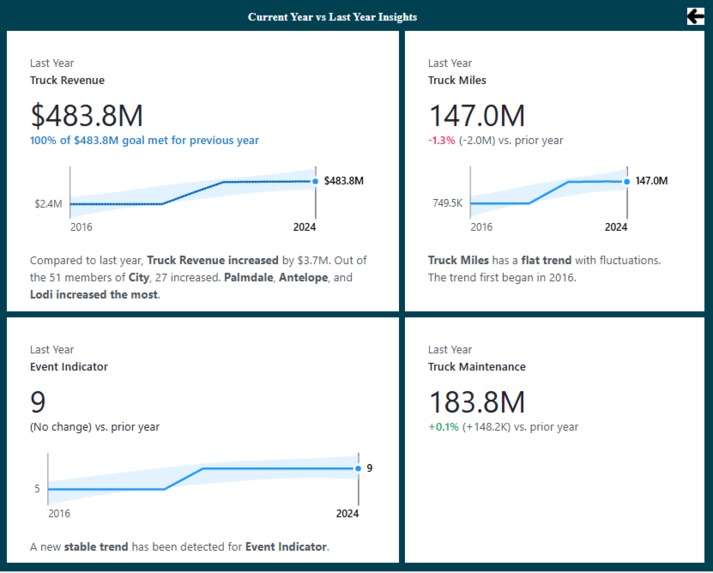
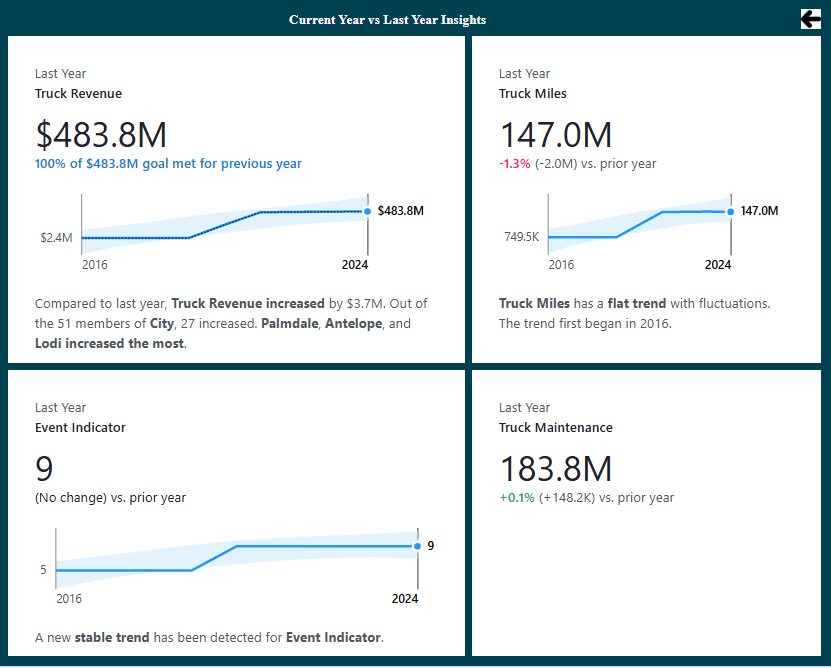
Insights Dashboard - Tableau Pulse
Inspiration
The inspiration behind Quick Fleet Insight was to harness data-driven decision-making to enhance fleet efficiency, reduce costs, and improve driver safety. By leveraging analytics, we aim to transform traditional fleet management into a proactive, insight-driven approach, ensuring optimized routes, predictive maintenance, and better resource utilization.
What it does
Truck availability, maintenance tracking, fuel efficiency, mileage, driver behavior, risk analysis, and revenue contribution.
How we built it
We built the Quick Fleet Insight dashboard in Tableau by integrating multiple data sets, applying calculated fields for performance metrics, and using visual elements like KPI cards, bar charts, and maps. Interactive filters and parameters were implemented to enable dynamic analysis of truck availability, fuel efficiency, and driver behavior.
Challenges we ran into
In Tableau, we faced challenges with handling large datasets efficiently, leading to performance issues in dashboard loading. Additionally, integrating real-time truck movement data and ensuring accurate parameter-driven insights required advanced optimization techniques.
Accomplishments that we're proud of
Implemented KPI cards, bar charts, pie charts, heatmaps, and geographical maps analytics on truck status, revenue, fuel efficiency, and risk assessment.
What we learned
We learned how to leverage data analytics to optimize truck availability, fuel efficiency, and driver performance, reducing costs and improving operational efficiency. Additionally, predictive insights help in proactive maintenance and risk management.
What's next for Quick Fleet Insights
Enhance predictive maintenance, refine risk scoring models, and integrate real-time alerts for proactive decision-making.
Built With
- ai-features
- tableaucloud
- tableauprep
- tableaupulse

Log in or sign up for Devpost to join the conversation.