-
Start Page
-
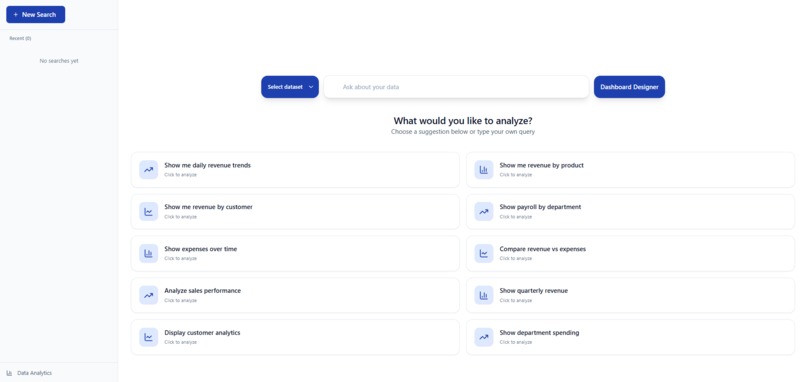
Home Page
-
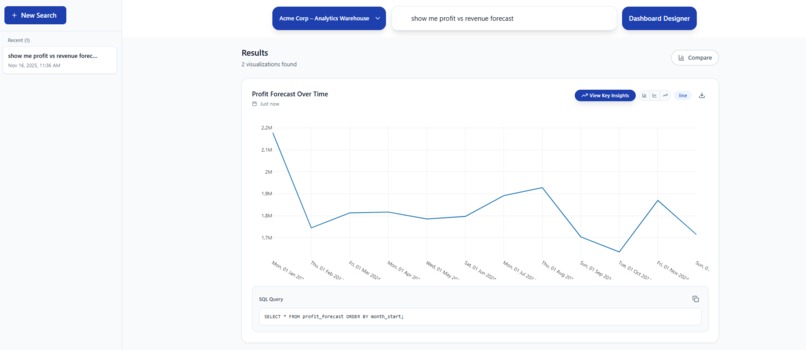
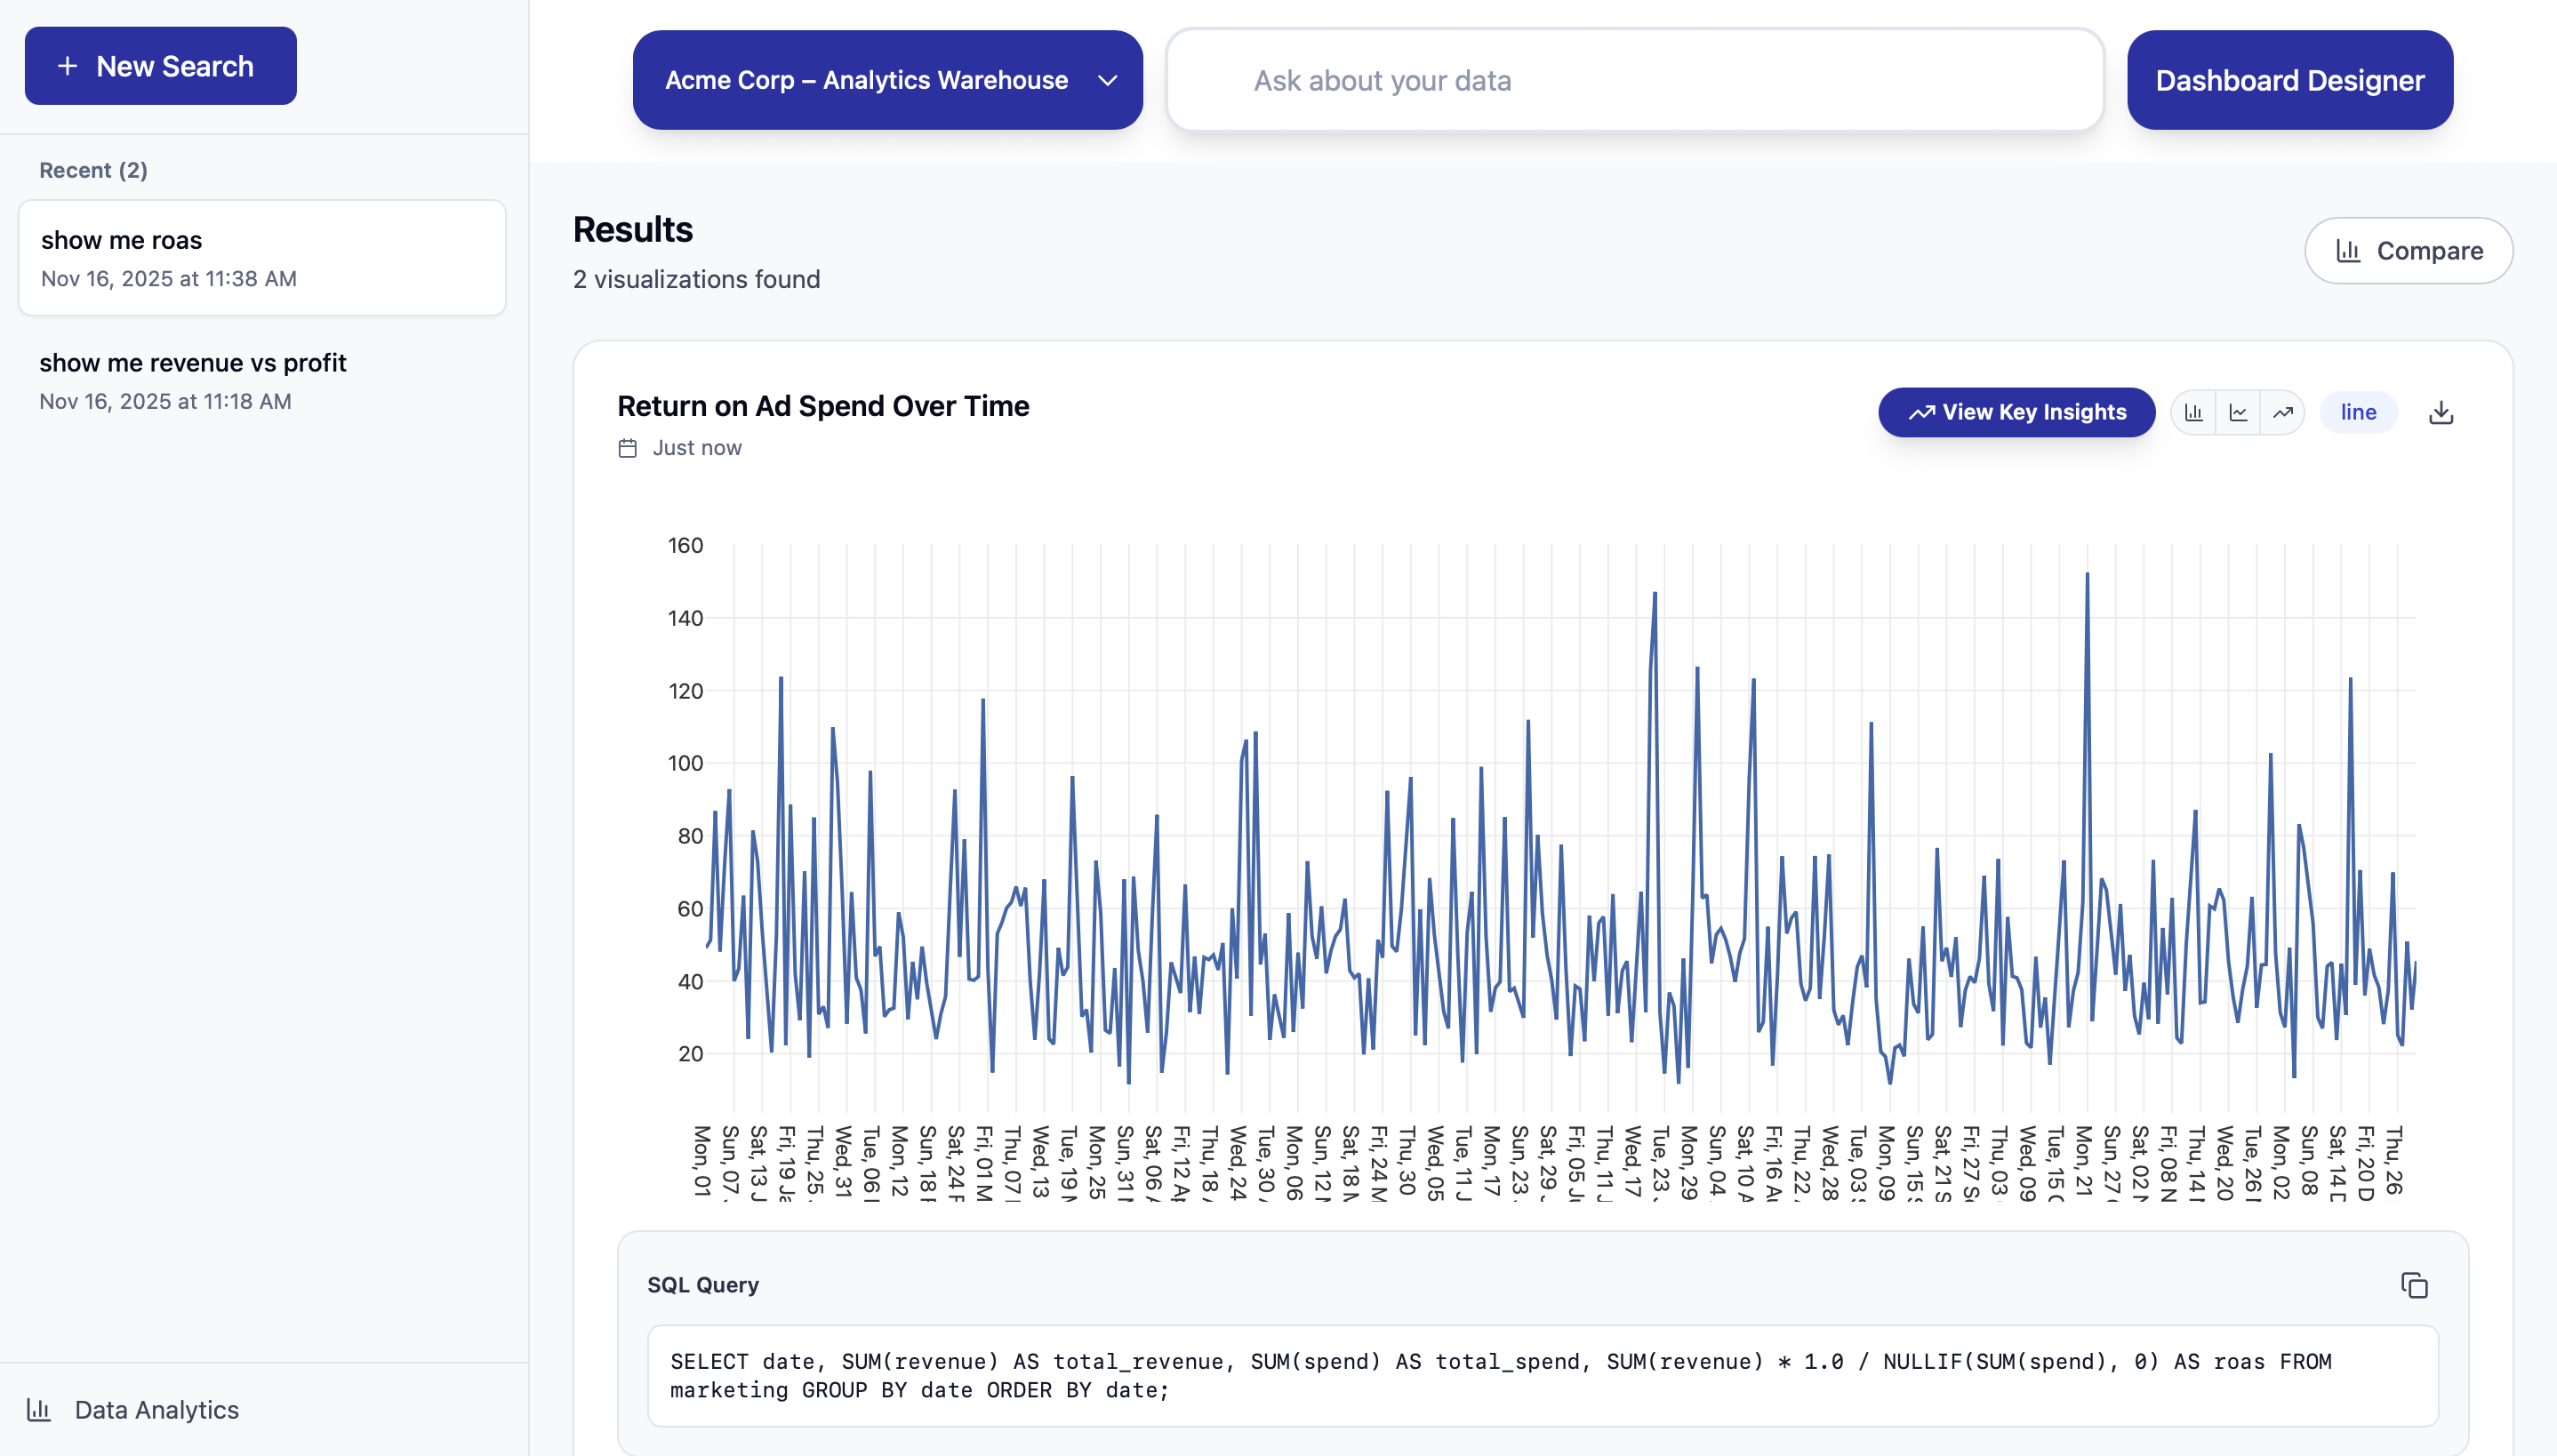
Generated Graphs from Natural Language
-
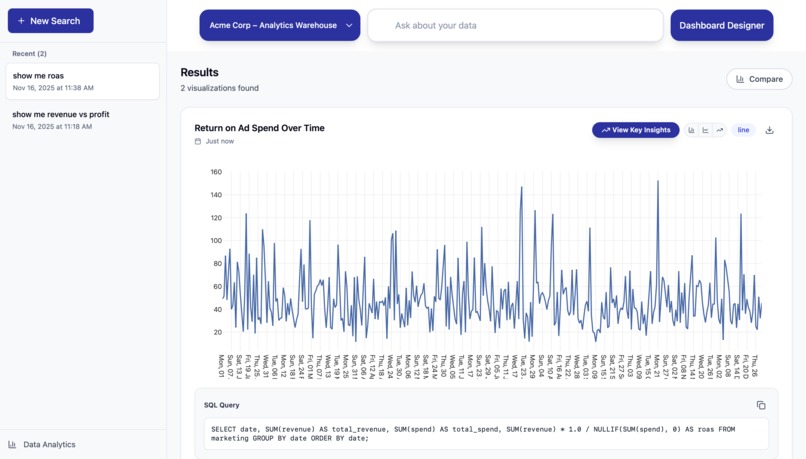
Plot generated when prompted
-
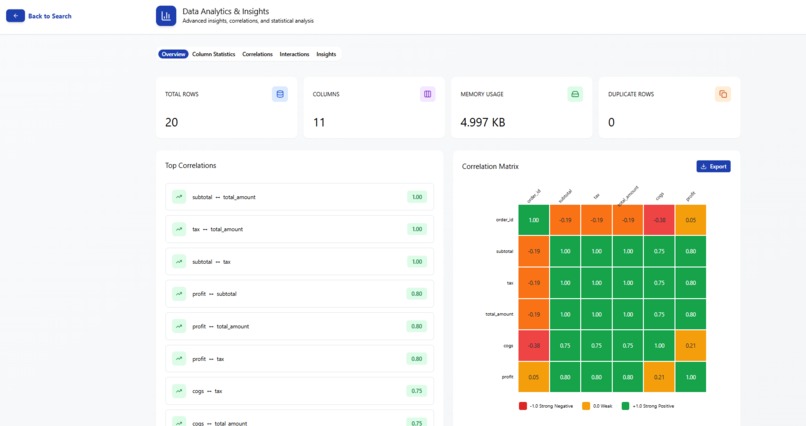
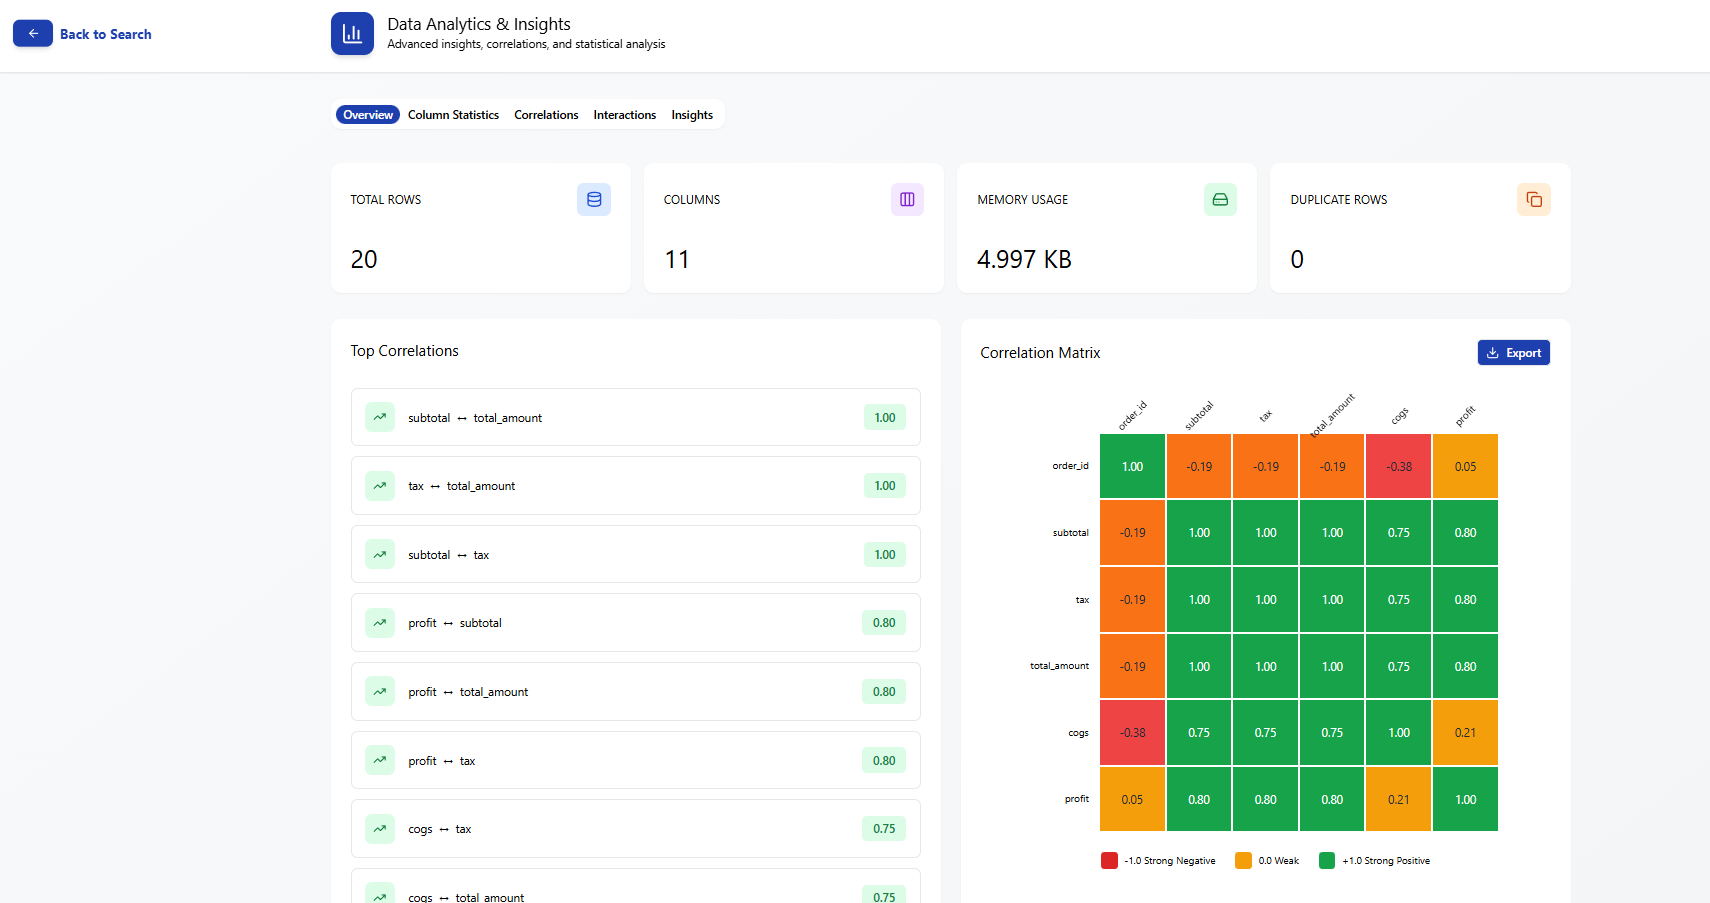
Insight with Correlation Matrix
-
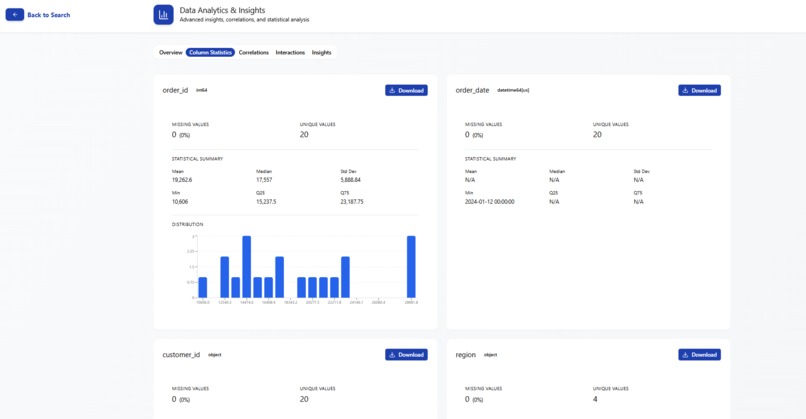
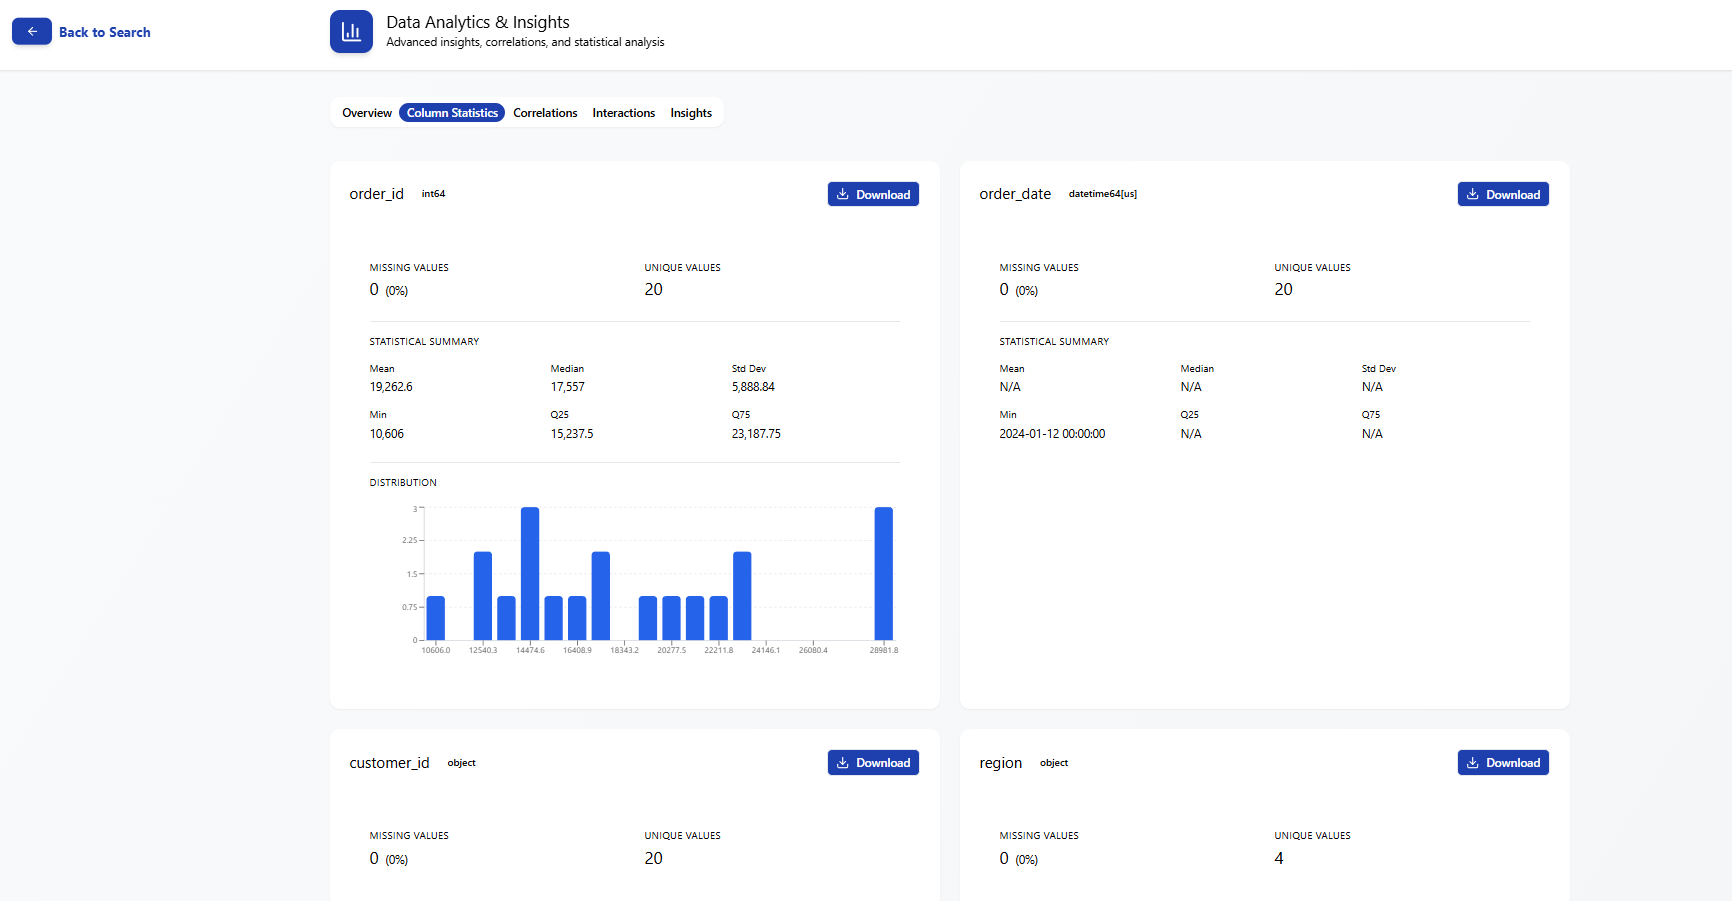
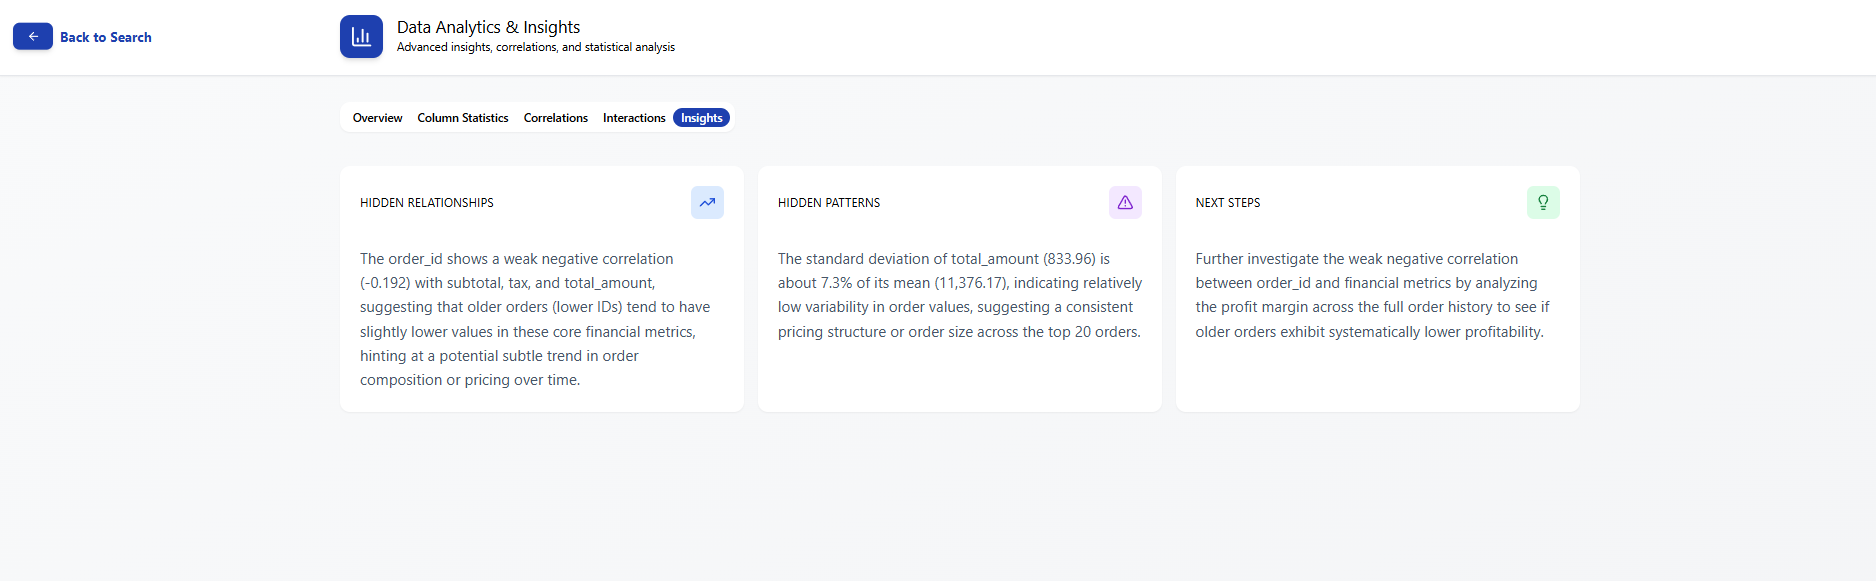
Insight Statistics
-
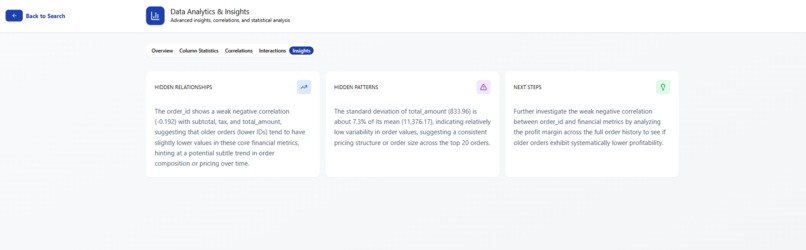
Generated Insights
-
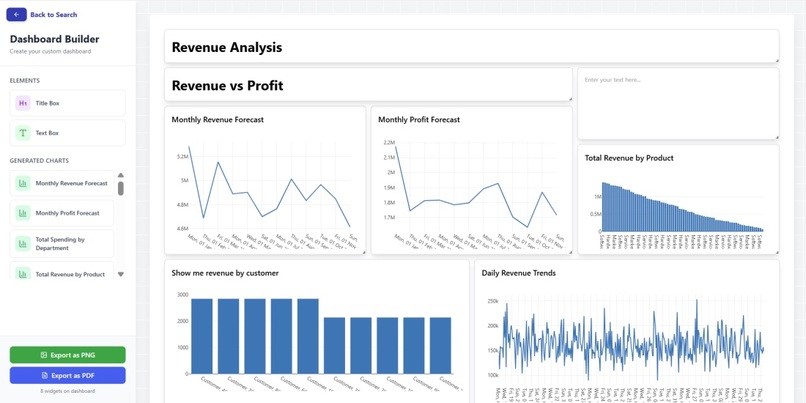
Dashboard Builder


Inspiration & Explanation
Modern organizations generate massive amounts of data, but turning that data into actionable insights is still painfully slow. Traditional BI tools are powerful yet dense, often requiring SQL fluency, dashboard expertise, and multiple layers.
Queryon reimagines analytics from the ground up. We eliminate the technical barrier entirely by letting users interact with enterprise datasets conversationally. Simply ask a question, and Queryon will combine natural language understanding, intelligent visualization models, and clean UI/UX to turn questions into immediate visual insights.
Data shouldn’t be locked behind technical skill. With Queryon, users can interact with their data naturally, while the system handles the complexity behind the scenes (understanding intent, generating the right queries, and presenting visualizations that make immediate sense).
Unlike many AI tools, Queryon never exposes your sensitive data to the model. The LLM never actually sees your records or buisness data.
What it does
Queryon transforms raw data into insights through a simple, conversational interface. A user can ask a question in plain English, and the platform instantly handles the heavy lifting by generating SQL through the Gemini API, selecting the optimal visualization with ML, and producing interactive charts through Plotly.
But Queryon goes beyond visualization. It surfaces meaningful insights, provides summaries and trend highlights, and allows users to assemble custom dashboards tailored to their business needs. Everything is designed with clarity, speed, and non-technical usability in mind, enabling organizations to make smarter, data-driven decisions without technical bottlenecks.
Tech Stack
- frontend: developed with React, Tailwind CSS, and TypeScript for a responsive, interactive interface
- backend: build using Python and flask to handle API requests, execute SQL queries, process datasets, and interface with the Gemini API
- database: powered by DuckDB to efficiently execute dynamically generated SQL with minimal overhead
- natural language → sql: we used the Gemini API to translate natural language prompts to precise SQL queries to retrieve the data needed for our interactive visualizations
- UI/UX: designed in Figma with a focus on clarity, and accessibility
Challenges & What we learned
- Integrating natural language → Gemini → SQL → DuckDB → Plotly into one seamless pipeline
- Handling ambiguous or incomplete natural language queries
- Automatically selecting the right visualization for different data types
When everything is connected, everything matters. A small issue in one component cascades into problems with visualization, insight extraction, and even dashboard layout. Full-stack thinking was essential.
Accomplishments that we're proud of
Developing an awesome set of features including ...
- natural language querying
- query suggestions
- graph comparisons
- interactive visualizations
- customizable chart types
- visualization exports
- conversation history
- multi-source data connections
- dashboard builder
What's next for Queryon
- Enterprise Integrations: Connect to BigQuery, Snowflake, AWS RDS, and company-specific systems
- Security: Add encryption, audit logs, and role-based access control for enterprise readiness
- Automated Insights: Allow organizations to receive automated insights without running manual queries
- Scalable Dashboard Workspaces: Enable teams to create, share, and version dashboards across departments


Log in or sign up for Devpost to join the conversation.