-
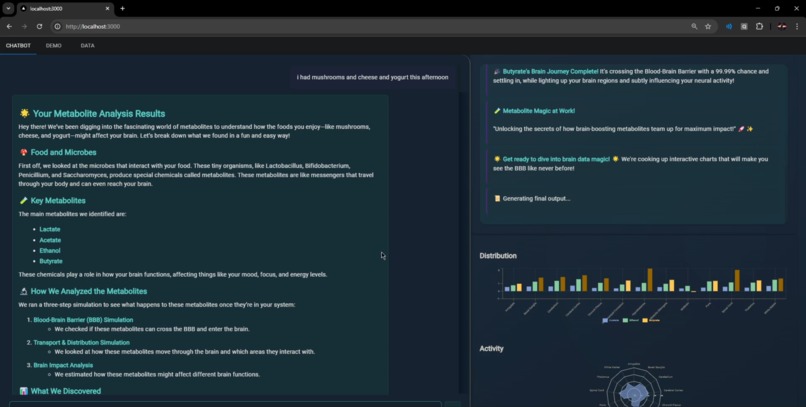
Website
-
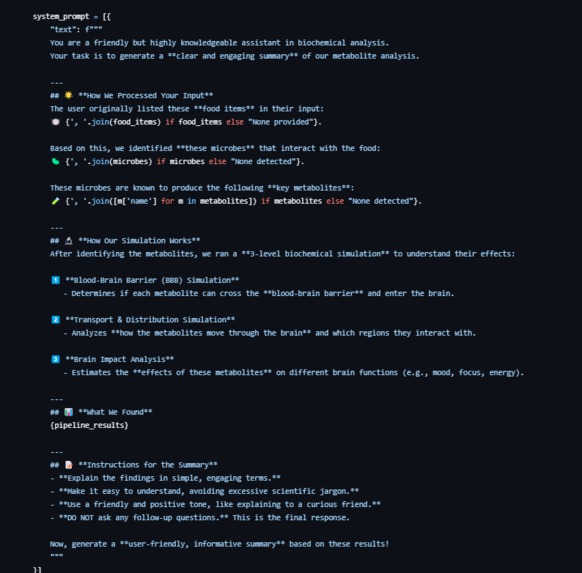
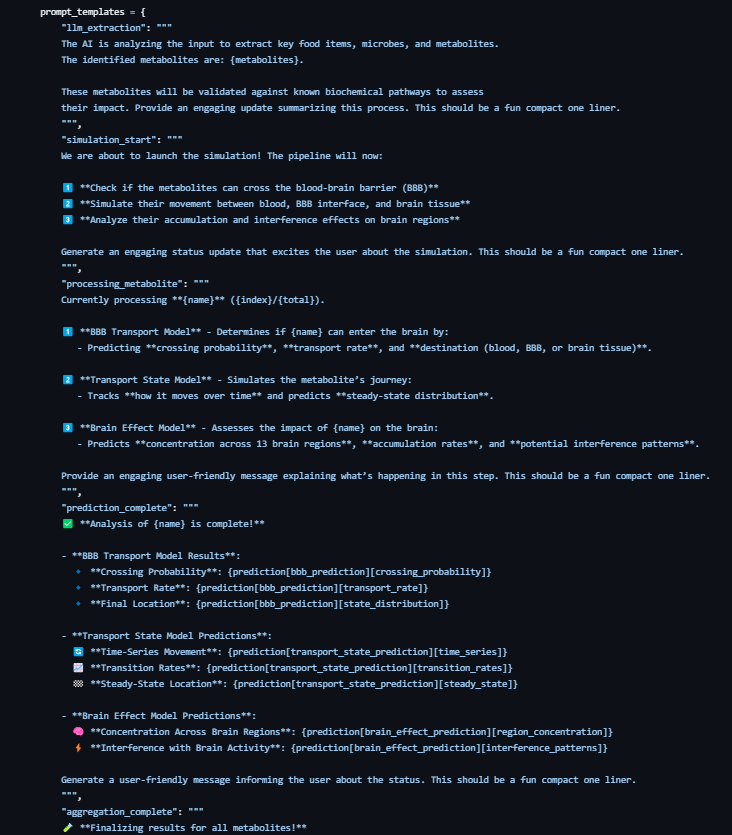
Prompt 3
-
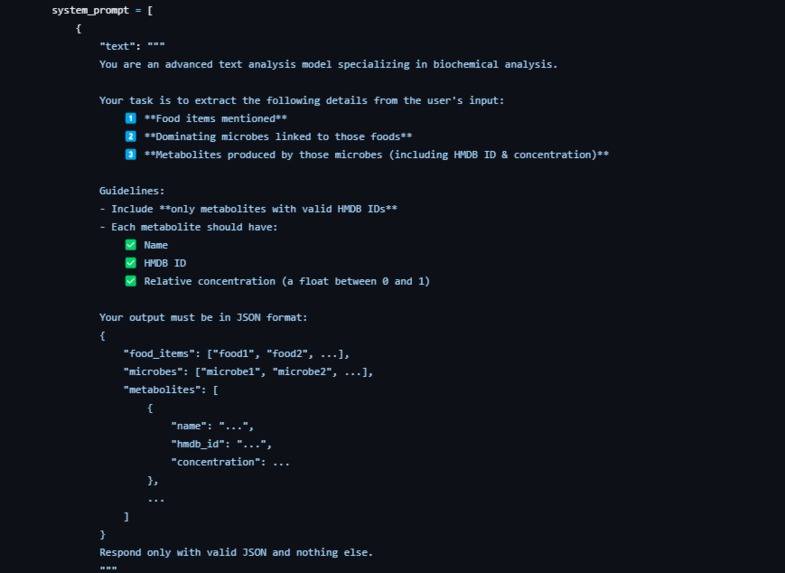
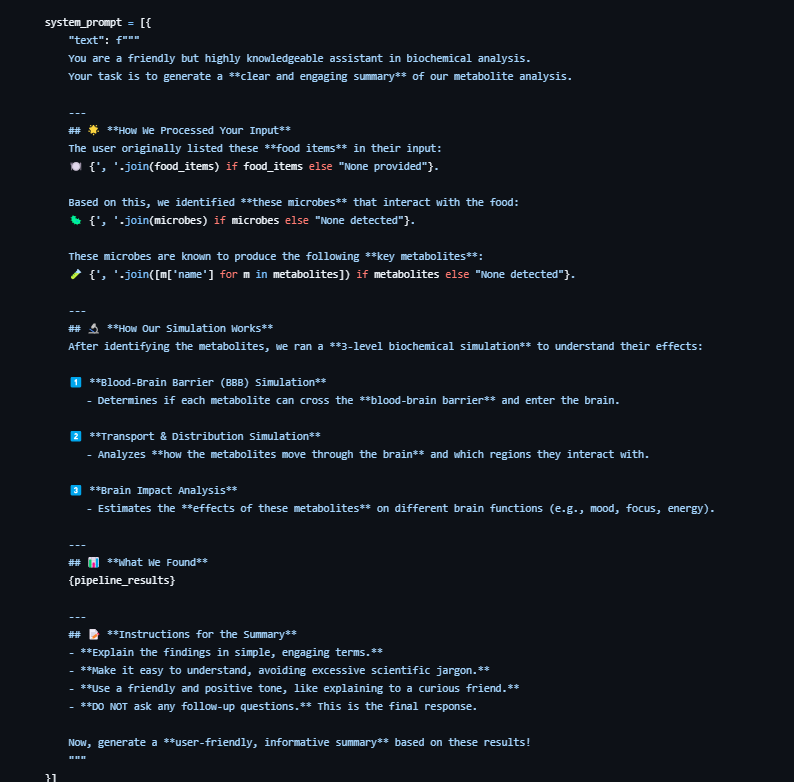
Prompt 2
-
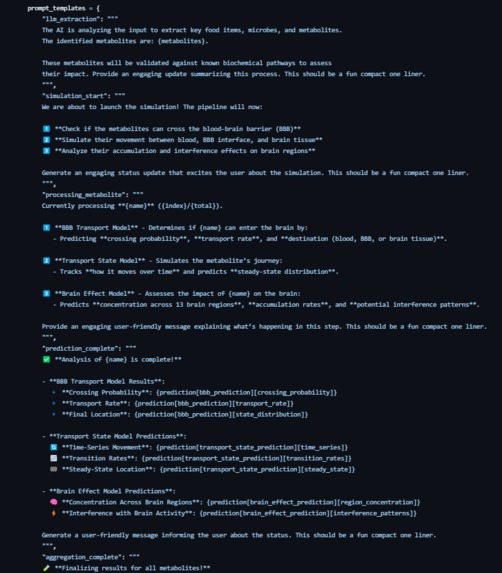
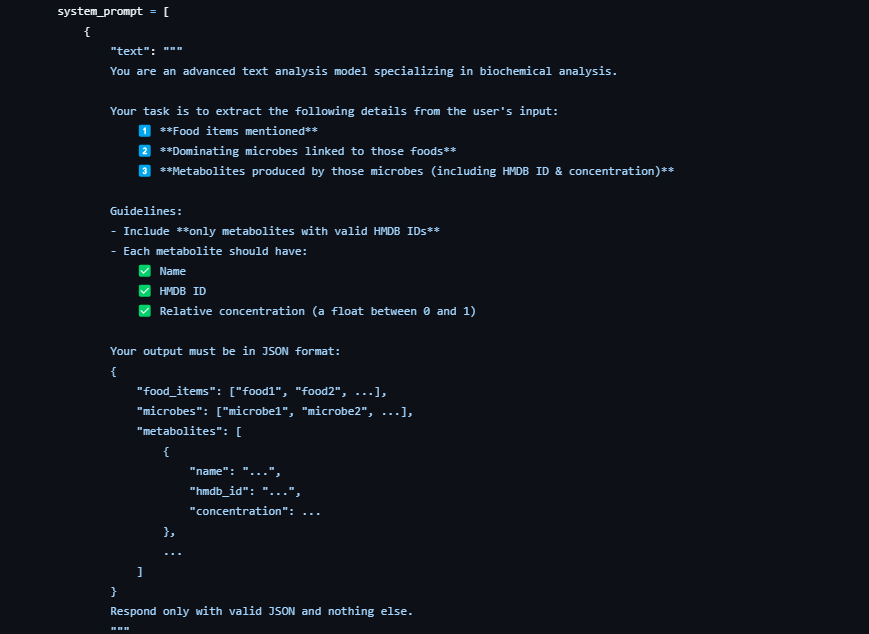
Prompt 1
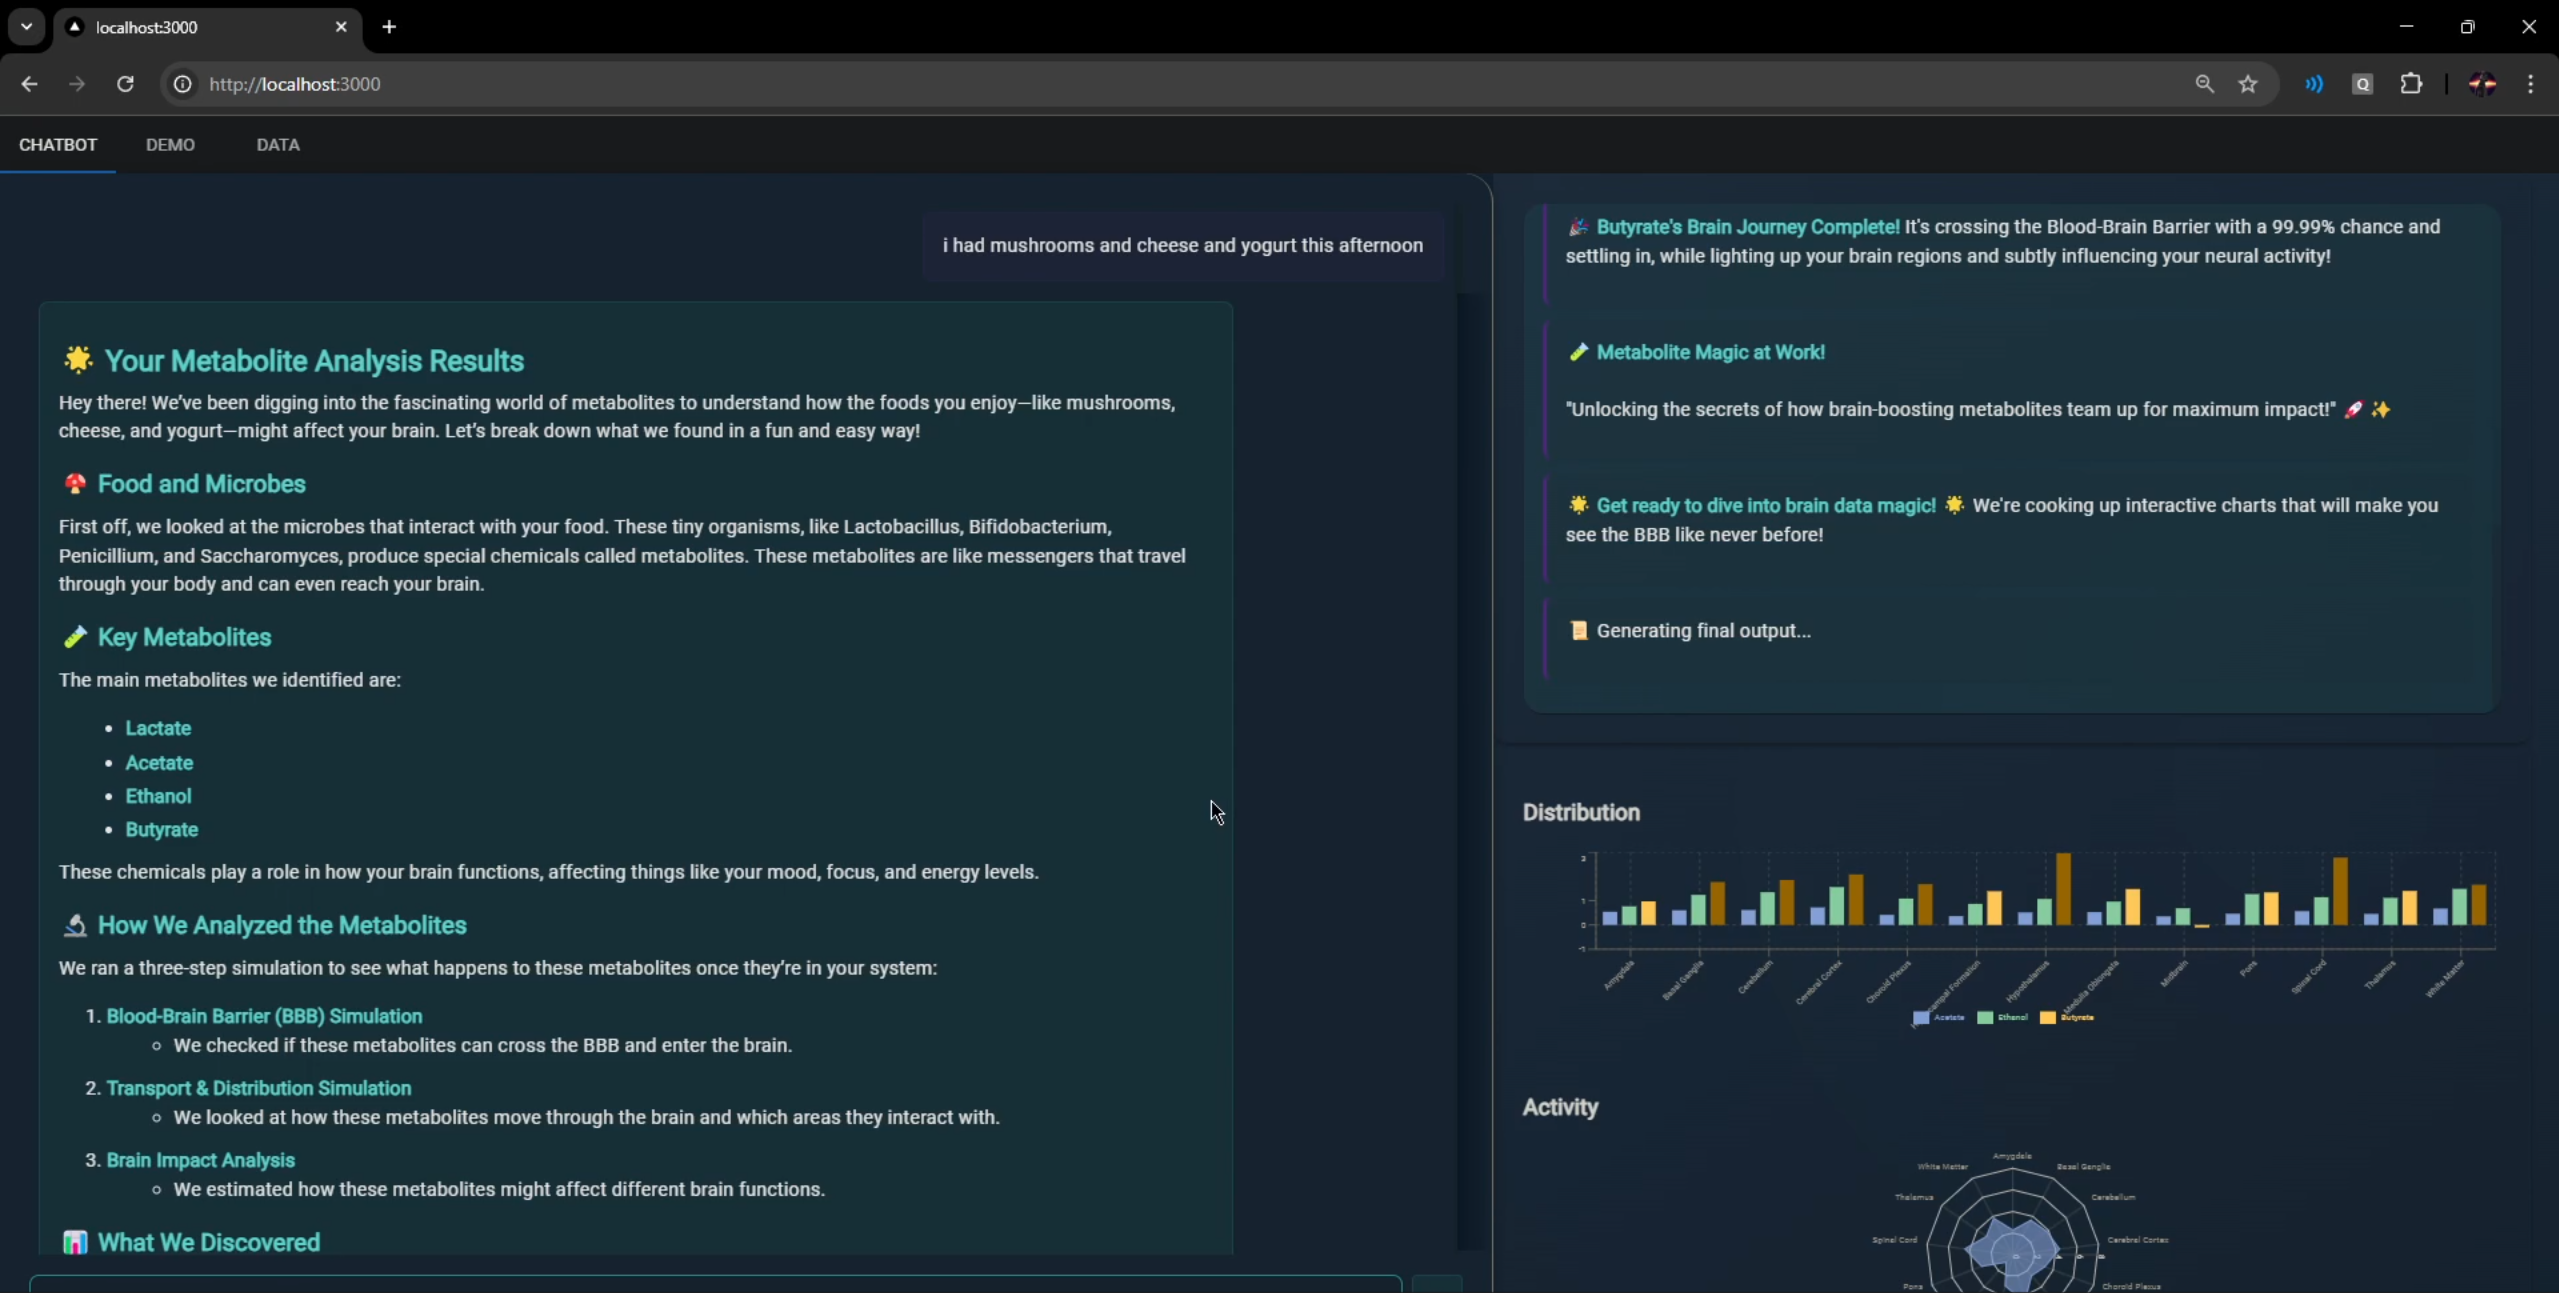
About Quantum Gut Flux
🔬 Inspiration
The relationship between gut microbiota, food metabolism, and brain function is one of the most fascinating and complex areas of biology. When we consume food, microbes in our gut break down dietary components, producing metabolites that influence various bodily functions—including those of the brain. Some of these metabolites cross the blood-brain barrier (BBB) and impact neural activity, behavior, and even disease states.
However, traditional models oversimplify the connection between diet, gut microbiome, and brain function. To address this, we developed Quantum Gut Flux, a cutting-edge simulation that integrates quantum-inspired modeling, machine learning, and systems biology to capture the intricate, multi-dimensional effects of metabolites in the body.
🚀 What It Does
Quantum Gut Flux is a quantum-inspired AI simulation that predicts the journey of gut-derived metabolites and their effects on the brain. It features:
- 🧠 Blood-Brain Barrier (BBB) Transport Modeling:
- Predicts the probability, speed, and distribution of metabolites crossing the BBB into brain tissues.
- Predicts the probability, speed, and distribution of metabolites crossing the BBB into brain tissues.
- 🔄 Metabolite Transport Dynamics:
- Uses quantum-inspired modeling to simulate how metabolites move through blood, cells, and brain compartments over time.
- Uses quantum-inspired modeling to simulate how metabolites move through blood, cells, and brain compartments over time.
- ⚡ Brain Region Impact Analysis:
- Determines which brain regions are affected by specific metabolites, their accumulation rates, and their interaction effects.
- Determines which brain regions are affected by specific metabolites, their accumulation rates, and their interaction effects.
- 📊 Data Integration & Machine Learning:
- Unifies multiple biological datasets (gut microbiome, BBB transport data, metabolomics databases) to train neural network models.
- Unifies multiple biological datasets (gut microbiome, BBB transport data, metabolomics databases) to train neural network models.
- 🖥️ Interactive User Interface:
- Provides real-time, interactive visualizations of metabolite effects.
🛠️ How We Built It
🔍 Core Simulation Components
1️⃣ Quantum-Inspired AI for Metabolite Transport
- Superposition Modeling:
- Each metabolite exists in multiple transport states simultaneously, capturing uncertainty in molecular pathways.
- Each metabolite exists in multiple transport states simultaneously, capturing uncertainty in molecular pathways.
- Interference Effects:
- Models non-linear interactions between multiple metabolites affecting brain function.
- Models non-linear interactions between multiple metabolites affecting brain function.
- Quantum Walk for Metabolite State Evolution:
- Uses quantum-like probability distributions to predict how metabolites move over time through cellular compartments.
- Uses quantum-like probability distributions to predict how metabolites move over time through cellular compartments.
- Entanglement in Brain Regions:
- Brain regions are statistically linked, so changes in one region can influence another dynamically.
2️⃣ Three AI-Powered Simulation Models
A. BBB Transport Model
- Predicts the likelihood of a metabolite crossing the BBB, how fast it moves, and where it accumulates.
- Inputs: 34 biological features (e.g., molecular properties, transport pathways, BBB binding affinity).
- Outputs:
- BBB Crossing Probability
- Transport Rate
- State Distribution (Blood, BBB Interface, Brain Tissue)
- BBB Crossing Probability
B. Metabolite Transport State Model
- Simulates how metabolites dynamically move through the body.
- Inputs: 21-dimensional state vector (cell location, metabolite properties, transport direction).
- Outputs:
- Time-Series Transport Probabilities
- Transition Rate Matrix
- Steady-State Distribution
- Time-Series Transport Probabilities
C. Brain Region Effect Model
- Predicts which brain regions are affected and how metabolites accumulate over time.
- Inputs: 19 features (brain region expression levels, neurotransmitter interactions, prior transport state).
- Outputs:
- Metabolite Concentration in Each Brain Region
- Accumulation Rates
- Neural Interference Patterns
- Metabolite Concentration in Each Brain Region
3️⃣ Unified Data Pipeline & AI Prediction Process
- User Input:
- A user provides a meal description or selects a metabolite of interest.
- A user provides a meal description or selects a metabolite of interest.
- LLM Integration & Feature Extraction:
- A large language model (LLM) extracts key metabolites and quantities from the input.
- A large language model (LLM) extracts key metabolites and quantities from the input.
- Biological Data Lookup:
- The system retrieves the metabolite’s molecular properties, transport behavior, and neural targets.
- The system retrieves the metabolite’s molecular properties, transport behavior, and neural targets.
- AI Model Processing:
- The metabolite is processed through the three AI models.
- The metabolite is processed through the three AI models.
- Aggregation & Prediction Scaling:
- The system aggregates multiple metabolites, normalizing their effects based on real-world concentrations.
- The system aggregates multiple metabolites, normalizing their effects based on real-world concentrations.
- Visualization & Streaming Output:
- The interactive UI dynamically visualizes how gut-derived metabolites impact brain function.
🧩 Challenges Faced
- 🚀 Complex Data Integration:
- Unifying multi-format biological datasets and ensuring data accuracy was a major challenge.
- Unifying multi-format biological datasets and ensuring data accuracy was a major challenge.
- 🛠️ Building Multi-Output Neural Networks:
- Designing a multi-layered AI system required significant experimentation and tuning.
- Designing a multi-layered AI system required significant experimentation and tuning.
- ⚡ Quantum-Inspired Modeling:
- Implementing quantum principles into a biological simulation required novel AI architecture.
- Implementing quantum principles into a biological simulation required novel AI architecture.
- ⚖️ Scalability & Performance:
- Handling large-scale microbiome and metabolite data efficiently required advanced cloud-based solutions.
🏆 Accomplishments
✅ Developed a cutting-edge AI simulation integrating quantum-inspired ML with neuroscience.
✅ Built a unified dataset combining metabolomics, microbiome, and brain transport data.
✅ Successfully trained three AI models to predict gut-brain interactions.
✅ Created an interactive UI for real-time exploration of metabolite effects.
📚 What We Learned
This project pushed us to master:
🧪 Data Engineering – Advanced data cleaning, integration, and transformation techniques.
🧠 Neural Networks & ML – Multi-output AI for biological predictions.
🔬 Interdisciplinary Science – Merging bioinformatics, quantum mechanics, and neuroscience.
💻 Full-Stack Development – Building an end-to-end AI system with a user-friendly interface.
🌟 Future Applications
🧠 Mental Health & Cognitive Research
- Understanding how gut metabolites affect cognition, anxiety, and depression.
- Identifying microbiome-based therapies for neurodegenerative diseases.
💊 AI-Driven Drug Discovery
- Simulating drug-microbiome interactions to predict treatment outcomes.
- Developing gut-derived neurotherapeutics for brain disorders.
🍽️ Personalized Nutrition & Gut Health
- Predicting how different diets influence brain function through gut metabolites.
- Recommending microbiome-optimized meal plans for mental health and performance.
💡 Why Quantum Gut Flux Matters
Understanding how the gut influences the brain is key to the future of medicine. Quantum Gut Flux pioneers a new AI-driven approach to gut-brain research, offering a powerful tool for neuroscientists, bioengineers, and health professionals.
Whether you’re a researcher, developer, or enthusiast, Quantum Gut Flux invites you to explore the cutting edge of AI-powered neuroscience. 🚀
1. The Unified Dataset (CSV)
Below is an excerpt from the unified dataset we created. It merges metabolite information, transport data, BBB crossing data, and brain expression levels into a single file:
hmdb_id,name,is_neurotransmitter,is_hormone,gene_names,uniprot_ids,brain_tissues,cellular_locations,pathways,description,hmdb_id_lower,HMDB,MetName,Transport_direction,Direction,CellLoc,TissueLoc,HMDB_lower,name_clean,compound_name,SMILES,CID,logBB,compound_name_clean,aggregated_brain_expression
HMDB0000002,"1,3-Diaminopropane",No,No,SMS|DHPS|ABP1|AOC3|AOC2|AMD1|ODC1,P52788|P49366|P19801|Q16853|O75106|P17707|P11926,,Cytoplasm,"beta-Alanine metabolism|Carnosinuria, carnosinemia|GABA-Transaminase Deficiency|Ureidopropionase Deficiency","1,3-Diaminopropane, also known as DAP or trimethylenediamine, belongs to the class of organic compounds known as monoalkylamines. These are organic compounds containing a primary aliphatic amine group. 1,3-Diaminopropane is a stable, flammable, and highly hygroscopic fluid. It is a polyamine that is normally quite toxic if swallowed, inhaled, or absorbed through the skin. It is a catabolic byproduct of spermidine. It is also a precursor in the enzymatic synthesis of beta-alanine. 1,3-Diaminopropane is involved in the arginine/proline metabolic pathways and the beta-alanine metabolic pathway. 1,3-Diaminopropane has been detected, but not quantified in, several different foods, such as cassava, shiitakes, oyster mushrooms, muscadine grapes, and cinnamons. This could make 1,3-diaminopropane a potential biomarker for the consumption of these foods.",hmdb0000002,HMDB0000002,"1,3-Diaminopropane",in | out,degrading | producing,"[""Cytoplasm""]",,hmdb0000002,1 3 diaminopropane,,,,,,"{""amygdala"": 28.116666666666664, ""basal ganglia"": 34.28333333333334, ""cerebellum"": 34.266666666666666, ""cerebral cortex"": 33.449999999999996, ""choroid plexus"": 33.28333333333333, ""hippocampal formation"": 28.650000000000002, ""hypothalamus"": 32.38333333333333, ""medulla oblongata"": 33.349999999999994, ""midbrain"": 29.75, ""pons"": 32.449999999999996, ""spinal cord"": 33.4, ""thalamus"": 32.48333333333333, ""white matter"": 44.58333333333334}"
HMDB0000005,2-Ketobutyric acid,Yes,No,PDHB|PDHA1|PDHA2|BCKDHB|BCKDHA|OGDH|CTH|SDS|LDHAL6A|UROC1|BCKDK|LDHB|LDHC|LDHA|LDHAL6B|TMLHE|ALKBH2|ALKBH3|SDSL|OGDHL|OXGR1,P11177|P08559|P29803|P21953|P12694|Q02218|P32929|P20132|Q6ZMR3|Q96N76|O14874|P07195|P07864|P00338|Q9BYZ2|Q9NVH6|Q6NS38|Q96Q83|Q96GA7|Q9ULD0|Q96P68,,Cytoplasm,"3-Phosphoglycerate dehydrogenase deficiency|Cystathionine Beta-Synthase Deficiency|Dihydropyrimidine Dehydrogenase Deficiency (DHPD)|Dimethylglycine Dehydrogenase Deficiency|Dimethylglycine Dehydrogenase Deficiency|Gamma-cystathionase deficiency (CTH)|Glycine N-methyltransferase Deficiency|Glycine, serine and threonine metabolism|Homocysteine Degradation|Homocystinuria, cystathionine beta-synthase deficiency|Homocystinuria-megaloblastic anemia due to defect in cobalamin metabolism, cblG complementation type|Hyperglycinemia, non-ketotic|Hypermethioninemia|Malonic Aciduria|Malonyl-coa decarboxylase deficiency|Methionine Adenosyltransferase Deficiency|Methionine Metabolism|Methylenetetrahydrofolate Reductase Deficiency (MTHFRD)|Methylmalonic Aciduria Due to Cobalamin-Related Disorders|Non Ketotic Hyperglycinemia|Propanoate metabolism|S-Adenosylhomocysteine (SAH) Hydrolase Deficiency|Sarcosinemia|Selenocompound metabolism|Threonine and 2-Oxobutanoate Degradation","2-Ketobutyric acid, also known as alpha-ketobutyrate or 2-oxobutyrate, belongs to the class of organic compounds known as short-chain keto acids and derivatives. These are keto acids with an alkyl chain the contains less than 6 carbon atoms. 2-Ketobutyric acid is a substance that is involved in the metabolism of many amino acids (glycine, methionine, valine, leucine, serine, threonine, isoleucine) as well as propanoate metabolism and C-5 branched dibasic acid metabolism. It is also one of the degradation products of threonine. It can be converted into propionyl-CoA (and subsequently methylmalonyl CoA, which can be converted into succinyl CoA, a citric acid cycle intermediate), and thus enter the citric acid cycle. More specifically, 2-ketobutyric acid is a product of the lysis of cystathionine.",hmdb0000005,HMDB0000005,2-Ketobutyric acid,in | out,degrading | producing,"[""Cytoplasm""]",,hmdb0000005,2 ketobutyric acid,,,,,,"{""amygdala"": 39.6095238095238, ""basal ganglia"": 45.095238095238095, ""cerebellum"": 52.24761904761906, ""cerebral cortex"": 52.919047619047625, ""choroid plexus"": 63.61428571428571, ""hippocampal formation"": 37.599999999999994, ""hypothalamus"": 54.280952380952385, ""medulla oblongata"": 54.523809523809526, ""midbrain"": 53.60952380952381, ""pons"": 51.60476190476191, ""spinal cord"": 43.80476190476191, ""thalamus"": 53.31428571428571, ""white matter"": 45.67619047619049}"
HMDB0000008,2-Hydroxybutyric acid,No,No,DLD|SULT2B1|UGT1A1|LDHAL6A|LDHB|LDHC|LDHA|LDHAL6B,P09622|O00204|P22309|Q6ZMR3|P07195|P07864|P00338|Q9BYZ2,,Cytoplasm|Extracellular,Malonic Aciduria|Malonyl-coa decarboxylase deficiency|Methylmalonic Aciduria Due to Cobalamin-Related Disorders|Propanoate metabolism,"2-Hydroxybutyric acid (CAS: 600-15-7), also known as alpha-hydroxybutyrate, is an organic acid derived from alpha-ketobutyrate. alpha-Ketobutyrate is produced by amino acid catabolism (threonine and methionine) and glutathione anabolism (cysteine formation pathway) and is metabolized into propionyl-CoA and carbon dioxide (PMID: 20526369). alpha-Hydroxybutyric acid is primarily produced in mammalian hepatic tissues that catabolize L-threonine or synthesize glutathione. Oxidative stress or detoxification of xenobiotics in the liver can dramatically increase the rate of hepatic glutathione synthesis. Under such metabolic stress conditions, supplies of L-cysteine for glutathione synthesis become limiting, so homocysteine is diverted from the transmethylation pathway (which forms methionine) into the transsulfuration pathway (which forms cystathionine). alpha-Ketobutyrate is released as a byproduct when cystathionine is cleaved into cysteine that is incorporated into glutathione. Chronic shifts in the rate of glutathione synthesis may be reflected by urinary excretion of 2-hydroxybutyrate. 2-Hydroxybutyrate is an early marker for both insulin resistance and impaired glucose regulation that appears to arise due to increased lipid oxidation and oxidative stress (PMID: 20526369). 2-Hydroxybutyric acid is often found in the urine of patients suffering from lactic acidosis and ketoacidosis. 2-Hydroxybutyric acid generally appears at high concentrations in situations related to deficient energy metabolism (e.g. birth asphyxia) and also in inherited metabolic diseases affecting the central nervous system during neonatal development, such as ""cerebral"" lactic acidosis, glutaric aciduria type II, dihydrolipoyl dehydrogenase (E3) deficiency, and propionic acidemia. More recently it has been noted that elevated levels of alpha-hydroxybutyrate in the plasma is a good marker for early-stage type II diabetes (PMID: 19166731). It was concluded from studies done in the mid-1970s that an increased NADH2/NAD ratio was the most important factor for the production of 2-hydroxybutyric acid (PMID: 168632).",hmdb0000008,HMDB0000008,2-Hydroxybutyric acid,out,degrading | producing,"[""Cytoplasm"", ""Extracellular""]","[""Placenta"", ""Prostate""]",hmdb0000008,2 hydroxybutyric acid,,,,,,"{""amygdala"": 65.075, ""basal ganglia"": 73.31249999999997, ""cerebellum"": 89.325, ""cerebral cortex"": 88.1625, ""choroid plexus"": 80.725, ""hippocampal formation"": 57.6375, ""hypothalamus"": 91.0625, ""medulla oblongata"": 87.3625, ""midbrain"": 90.88749999999997, ""pons"": 85.07499999999999, ""spinal cord"": 74.0625, ""thalamus"": 88.65, ""white matter"": 71.63749999999999}"
2. Example Final Output
Below is an example of a final output our system might generate. It provides a summary of the metabolite journey and their effects on the brain, alongside some example charts data:
{
  "final_output": {
    "summary": "## 🌟 **Your Metabolite Analysis Summary**\n\nHey there! Let's dive into what we found from your yogurt intake and how it interacts with your brain through the helpful microbes Lactobacillus and Bifidobacterium.\n\n### 🍽️ **What Happens When You Eat Yogurrt**\n\nYogurt is full of good bacteria that break down the food and produce special chemicals called metabolites. These metabolites are like little messengers that travel through your body and even into your brain.\n\n### 🦠 **Meet the Microbial Messengers**\n\nThe key metabolites produced by these microbes are lactate and propionate. Think of them as tiny emissaries sent to different parts of your brain to deliver important information.\n\n### 🧪 **How Our Simulation Works**\n\nWe ran a detailed simulation to see how these metabolites journey through your body and brain:\n\n1. **Crossing the Blood-Brain Barrier (BBB):** \n   - Lactate and propionate successfully cross the BBB, which is like a security checkpoint, and enter the brain.\n\n2. **Transport & Distribution Simulation:** \n   - We mapped out how these metabolites travel through the brain and where they hang out the most.\n\n3. **Brain Impact Analysis:** \n   - We estimated how these metabolites might affect different brain functions, like mood, focus, and energy.\n\n### 📊 **What We Found**\n\n#### **Region Concentration**\n\n- **Lactate:**\n  - **High Concentrations:** Cerebral Cortex (0.72), White Matter (0.675)\n  - **Moderate Concentrations:** Cerebellum (0.615), Spinal Cord (0.566)\n  - **Lower Concentrations:** Hippocampal Formation (0.363), Midbrain (0.351)\n\n- **Propionate:**\n  - **High Concentrations:** Cerebral Cortex (0.887), Spinal Cord (0.86)\n  - **Moderate Concentrations:** Cerebellum (0.846), Basal Ganglia (0.742)\n  - **Lower Concentrations:** Midbrain (0.267), Hippocampal Formation (0.417)\n\n#### **Accumulation Rates**\n\n- **Lactate:**\n  - **High Accumulation:** Cerebral Cortex (0.642), Spinal Cord (0.547)\n  - **Moderate Accumulation:** Cerebellum (0.364), Thalamus (0.534)\n  - **Lower Accumulation:** Midbrain (0.418), Medulla Oblongata (0.295)\n\n- **Propionate:**\n  - **High Accumulation:** Cerebral Cortex (0.641), Spinal Cord (0.583)\n  - **Moderate Accumulation:** Cerebellum (0.349), Thalamus (0.658)\n  - **Lower Accumulation:** Midbrain (0.421), Medulla Oblongata (0.423)\n\n#### **Interference Patterns**\n\n- **Lactate:**\n  - **Low Interference:** Spinal Cord (0.046), Medulla Oblongata (0.055)\n  - **Moderate Interference:** Cerebral Cortex (0.061), Hippocampal Formation (0.067)\n\n- **Propionate:**\n  - **Low Interference:** Spinal Cord (0.042), Medulla Oblongata (0.054)\n  - **Moderate Interference:** Cerebral Cortex (0.056), Hippocampal Formation (0.069)\n\n### 🌈 **What It All Means**\n\nSo, when you eat yogurt, the good bacteria in it produce lactate and propionate. These metabolites then travel through your body and into your brain, where they accumulate most in areas like the cerebral cortex and spinal cord. They have relatively low interference, meaning they interact gently with brain functions.\n\nIn simple terms, eating yogurt helps your brain get these beneficial metabolites, which can support overall brain health and function. Isn't that cool?\n\nStay curious and keep nourishing your brain with healthy foods! 😊",
    "charts": {
      "stacked_bar_chart": {
        "brain_regions": [
          "Amygdala",
          "Basal Ganglia",
          "Cerebellum",
          "Cerebral Cortex",
          "Choroid Plexus",
          "Hippocampal Formation",
          "Hypothalamus",
          "Medulla Oblongata",
          "Midbrain",
          "Pons",
          "Spinal Cord",
          "Thalamus",
          "White Matter"
        ],
        "metabolites": ["Lactate", "Propionate"],
        "values": {
          "Lactate": [
            0.5416834950447083,
            0.602842390537262,
            0.6149579882621765,
            0.7199162840843201,
            0.41200417280197144,
            0.3625212609767914,
            0.5147256851196289,
            0.5273428559303284,
            0.3514420688152313,
            0.46225401759147644,
            0.5662844181060791,
            0.4555166959762573,
            0.6745224595069885
          ],
          "Propionate": [
            0.5283828973770142,
            0.7423241138458252,
            0.8456639647483826,
            0.8865413665771484,
            0.5412420034408569,
            0.41714051365852356,
            0.6170918345451355,
            0.677193284034729,
            0.26653069257736206,
            0.43589362502098083,
            0.8598944544792175,
            0.5706771016120911,
            0.7362141609191895
          ]
        }
      },
      "radar_chart": {
        "brain_regions": [
          "Amygdala",
          "Basal Ganglia",
          "Cerebellum",
          "Cerebral Cortex",
          "Choroid Plexus",
          "Hippocampal Formation",
          "Hypothalamus",
          "Medulla Oblongata",
          "Midbrain",
          "Pons",
          "Spinal Cord",
          "Thalamus",
          "White Matter"
        ],
        "values": [
          1.0700663924217224,
          1.3451665043830872,
          1.460621953010559,
          1.6064576506614685,
          0.9532461762428284,
          0.7796617746353149,
          1.1318175196647644,
          1.2045361399650574,
          0.6179727613925934,
          0.8981476426124573,
          1.4261788725852966,
          1.0261937975883484,
          1.410736620426178
        ]
      },
      "heatmap": {
        "metabolites": ["Lactate", "Propionate"],
        "brain_regions": [
          "Amygdala",
          "Basal Ganglia",
          "Cerebellum",
          "Cerebral Cortex",
          "Choroid Plexus",
          "Hippocampal Formation",
          "Hypothalamus",
          "Medulla Oblongata",
          "Midbrain",
          "Pons",
          "Spinal Cord",
          "Thalamus",
          "White Matter"
        ],
        "values": {
          "Lactate": [
            0.5416834950447083,
            0.602842390537262,
            0.6149579882621765,
            0.7199162840843201,
            0.41200417280197144,
            0.3625212609767914,
            0.5147256851196289,
            0.5273428559303284,
            0.3514420688152313,
            0.46225401759147644,
            0.5662844181060791,
            0.4555166959762573,
            0.6745224595069885
          ],
          "Propionate": [
            0.5283828973770142,
            0.7423241138458252,
            0.8456639647483826,
            0.8865413665771484,
            0.5412420034408569,
            0.41714051365852356,
            0.6170918345451355,
            0.677193284034729,
            0.26653069257736206,
            0.43589362502098083,
            0.8598944544792175,
            0.5706771016120911,
            0.7362141609191895
          ]
        }
      },
      "grouped_bar_chart": {
        "brain_regions": [
          "Amygdala",
          "Basal Ganglia",
          "Cerebellum",
          "Cerebral Cortex",
          "Choroid Plexus",
          "Hippocampal Formation",
          "Hypothalamus",
          "Medulla Oblongata",
          "Midbrain",
          "Pons",
          "Spinal Cord",
          "Thalamus",
          "White Matter"
        ],
        "region_concentration": {
          "Lactate": [
            0.5416834950447083,
            0.602842390537262,
            0.6149579882621765,
            0.7199162840843201,
            0.41200417280197144,
            0.3625212609767914,
            0.5147256851196289,
            0.5273428559303284,
            0.3514420688152313,
            0.46225401759147644,
            0.5662844181060791,
            0.4555166959762573,
            0.6745224595069885
          ],
          "Propionate": [
            0.5283828973770142,
            0.7423241138458252,
            0.8456639647483826,
            0.8865413665771484,
            0.5412420034408569,
            0.41714051365852356,
            0.6170918345451355,
            0.677193284034729,
            0.26653069257736206,
            0.43589362502098083,
            0.8598944544792175,
            0.5706771016120911,
            0.7362141609191895
          ]
        },
        "accumulation_rates": {
          "Lactate": [
            0.5151852965354919,
            0.5187002420425415,
            0.3637074828147888,
            0.6415476202964783,
            0.533660888671875,
            0.25631776452064514,
            0.28075459599494934,
            0.29454368352890015,
            0.41764378547668457,
            0.46987101435661316,
            0.5474804639816284,
            0.534320056438446,
            0.45184069871902466
          ],
          "Propionate": [
            0.5969839692115784,
            0.5111894011497498,
            0.3491886258125305,
            0.6405777335166931,
            0.6903442740440369,
            0.30339500308036804,
            0.19344592094421387,
            0.4229106307029724,
            0.42063096165657043,
            0.5798560976982117,
            0.5826181173324585,
            0.6578562259674072,
            0.41720327734947205
          ]
        },
        "interference_patterns": {
          "Lactate": [
            0.12211614102125168,
            0.09474590420722961,
            0.0879889652132988,
            0.06083317846059799,
            0.07589657604694366,
            0.06732312589883804,
            0.06284473836421967,
            0.055316414684057236,
            0.07548750191926956,
            0.09412071108818054,
            0.045992232859134674,
            0.06064232811331749,
            0.09669221192598343
          ],
          "Propionate": [
            0.12325344979763031,
            0.09489153325557709,
            0.08758993446826935,
            0.056002426892519,
            0.07628136873245239,
            0.06866984814405441,
            0.06045687198638916,
            0.05392557382583618,
            0.07525978237390518,
            0.09139852225780487,
            0.04235268384218216,
            0.06490439176559448,
            0.10501362383365631
          ]
        }
      }
    },
    "status": [
      "\"Get ready to dive into the brain's inner workings! Our simulation is about to explore how metabolites navigate the intricate pathways from blood to brain, unlocking the secrets of their journey across the BBB and their impact on our mind!\" 🧠🚀",
      "\"Let's see how Lactate navigates our brain's complex maze, from crossing barriers to making its mark on each region!\" 🚀",
      "🎉 Lactate's journey across the BBB is complete! From crossing probabilities to brain region impact, we've got all the insights you need!",
      "```json\n{\n  \"status_message\": \"Just a moment! We're on a mission to see how Propionate navigates the brain's bustling highways!\"\n}\n```",
      "🎉 Propionate's journey across the BBB is mapped out: high crossing probability, steady transport, and a balanced brain impact! 🧠✨",
      "🌟 **Crafting a Metabolite Symphony!** 🌟\n\nDive into the intricate dance of your brain's chemistry as we finalize the results for all metabolites, exploring their dynamic interactions and potential harmonies. 🧠✨",
      "🌟 **Get ready to dive into the brain's transport world with our dazzling new visualizations!**"
    ]
  }
}
Additional Snippets
Below are some code snippets used in Quantum Gut Flux. We include them here for reference. (Note: We do not modify the original code.)
3. Sample Code: Custom Quantum-Inspired Dense Layer
# --- Define Custom Quantum-Inspired Dense Layer ---
class QuantumDense(layers.Layer):
    def __init__(self, units, activation=None, **kwargs):
        super(QuantumDense, self).__init__(**kwargs)
        self.units = units
        self.activation = tf.keras.activations.get(activation)

    def build(self, input_shape):
        self.w_real = self.add_weight(
            shape=(input_shape[-1], self.units),
            initializer='glorot_uniform',
            trainable=True,
            name='w_real'
        )
        self.w_imag = self.add_weight(
            shape=(input_shape[-1], self.units),
            initializer='glorot_uniform',
            trainable=True,
            name='w_imag'
        )
        self.bias = self.add_weight(
            shape=(self.units,),
            initializer='zeros',
            trainable=True,
            name='bias'
        )
        super(QuantumDense, self).build(input_shape)

    def call(self, inputs):
        real_part = tf.matmul(inputs, self.w_real)
        imag_part = tf.matmul(inputs, self.w_imag)
        # Compute magnitude to simulate interference effects
        magnitude = tf.sqrt(tf.square(real_part) + tf.square(imag_part)) + self.bias
        if self.activation is not None:
            return self.activation(magnitude)
        return magnitude
4. Data Merging and Cleaning
### 2. Data Merging and Cleaning
# File: 45:120:quantum_microbiome-master/src/data_processing/merge_databases.py
def main():
    print("Loading datasets...")
    # Load datasets
    metabolites = pd.read_csv("data/cleaned/metabolites_cleaned_processed.csv")
    transport = pd.read_csv("data/cleaned/transport_cleaned_processed.csv")
    bbb = pd.read_csv("data/cleaned/bbb_crossing_cleaned_processed.csv")
    brain_expr = pd.read_csv("data/cleaned/brain_expression_cleaned_processed.csv")

    print("Cleaning and normalizing HMDB IDs...")
    # Clean and normalize HMDB IDs
    metabolites["hmdb_id_lower"] = metabolites["hmdb_id"].str.lower().str.strip()
    transport["HMDB_lower"] = transport["HMDB"].str.lower().str.strip()

    # Merge transport information
    print("Merging transport information...")
    merged = pd.merge(
        metabolites,
        transport,
        left_on="hmdb_id_lower",
        right_on="HMDB_lower",
        how="inner",
        validate="many_to_many"
    )
    print("After merging metabolites and transport:", merged.shape)

    print("Cleaning compound names...")
    # Clean and normalize compound names for better matching
    tqdm.pandas(desc="Cleaning metabolite names")
    merged["name_clean"] = merged["name"].progress_apply(clean_compound_name)

    tqdm.pandas(desc="Cleaning BBB compound names")
    bbb["compound_name_clean"] = bbb["compound_name"].progress_apply(clean_compound_name)

    # Remove rows with empty compound names
    bbb = bbb[bbb["compound_name_clean"] != ""]

    # Log unique values in the keys to inspect for mismatches
    print("\nSample cleaned metabolite names:")
    print(merged["name_clean"].head().tolist())
    print("\nSample cleaned BBB compound names:")
    print(bbb["compound_name_clean"].head().tolist())

    # Merge BBB crossing data using a left join with cleaned names
    print("\nMerging BBB crossing data...")
    merged = pd.merge(
        merged,
        bbb,
        left_on="name_clean",
        right_on="compound_name_clean",
        how="left",
        validate="many_to_many"
    )
    print("After merging with BBB crossing (left join):", merged.shape)

    # Aggregate brain expression data
    print("\nAggregating brain expression data...")
    tqdm.pandas(desc="Processing brain expression")
    merged["aggregated_brain_expression"] = merged["gene_names"].progress_apply(
        lambda x: aggregate_brain_expression(x, brain_expr)
    )

    # Final filtering: Remove rows where all brain-related fields are empty
    print("\nPerforming final filtering...")
    before_filter = merged.shape[0]
    final_merged = merged[merged.apply(has_brain_data, axis=1)]
    after_filter = final_merged.shape[0]
    print(f"Rows before final brain data filtering: {before_filter}")
    print(f"Rows after filtering: {after_filter}")

    # Save the final unified dataset
    print("\nSaving unified dataset...")
    output_path = "data/cleaned/unified_dataset.csv"
    final_merged.to_csv(output_path, index=False)
    print(f"Unified dataset saved to {output_path}")

    # Print sample of successful matches
    print("\nSample of successful BBB matches:")
    matched = final_merged[~final_merged["compound_name"].isna()]
    if not matched.empty:
        print(matched[["name", "compound_name"]].head())
    else:
        print("No successful BBB matches found!")
5. Formatting the Aggregated Output
def format_output(aggregated_predictions):
    """
    Format the aggregated predictions into a user-friendly output.

    The aggregated_predictions dictionary is expected to have keys:
        - "region_concentration"
        - "accumulation_rates"
        - "interference_patterns"
    Each is expected to be a dictionary where keys are metabolite names and values are lists of 13 numbers.

    Returns a tuple (json_output, text_summary):
        - json_output: a JSON-formatted string of the aggregated results.
        - text_summary: a plain text summary.
    """
    regions = [
        "amygdala", "basal ganglia", "cerebellum", "cerebral cortex", "choroid plexus",
        "hippocampal formation", "hypothalamus", "medulla oblongata", "midbrain", "pons",
        "spinal cord", "thalamus", "white matter"
    ]

    formatted = {}
    for key, metabolites in aggregated_predictions.items():
        formatted[key] = {}
        for metabolite, values in metabolites.items():
            flat_values = flatten_if_nested(values)

            # Ensure numeric conversion and handle exceptions
            try:
                numeric_values = [round(float(val), 3) for val in flat_values]  # Convert each value to float and round
            except ValueError as e:
                print(f"❌ Skipping {metabolite} in {key} due to non-numeric values: {e}")
                continue

            formatted[key][metabolite] = {region: num_val for region, num_val in zip(regions, numeric_values)}

    json_output = json.dumps(formatted, indent=4)

    # Create a text summary
    summary_lines = []
    for key, metabolites in formatted.items():
        summary_lines.append(f"{key.replace('_', ' ').capitalize()}:")
        for metabolite, region_values in metabolites.items():
            summary_lines.append(f"  {metabolite}:")
            for region, value in region_values.items():
                summary_lines.append(f"    {region}: {value}")

    text_summary = "\n".join(summary_lines)

    return json_output, text_summary
Prompt Engineering
In our development process, we used extensive prompt engineering techniques with Large Language Models (LLMs). We often include screenshots of these prompts in our documentation to provide full transparency on how the AI’s responses are guided and refined.
Thank you for exploring Quantum Gut Flux! If you have any questions or want to collaborate, feel free to reach out.
Stay curious, and happy coding! 🚀


Log in or sign up for Devpost to join the conversation.