-
QuantPulse Risk Dashboard
-
QP Graph 1
-
QP Graph 2
-
QP Graph 3
-
QP External Search
Inspiration
As someone who actively trades stocks and follows markets, I have always been frustrated by the gap between what retail investors have access to versus what institutional desks use. A portfolio manager at a hedge fund runs Value at Risk calculations, correlation matrices, and factor exposure models before making any move. A retail investor opens Robinhood and sees a green or red number. That gap is massive and entirely unnecessary.
I built QuantPulse to close it. The idea was straightforward: take the quantitative risk toolkit that professional desks use every day and make it accessible to anyone with a stock portfolio, in seconds, with plain-English AI interpretation on top.
What it does
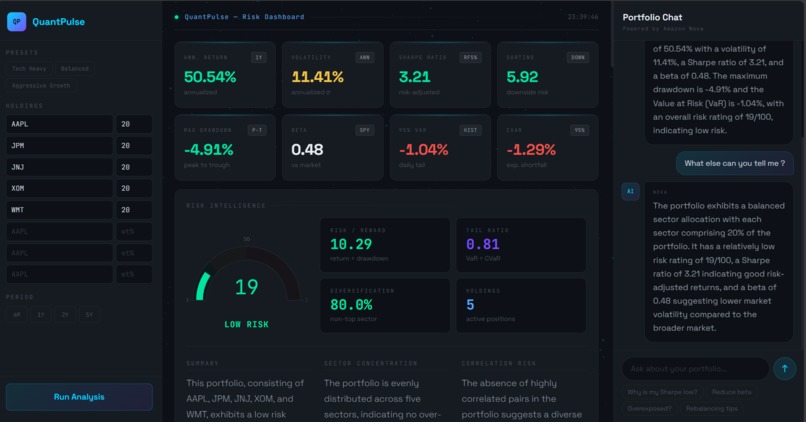
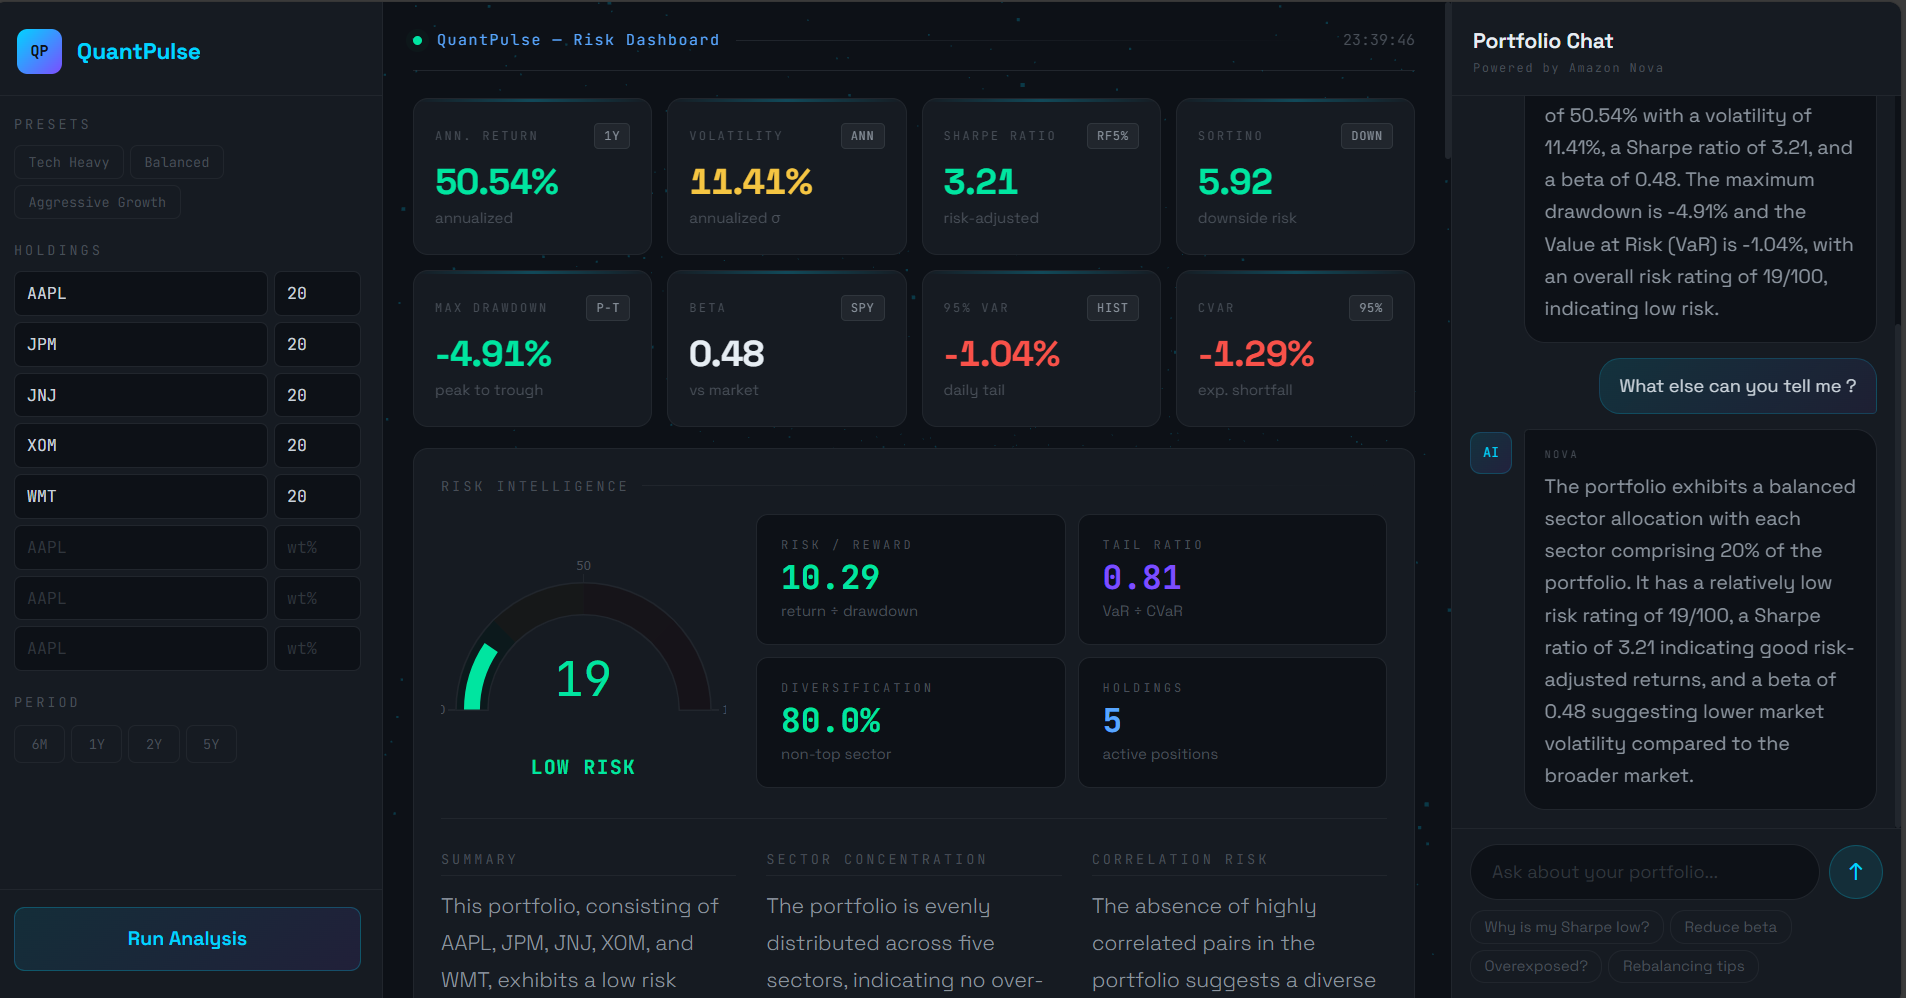
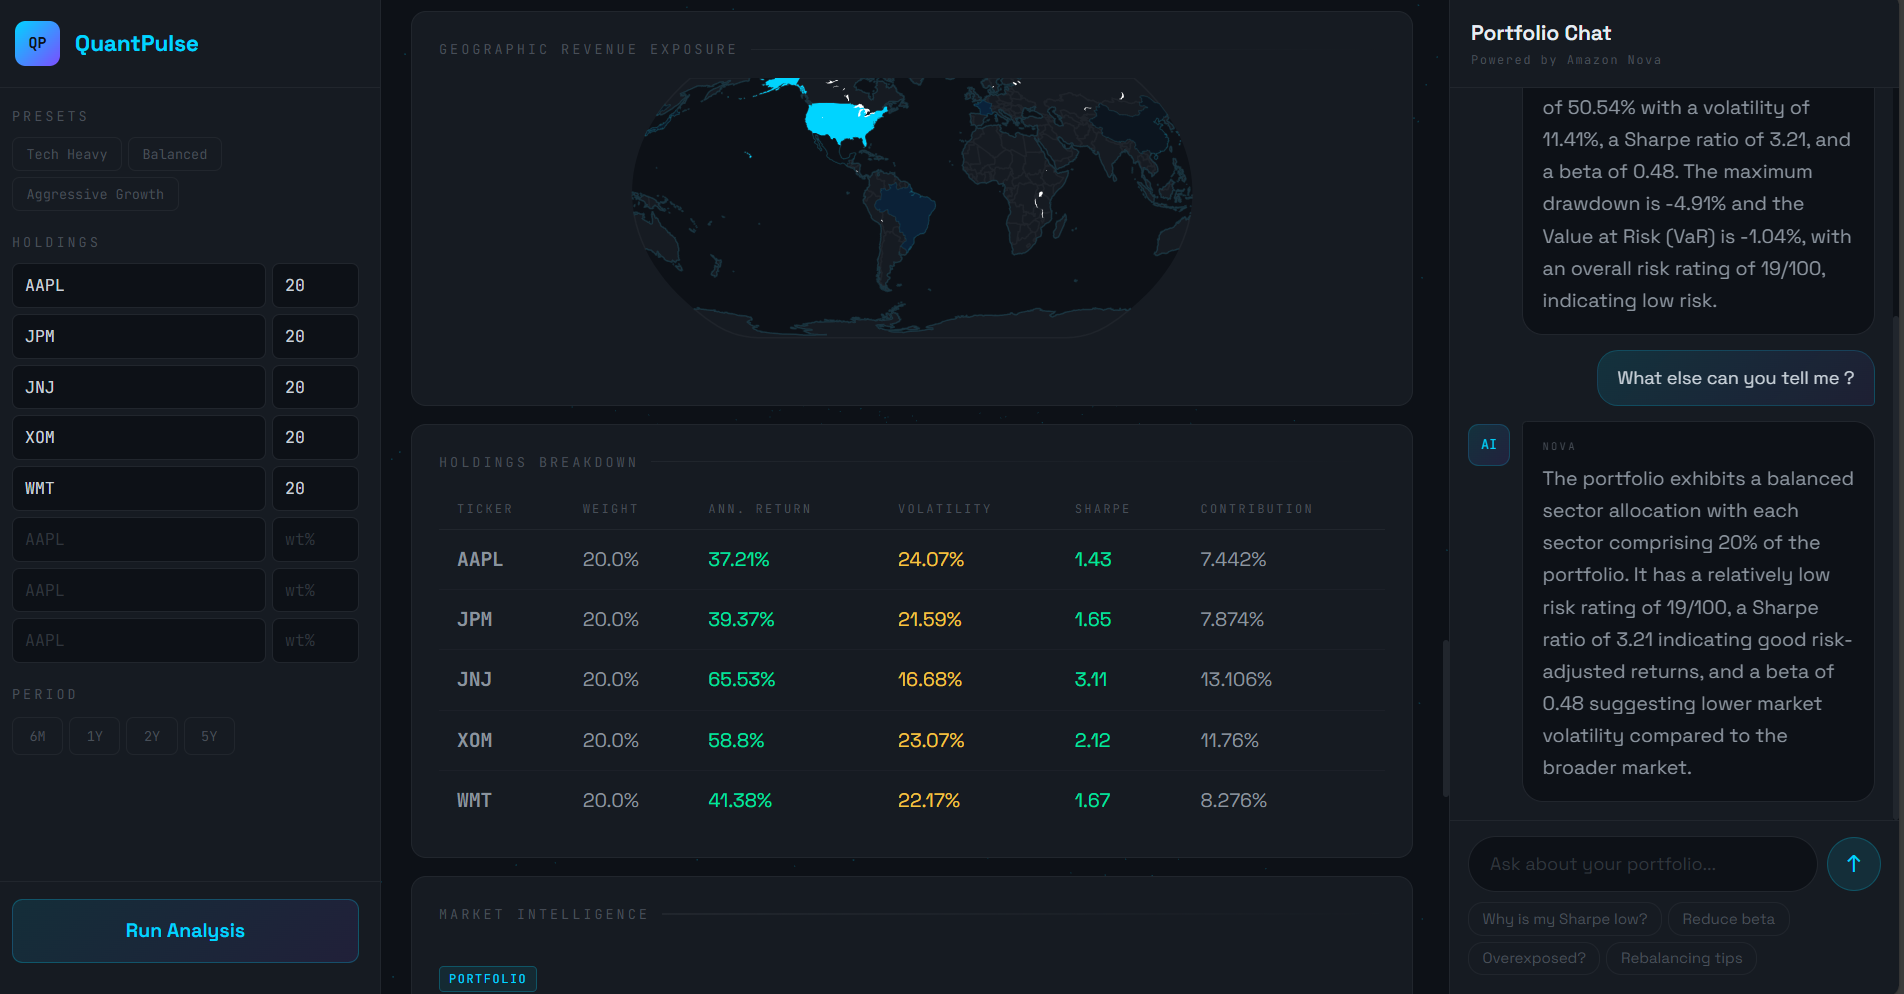
QuantPulse is a full-stack algorithmic portfolio risk intelligence platform. You enter up to 8 stock tickers with their portfolio weights, select a time period, and hit Run Analysis. Within seconds you get a complete institutional-grade risk report.
Quant Engine The engine computes 9 core risk metrics from scratch: Annualized Return, Annualized Volatility, Sharpe Ratio, Sortino Ratio, Maximum Drawdown, Beta vs SPY, 95% Value at Risk (both Historical and Parametric methods), and Conditional VaR (Expected Shortfall). It also derives composite metrics like Risk/Reward Ratio, Tail Risk Ratio, and a Diversification Score. All of this is computed directly from daily price return time series fetched via Alpha Vantage.
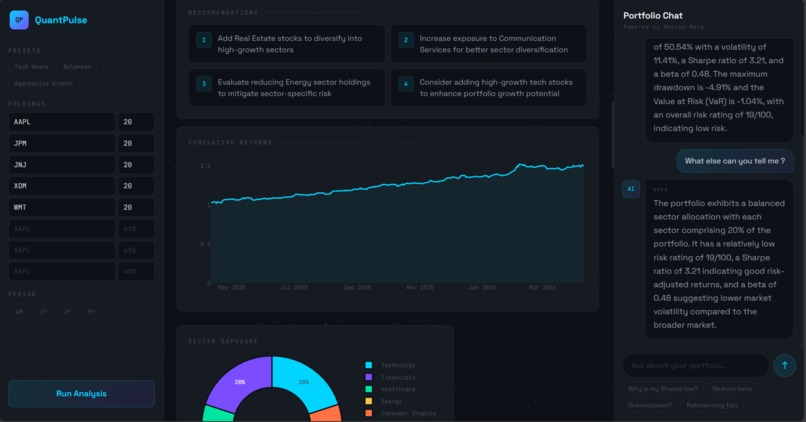
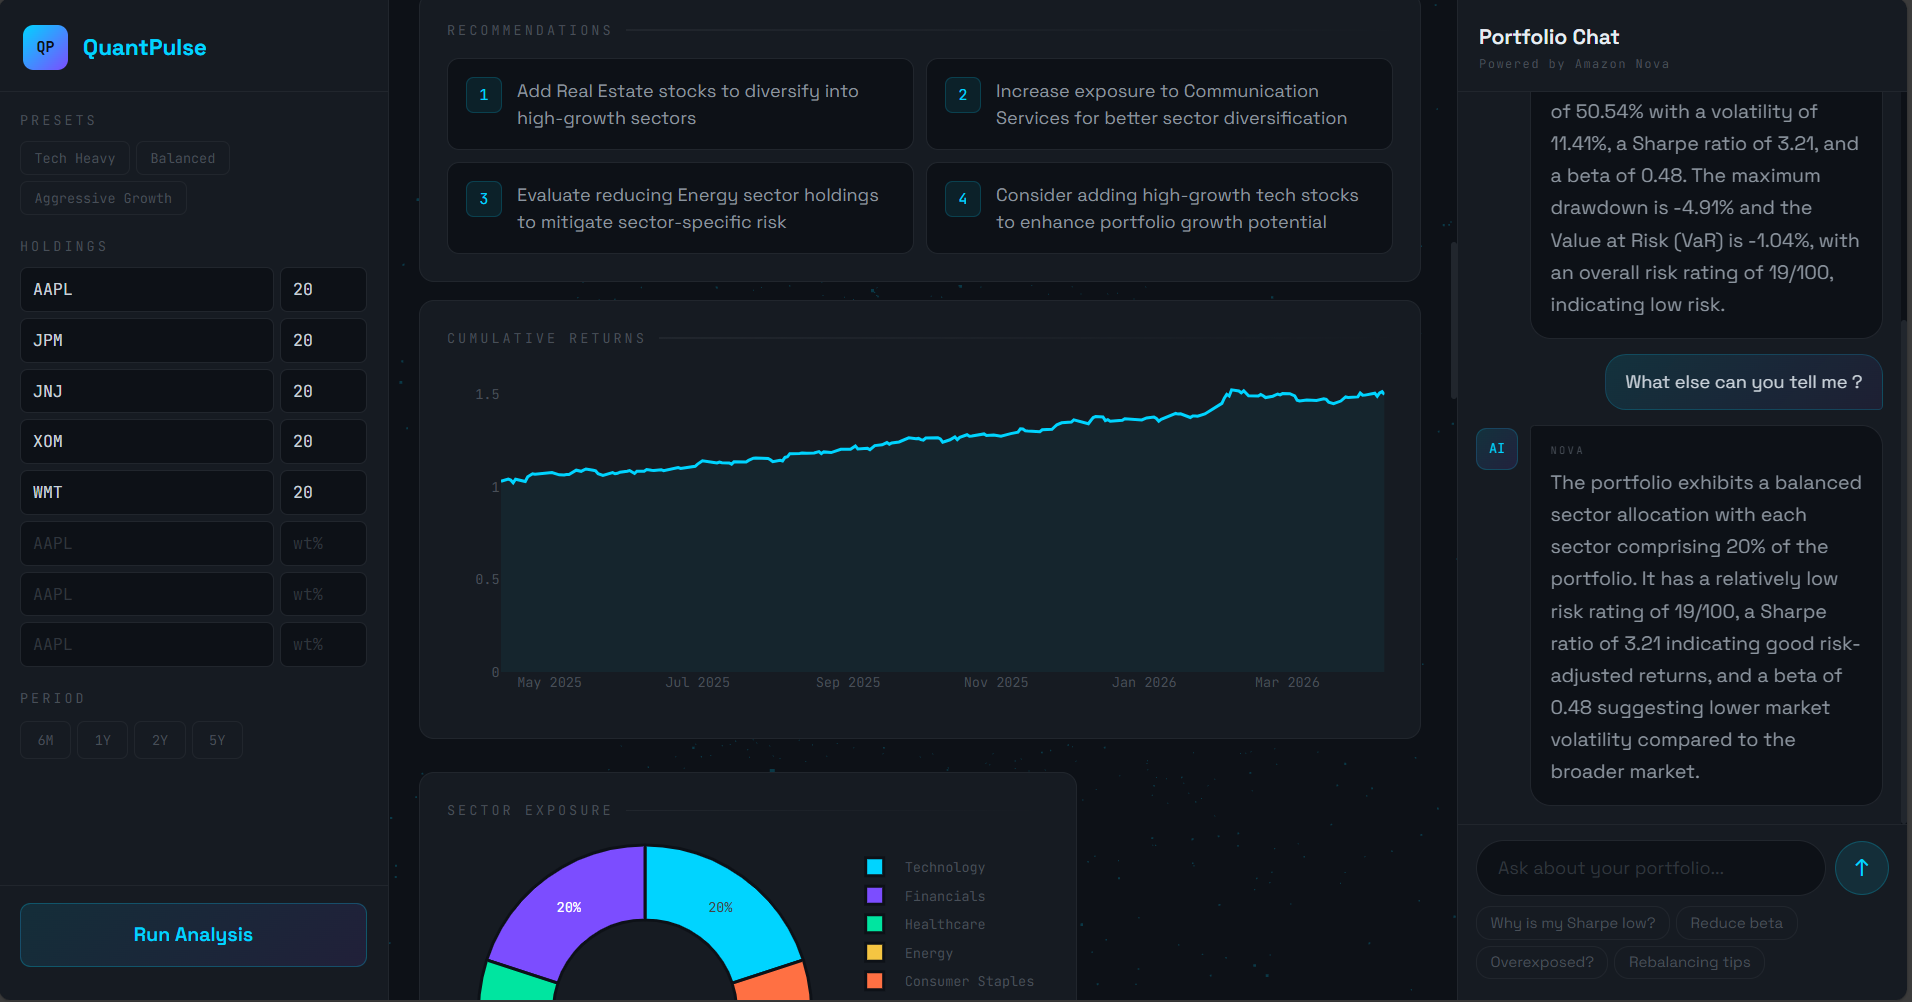
LangGraph AI Agent The analysis is passed to a 5-node LangGraph StateGraph agent running on Amazon Nova Lite via AWS Bedrock. The first node, risk_scorer, is purely algorithmic and deterministic, scoring the portfolio 0 to 100 based on Sharpe, volatility, drawdown, beta, and VaR thresholds. The remaining four nodes call Nova Lite to generate a plain-English risk summary, sector concentration analysis, correlation risk assessment, and 4 specific actionable recommendations tailored to the exact numbers in your portfolio.
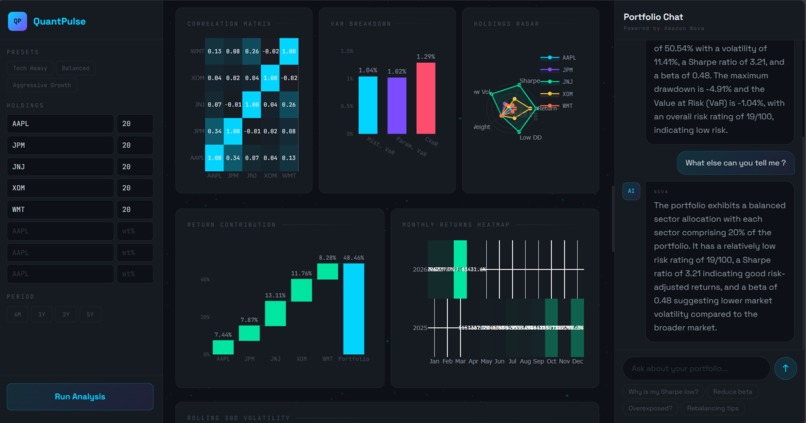
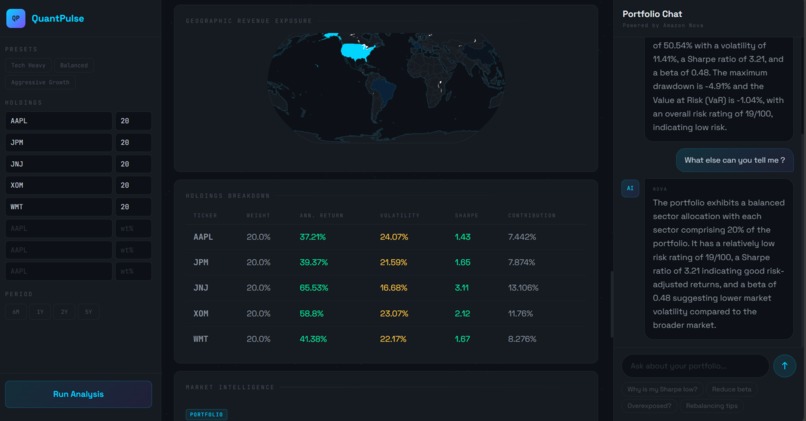
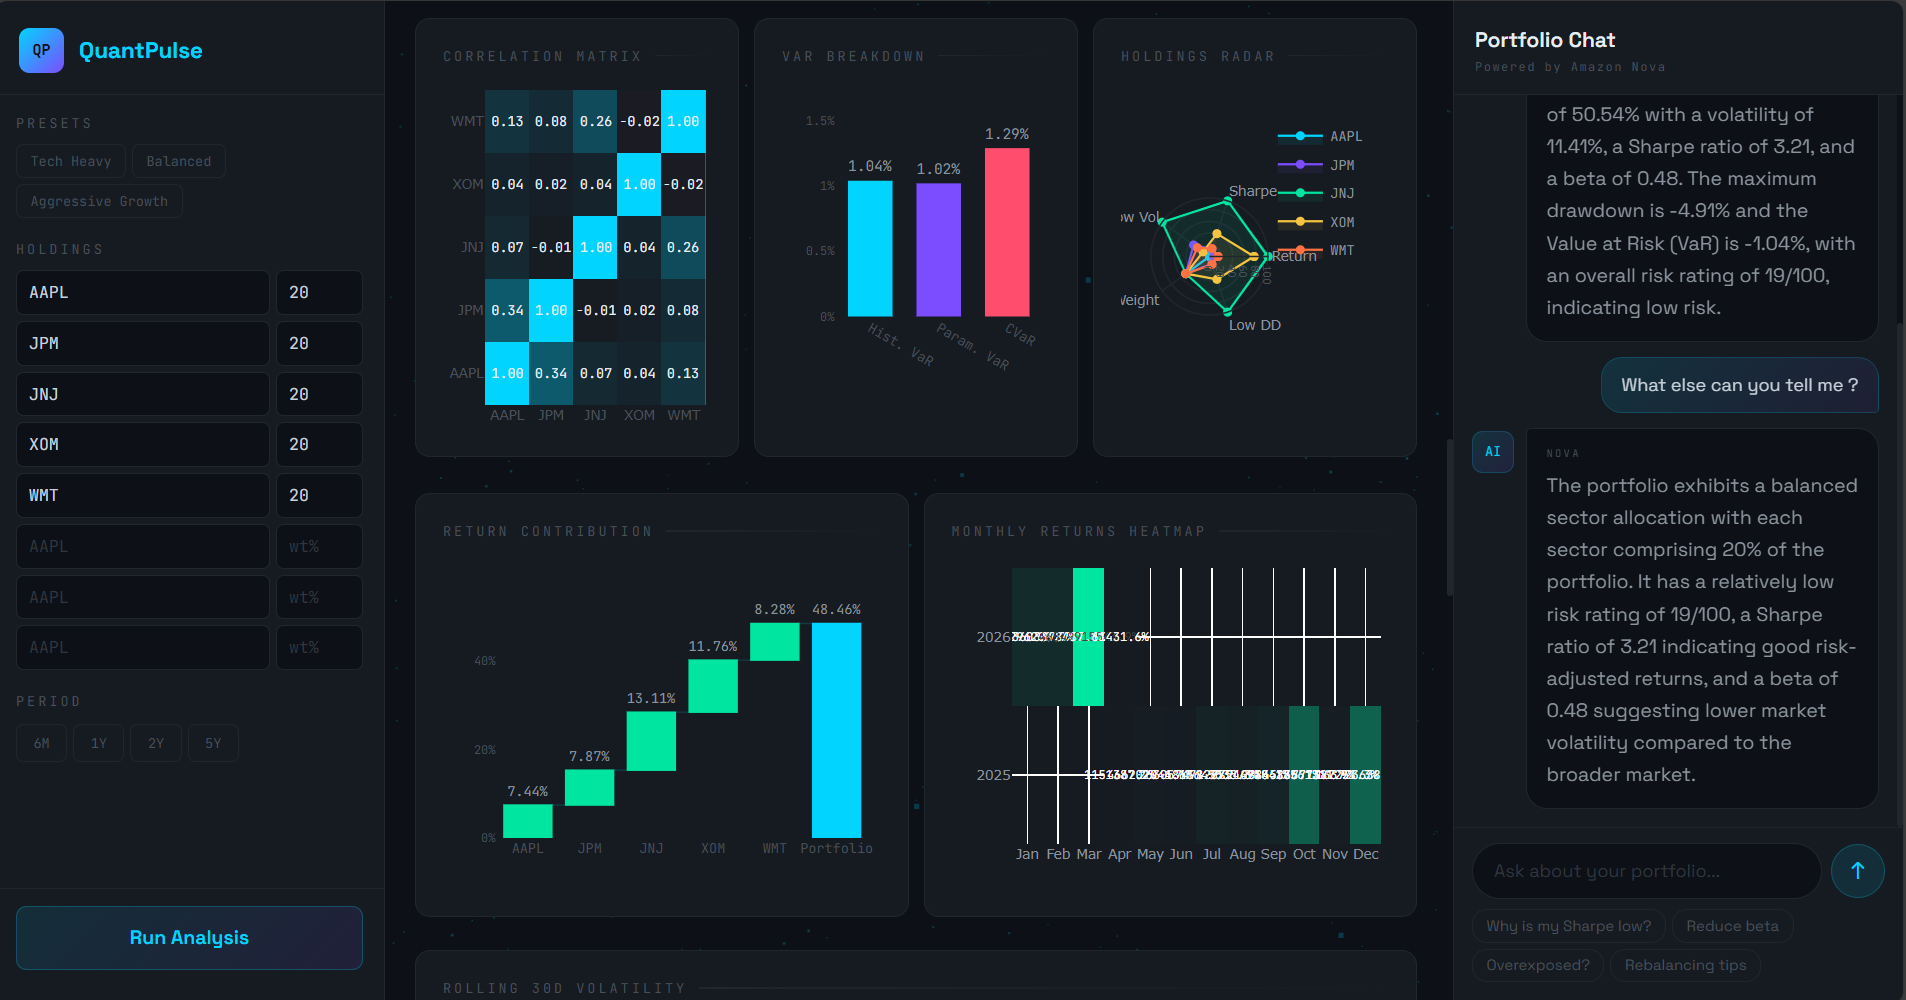
9 Chart Types The dashboard renders: Cumulative Returns, Sector Exposure donut, Correlation Matrix heatmap, VaR Breakdown bar chart, Holdings Radar (multi-axis normalized comparison across all tickers), Return Contribution waterfall, Monthly Returns calendar heatmap, Rolling 30-day Volatility, and a Geographic Revenue Exposure world map showing where your portfolio revenue actually comes from across US, China, Europe, and Asia.
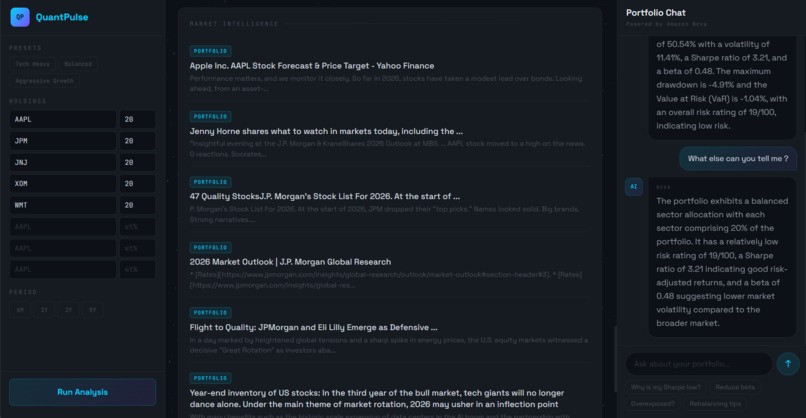
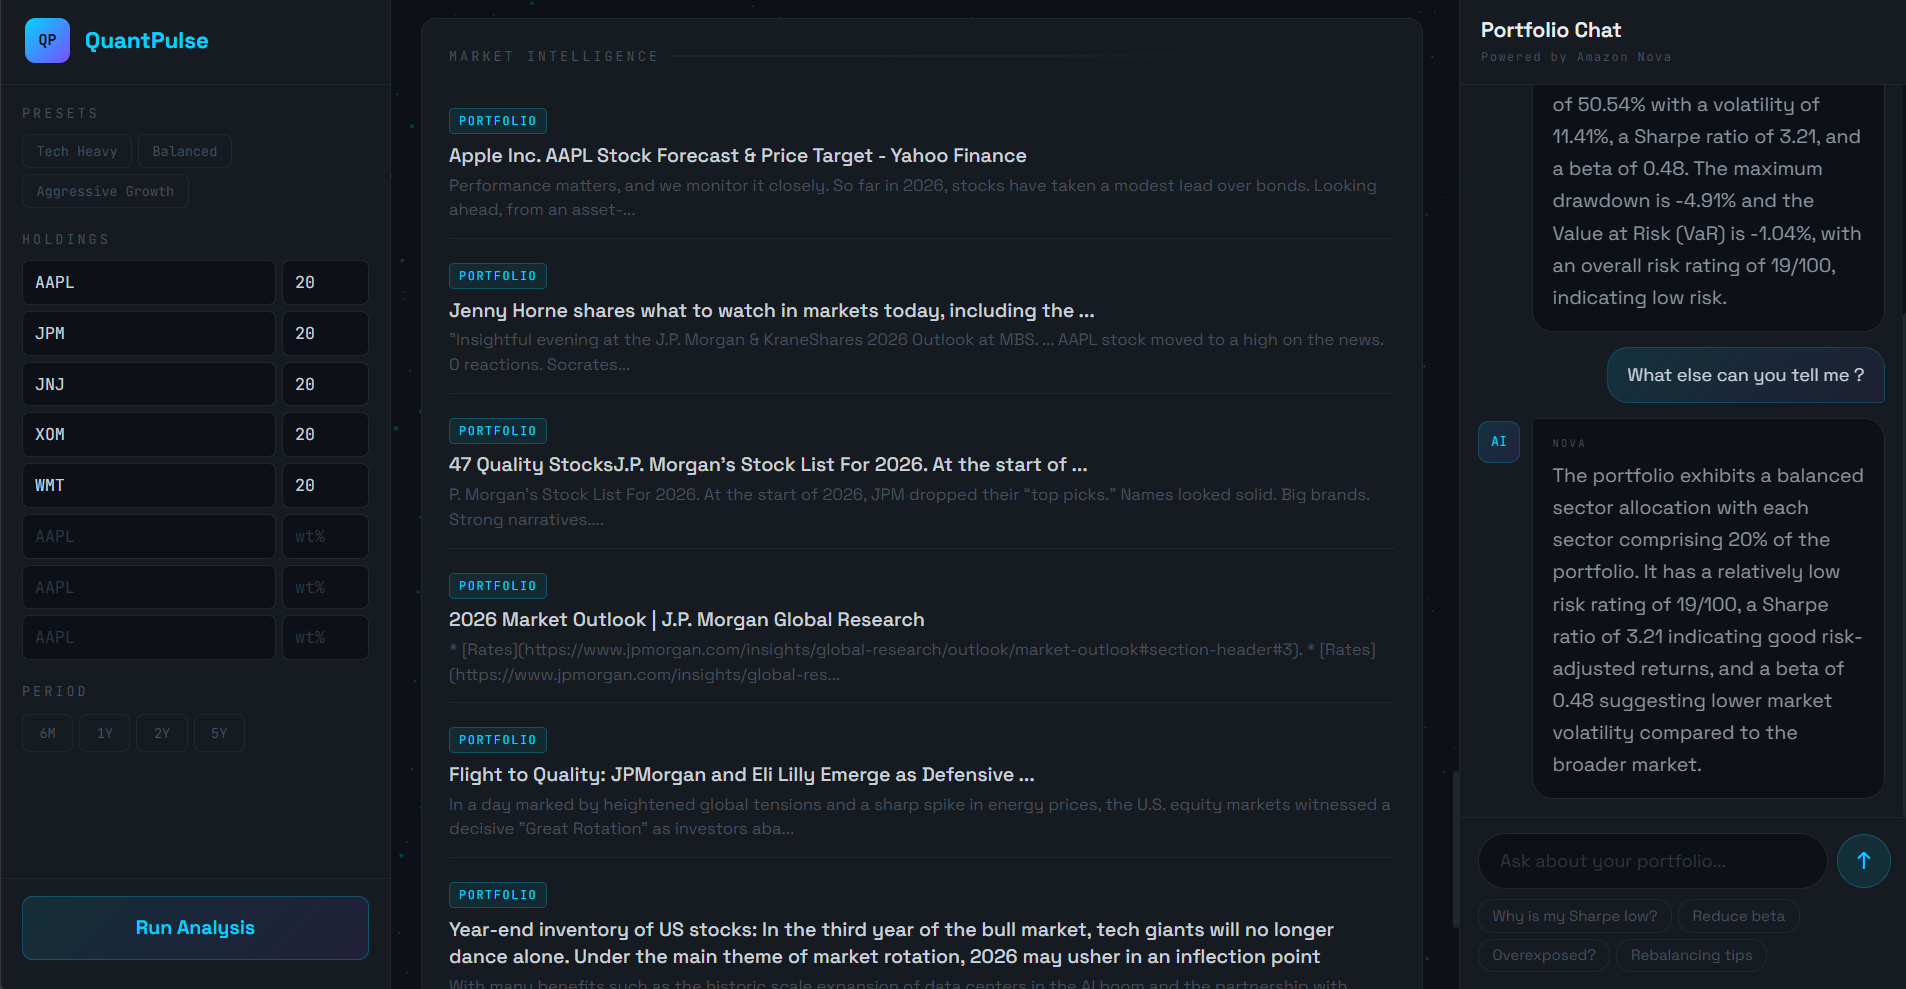
Live Market Intelligence Tavily fetches live news articles relevant to your specific holdings and the current macro environment. Articles are tagged as PORTFOLIO or MACRO and displayed with clickable links.
Portfolio Chat After running an analysis, you can ask the AI anything about your portfolio in natural language. Questions like "why is my Sharpe ratio low?", "how do I reduce beta?", or "am I overexposed to any sector?" get answered with specific numbers from your actual analysis. The chat uses Amazon Nova Lite with the full portfolio context injected into every prompt, so answers reference your real metrics rather than generic financial advice.
3 Preset Portfolios Tech Heavy (AAPL, MSFT, NVDA, GOOGL, META), Balanced (AAPL, JPM, JNJ, XOM, WMT), and Aggressive Growth (NVDA, TSLA, AMD, META, AMZN) let you instantly load and analyze a portfolio to see the system in action.
How I built it
I started with the quant engine since that is the core of the product. I wrote every metric from scratch using NumPy, Pandas, and SciPy so I had full control over the math. No third-party risk libraries.
For the AI layer I chose LangGraph because the sequential node architecture maps perfectly to an analytical pipeline where each step builds context for the next. The risk_scorer node runs first and produces a deterministic 0 to 100 score, then the LLM nodes use that score plus the raw metrics to generate progressively richer analysis. I called Amazon Nova Lite on AWS Bedrock directly via boto3 rather than using ChatBedrock, which gave me cleaner control over the request format.
The frontend is Plotly Dash with a 3-column layout: sidebar for portfolio input, main panel for the dashboard, and a dedicated chat panel on the right. I wrote all the CSS inline in app.index_string for a terminal-aesthetic dark theme. The Three.js star field background runs in assets/warp.js and responds to click events for an interactive warp boost effect.
The backend is FastAPI. Both services run in the same Railway deployment via a start.sh script that launches uvicorn on port 8000 and Dash on the Railway-assigned $PORT.
Challenges I ran into
The biggest challenge was cloud deployment. Yahoo Finance blocks requests from datacenter IPs at the Cloudflare level, which completely broke the data pipeline the moment I deployed to Railway. I had to rebuild the entire data fetching layer to use Alpha Vantage as the primary source with yfinance as a local fallback. I also discovered mid-deployment that outputsize=full is a premium Alpha Vantage feature, so I had to switch to compact (100 days) and adjust the UI accordingly.
The LangGraph state schema caused a subtle but frustrating bug: recommendations is both a TypedDict state key and what I naturally wanted to name the final agent node, which throws a ValueError at runtime. Renaming the node to generate_recommendations fixed it.
Managing Dash callback outputs across the loading screen, results panel, and chat was also complex. Multiple callbacks writing to the same component ID require allow_duplicate=True and careful ordering to avoid race conditions. The two-step chat pattern (step 1 shows user bubble plus thinking dots instantly, step 2 replaces dots with the Nova Lite response) required chaining two separate callbacks via a dcc.Store intermediary.
Accomplishments that I'm proud of
Getting the full pipeline working end to end in a single day is the main one. Quant engine, LangGraph agent with 4 Nova Lite calls, live Tavily news, 9 chart types, geographic world map, and a context-aware chat, all deployed on Railway.
The risk score being fully algorithmic and deterministic is something I care about a lot. It means the score is actually trustworthy and reproducible rather than being an LLM hallucination dressed up as analysis. The LLM explains the score, it does not determine it.
The portfolio chat is also something I am genuinely proud of. Injecting the actual metrics, risk score, sector exposure, and AI recommendations into every chat prompt means Nova Lite answers with real specificity. Ask it about beta and it tells you your actual beta, why it is high or low, and exactly what to buy or sell to bring it down.
What I learned
That Yahoo Finance hates cloud IPs. More seriously, I got much deeper into the math behind CVaR and why it is a better tail risk measure than VaR alone. CVaR tells you what you lose on average in the worst cases, not just the threshold at which bad things start happening. I also learned a lot about structuring LangGraph agents for analytical pipelines where deterministic logic and LLM inference need to coexist cleanly without the LLM contaminating objective metrics.
On the engineering side, managing a multi-service Dash plus FastAPI deployment in a single Railway dyno taught me a lot about process management and port binding in cloud environments.
What's next for QuantPulse | Know your risk. Beat the market.
The most obvious next step is portfolio optimization. Given the full risk analysis, run Modern Portfolio Theory to suggest an optimal rebalancing that maximizes the Sharpe Ratio subject to the user's risk tolerance. The math is already in the engine, it just needs a solver layer on top.
Beyond that I want to add stress testing, simulating how a given portfolio would have performed during the 2008 financial crisis, the 2020 COVID crash, and the 2022 rate hike selloff. Historical drawdown simulation against real crisis periods would make the risk analysis much more concrete and actionable.
Longer term: real-time price streaming with WebSockets so the dashboard updates live during market hours, multi-portfolio comparison to benchmark one allocation against another, and options exposure analysis for portfolios that include derivatives.
Built With
- amazon-web-services
- fastapi
- langchain
- langgraph
- python
- tavily
- yfinance

Log in or sign up for Devpost to join the conversation.