-
-

-

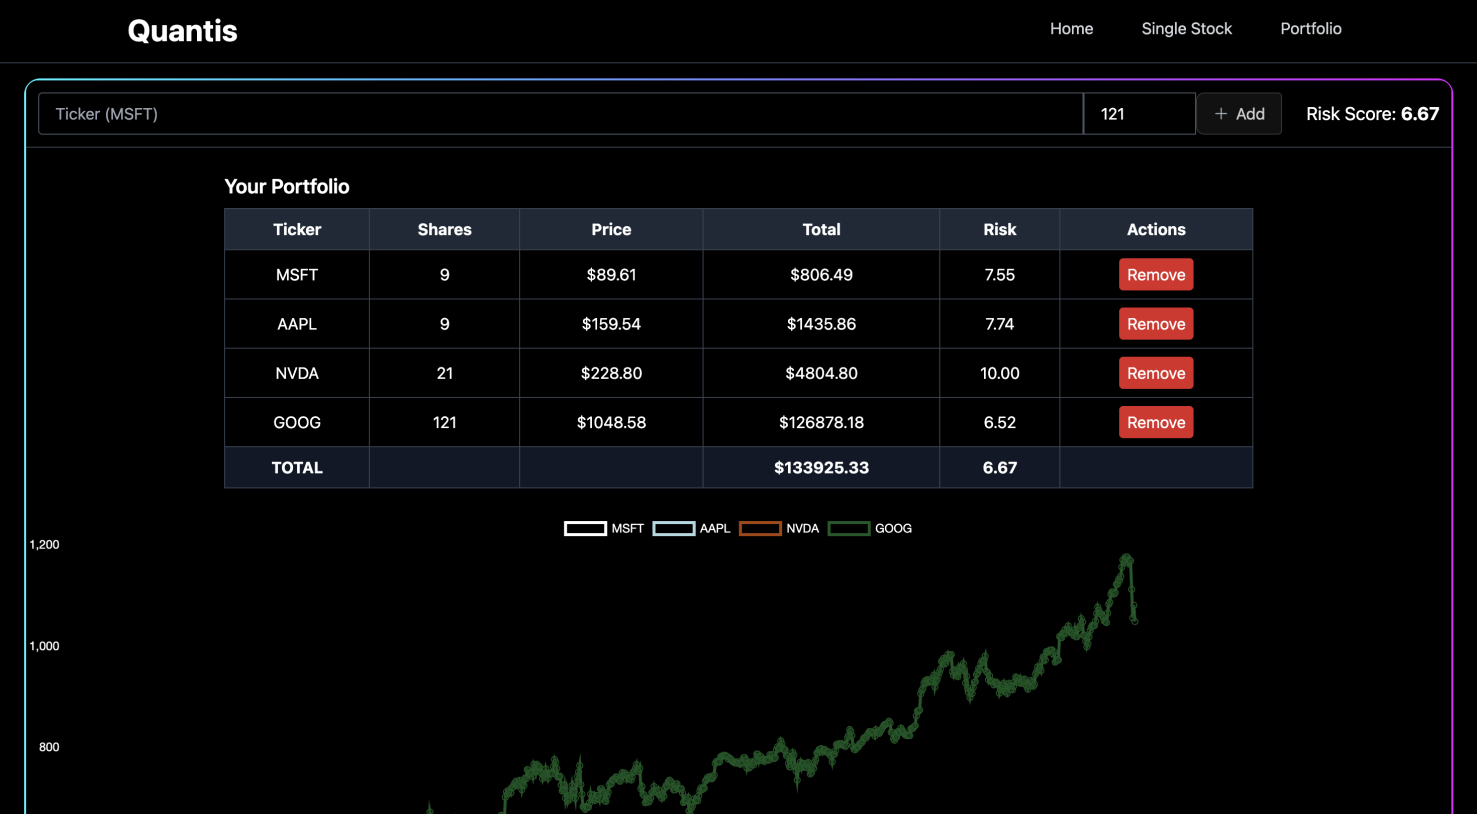
Portfolio Table View - Demo with multiple stocks
-
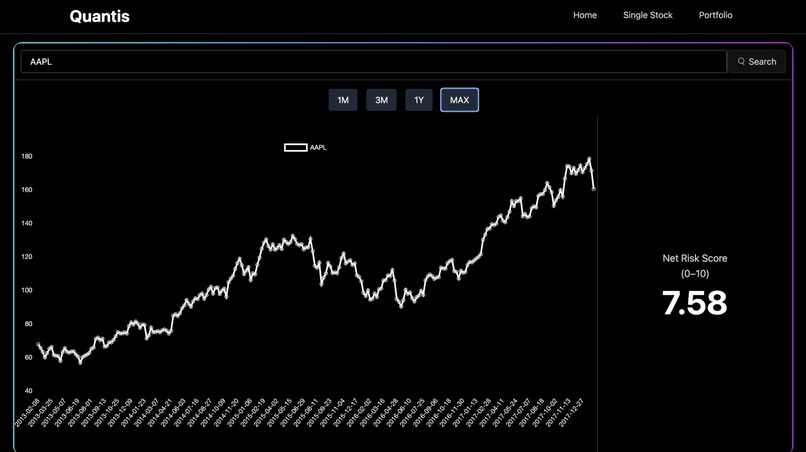
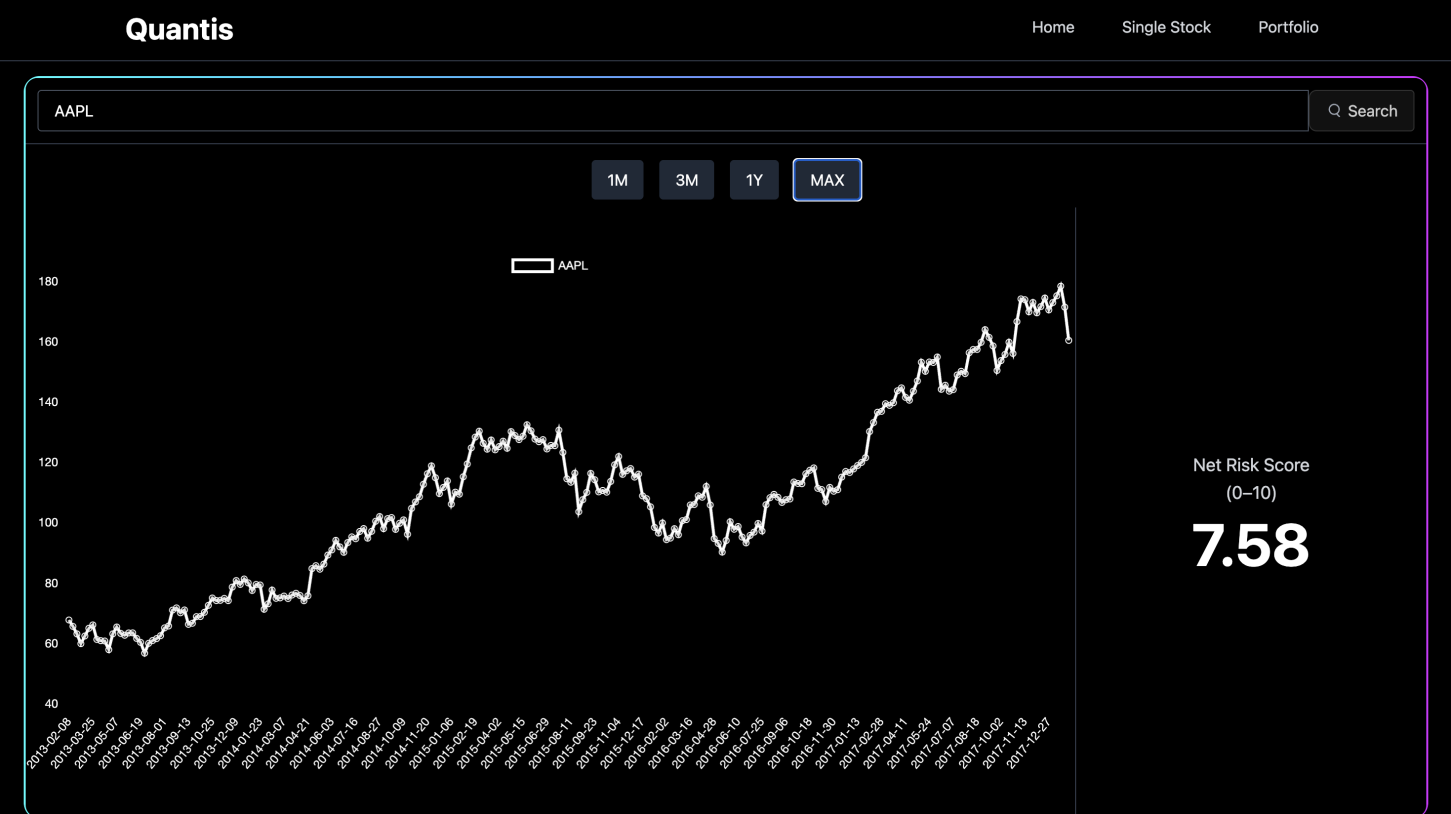
Single Stock Viewer - Demo with Apple
-
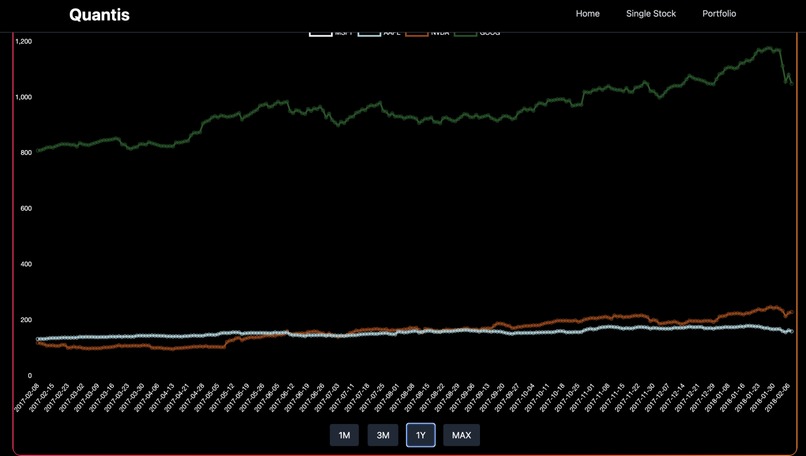
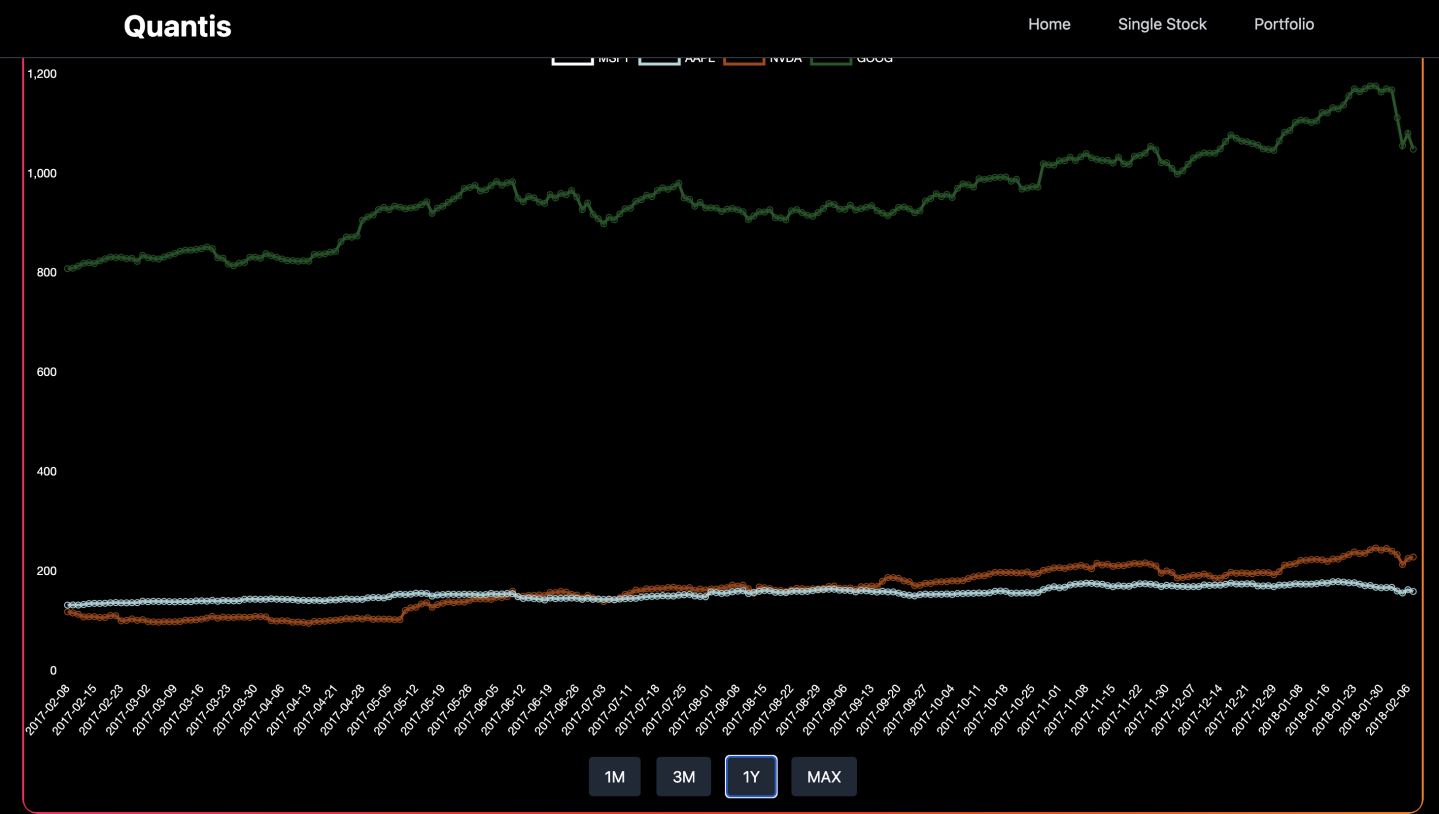
Portfolio Chart View - Demo with multiple stocks

Quantis — Trading, Simplified
Inspiration
We were inspired by the need for a simple, visual, and interactive tool to understand stock risk and portfolio performance. Traditional trading platforms are often overwhelming, with too many metrics and charts. We wanted a single place where traders, both beginner and advanced, could quickly visualize stock trends, calculate risk, and experiment with portfolios.
What We Learned
Building Quantis taught us several valuable lessons:
- Frontend design with Tailwind CSS: We learned how to create a sleek, responsive, and modern interface with dynamic elements, such as glowing borders, hover effects, and gradient animations.
- Chart.js for data visualization: We explored how to render complex time-series data in interactive charts, including downsampling large datasets for performance.
- JavaScript data handling: We learned how to parse CSV files, manipulate arrays, and compute metrics like volatility.
How We Built It
- HTML + Tailwind CSS: We structured the UI with semantic HTML and styled it with Tailwind for responsive design. We added animations for a modern look.
- JavaScript & Chart.js: We loaded historical stock data from CSV files. We implemented functions to filter, downsample, and plot stock and portfolio data. We calculated individual stock risk and portfolio-weighted risk.
- Portfolio Management: Users can add/remove stocks and shares, dynamically updating charts and tables.
- Interactivity: We implemented buttons for switching between time ranges (1M, 3M, 1Y, MAX) and sections (Home, Single Stock, Portfolio).
Challenges We Faced
- Large datasets: Plotting 5 years of daily stock data (~1250 points per stock) caused performance issues. We solved this by downsampling the data while preserving trends.
- Dynamic chart updates: Updating Chart.js charts with new data required careful destruction and reinitialization to prevent memory leaks.
- Risk calculation nuances: Weighting risk by position size was tricky but essential for accurate portfolio risk scores.
- Autofill styling: Chrome’s autofill clashed with dark mode. We had to override it with custom CSS.
Quantis is now a fast, visually appealing, and interactive risk engine for traders who want to explore stock and portfolio risk without the clutter of traditional platforms.
What we plan to do next
- We hope to integrate a more complex formula or potentially AI that scans the API's history and gives future predictions of the stock not just the risk of it
- Calculate correlation coefficients to measure the strength and direction of the relationship between our two variables.
- Consider running regression analysis if appropriate, to test predictive power.
Built With
- css
- html
- javascript
- tailwindcss

Log in or sign up for Devpost to join the conversation.