-
-

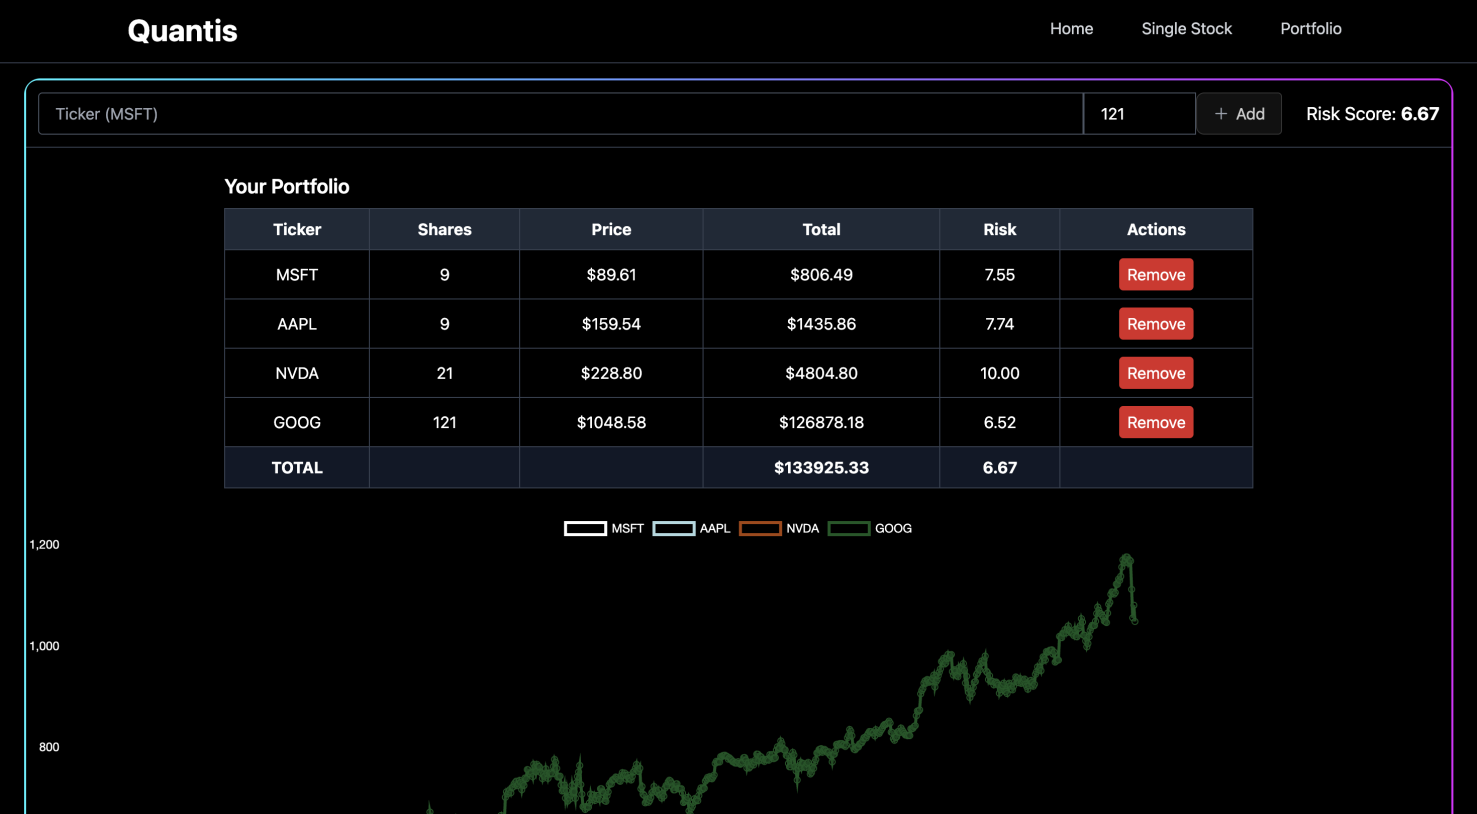
Portfolio Table View - Demo with multiple stocks
-
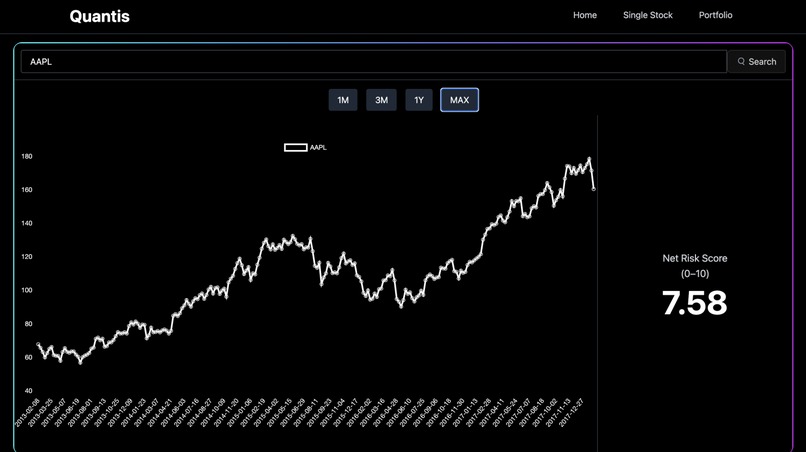
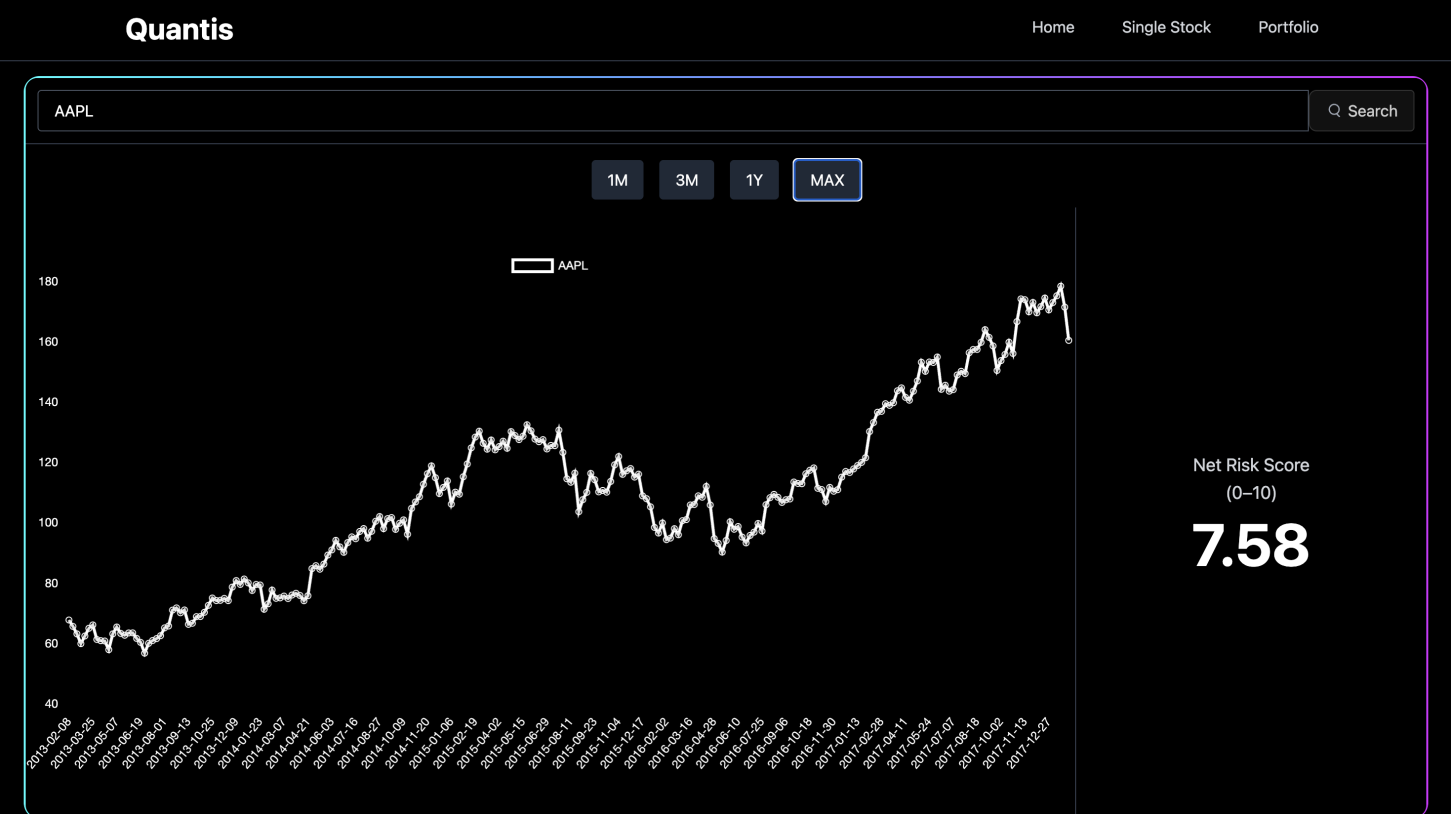
Single Stock Viewer - Demo with Apple
-
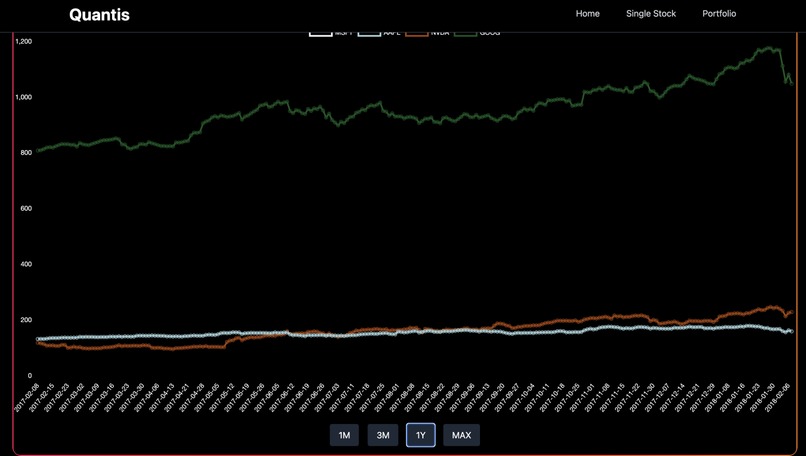
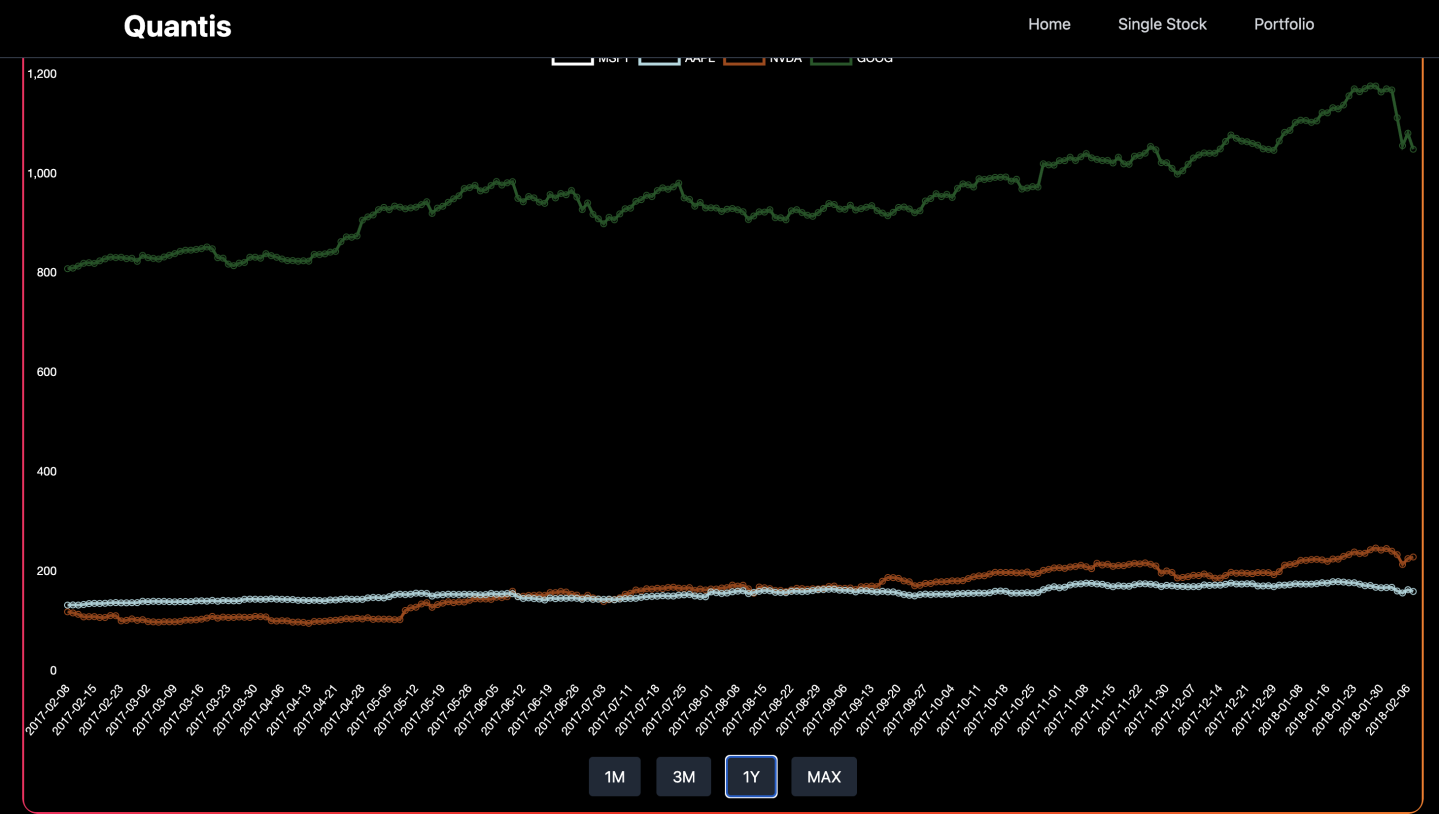
Portfolio Chart View - Demo with multiple stocks
Inspiration
We were inspired by the need for a simple, visual, and interactive tool to understand stock risk and portfolio performance. Traditional trading platforms are often overwhelming, with too many metrics and charts. We wanted a single place where traders, both beginner and advanced, could quickly visualize stock trends, calculate risk, and experiment with portfolios.
What it does
Quantis is a trading bot and visualization platform that helps users:
- Calculate the risk of individual stocks using volatility-based metrics.
- Explore historical price data through interactive time-series charts.
- Build and manage portfolios by adding or removing stocks and adjusting position sizes.
- Generate a portfolio-wide risk score that dynamically updates as allocations change.
In short, Quantis combines simplicity, interactivity, and meaningful analytics to make risk evaluation more accessible.
How we built it
HTML + Tailwind CSS: We structured the UI with semantic HTML and styled it with Tailwind for responsive design. We added animations for a modern look. JavaScript & Chart.js: We loaded historical stock data from CSV files. We implemented functions to filter, downsample, and plot stock and portfolio data. We calculated individual stock risk and portfolio-weighted risk. Portfolio Management: Users can add/remove stocks and shares, dynamically updating charts and tables. Interactivity: We implemented buttons for switching between time ranges (1M, 3M, 1Y, MAX) and sections (Home, Single Stock, Portfolio).
Challenges we ran into
Large datasets: Plotting 5 years of daily stock data (~1250 points per stock) caused performance issues. We solved this by downsampling the data while preserving trends. Dynamic chart updates: Updating Chart.js charts with new data required careful destruction and reinitialization to prevent memory leaks. Risk calculation nuances: Weighting risk by position size was tricky but essential for accurate portfolio risk scores. Autofill styling: Chrome’s autofill clashed with dark mode. We had to override it with custom CSS. Quantis is now a fast, visually appealing, and interactive risk engine for traders who want to explore stock and portfolio risk without the clutter of traditional platforms.
Accomplishments that we're proud of
- Successfully built a full-featured trading risk engine in a short timeframe.
- Created an intuitive and modern UI that makes financial data approachable.
- Implemented real-time portfolio updates, letting users see risk scores change as they add/remove stocks.
- Solved performance bottlenecks in data visualization by using smart downsampling.
What we learned
Building Quantis taught us several valuable lessons:
Frontend design with Tailwind CSS: We learned how to create a sleek, responsive, and modern interface with dynamic elements, such as glowing borders, hover effects, and gradient animations. Chart.js for data visualization: We explored how to render complex time-series data in interactive charts, including downsampling large datasets for performance. JavaScript data handling: We learned how to parse CSV files, manipulate arrays, and compute metrics like volatility.
What's next for Quantis
We want to extend Quantis beyond a prototype and into a tool that traders can rely on daily. Future plans include:
- Real-time market data: Integrating live APIs instead of static CSVs.
- Advanced metrics: Adding Sharpe ratio, beta, and correlation analysis for deeper insights.
- AI-powered insights: Using machine learning to forecast risk trends.
- User accounts and cloud storage: Saving portfolios and syncing them across devices.
- Mobile optimization: Creating a streamlined mobile experience for on-the-go portfolio checks.
Built With
- css
- html
- javascript
- tailwindcss

Log in or sign up for Devpost to join the conversation.