-
-
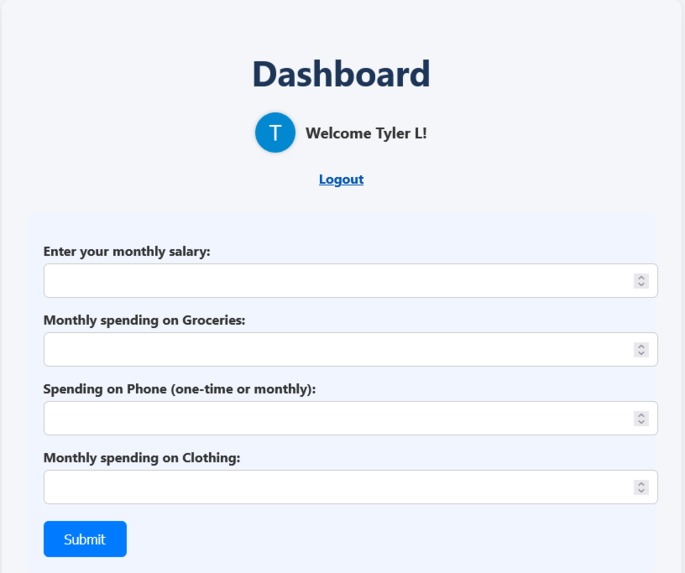
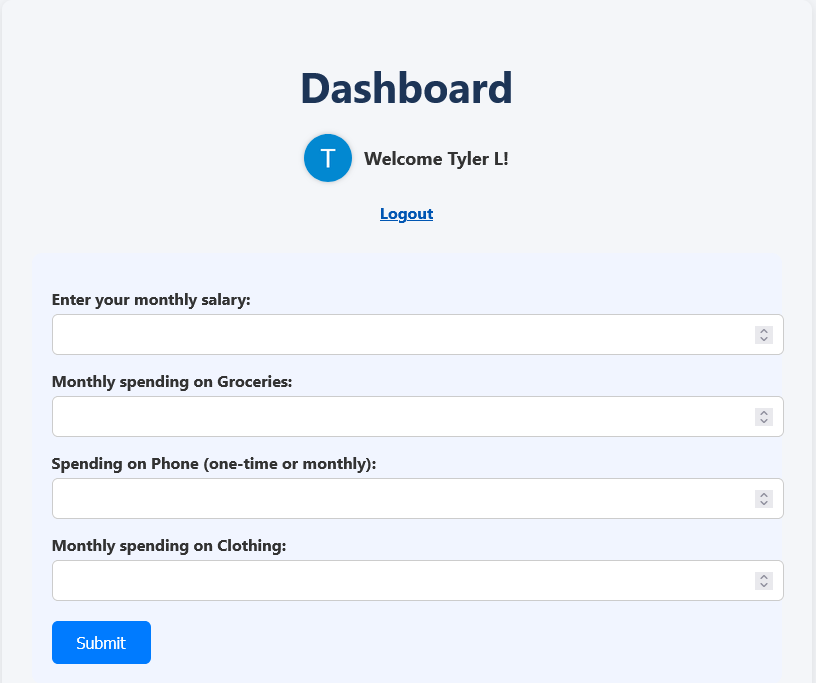
dashboard
-
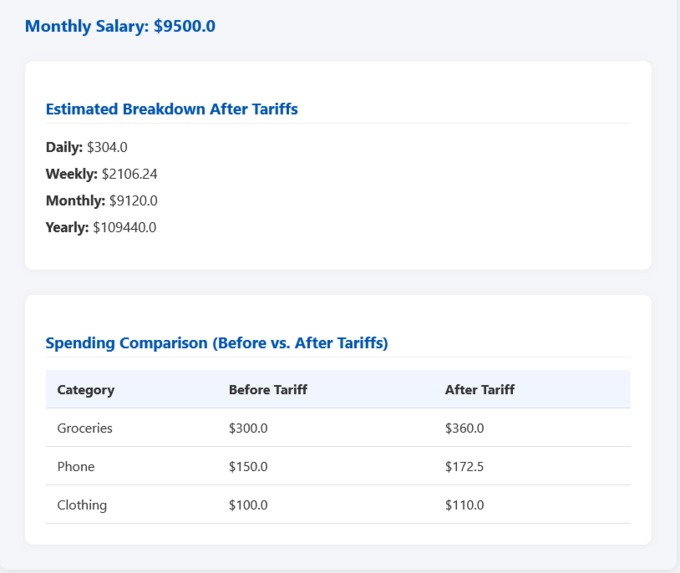
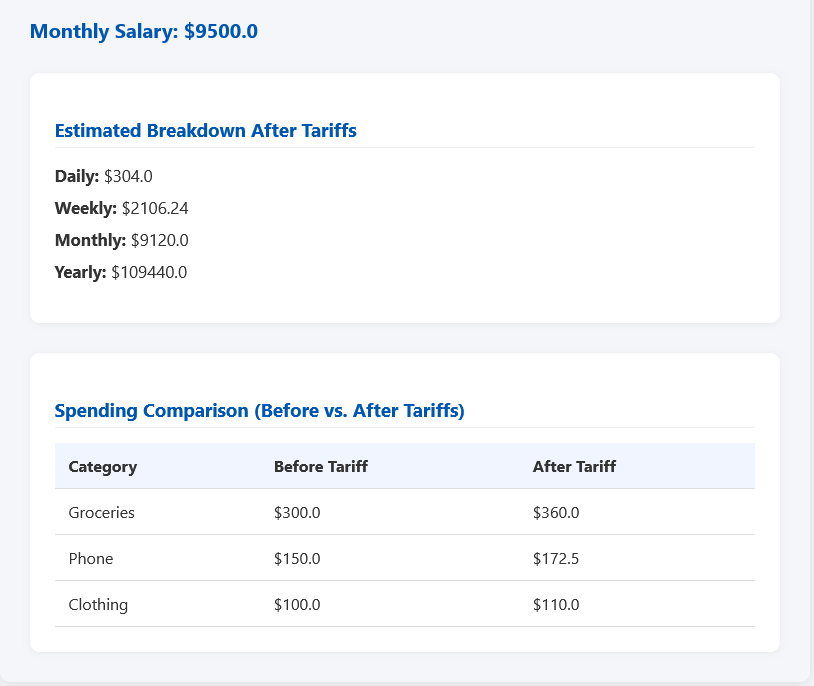
dashboard-comparison
-
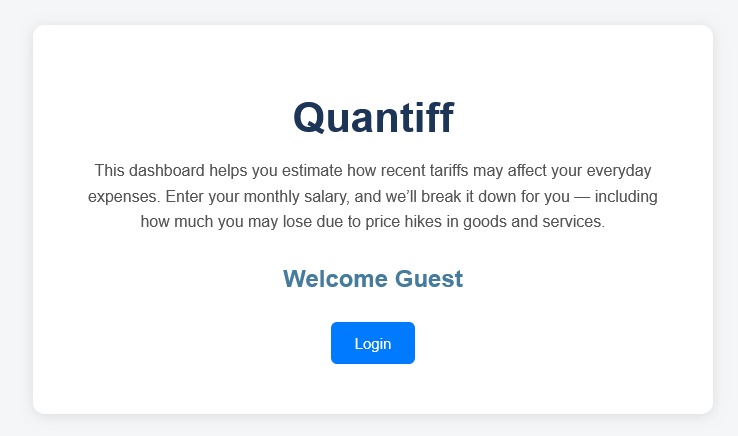
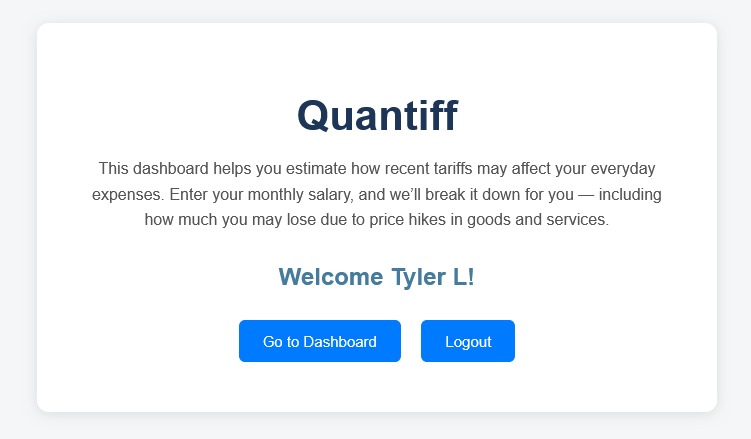
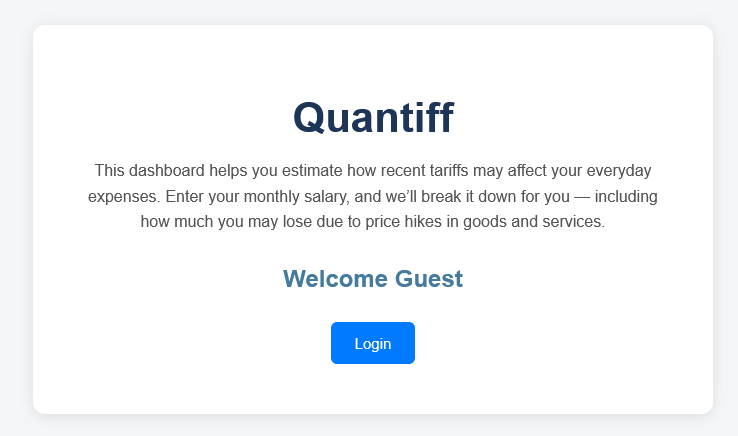
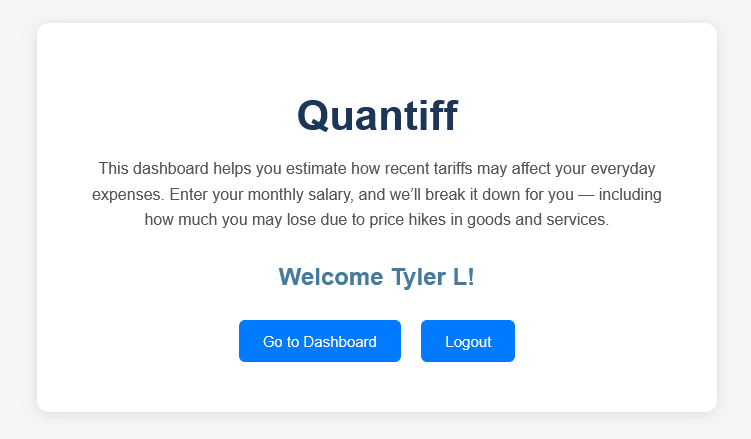
home
-

-
-

Inspiration
Quantiff was inspired by the growing global economic changes and how tariffs affect everyday costs. I wanted to create a tool that helps users understand and track these price impacts on their personal finances.
What it does
Quantiff helps users estimate how recent tariffs affect their expenses. By entering their salary and spending habits, users get a breakdown of how much they might lose due to price hikes in goods and services.
How I built it
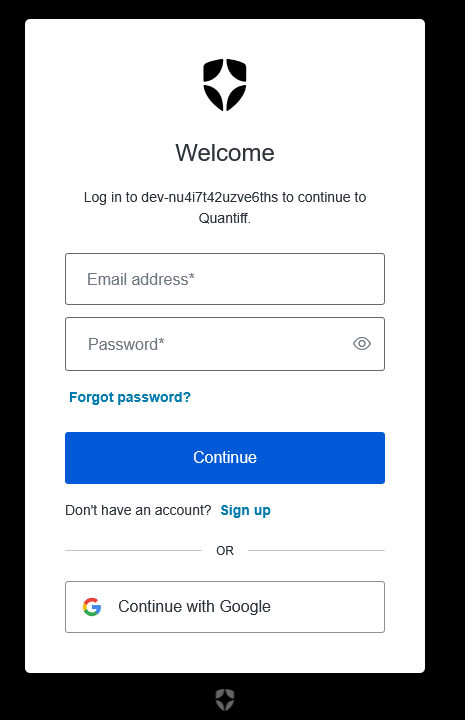
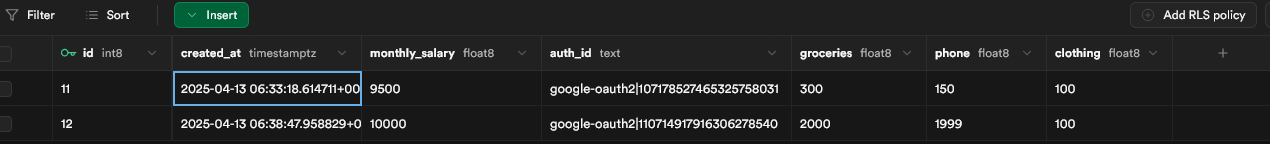
I built Quantiff using Flask for the backend, with data processed and displayed through HTML forms and dynamic templates. I used Supabase for data storage and Auth0 for authentication. The frontend was styled with custom CSS for a user-friendly experience.
Challenges we ran into
One of the biggest challenges was accurately calculating the effects of tariffs on different spending categories. We also faced some technical hurdles with integrating Auth0 for authentication and ensuring smooth data flow between the backend and frontend.
Accomplishments that I'm proud of
I'm proud of the clean and intuitive user interface that allows users to easily input their data and receive personalized reports. The tariff breakdown feature also works seamlessly, giving users actionable insights.
What I learned
Through this project, I learned a lot about integrating external services like Auth0, as well as handling real-time data processing in a web application.
What's next for Quantiff
Next, Iplan to expand Quantiff by adding more detailed financial analytics, integrating live tariff data from global sources, and offering users personalized tips for managing their expenses.

Log in or sign up for Devpost to join the conversation.