-
-
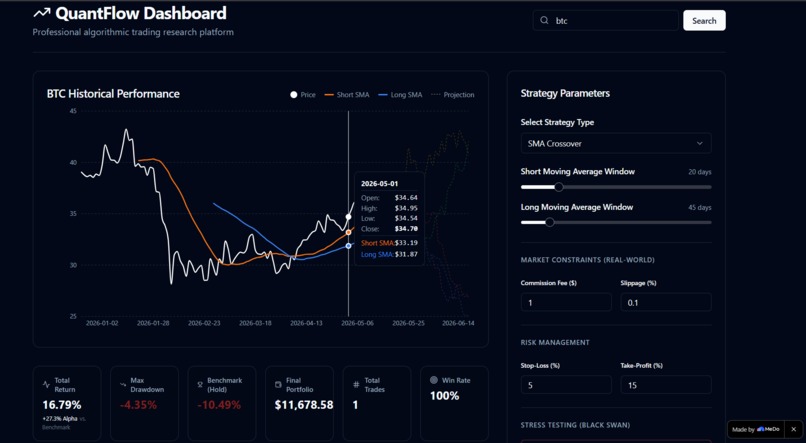
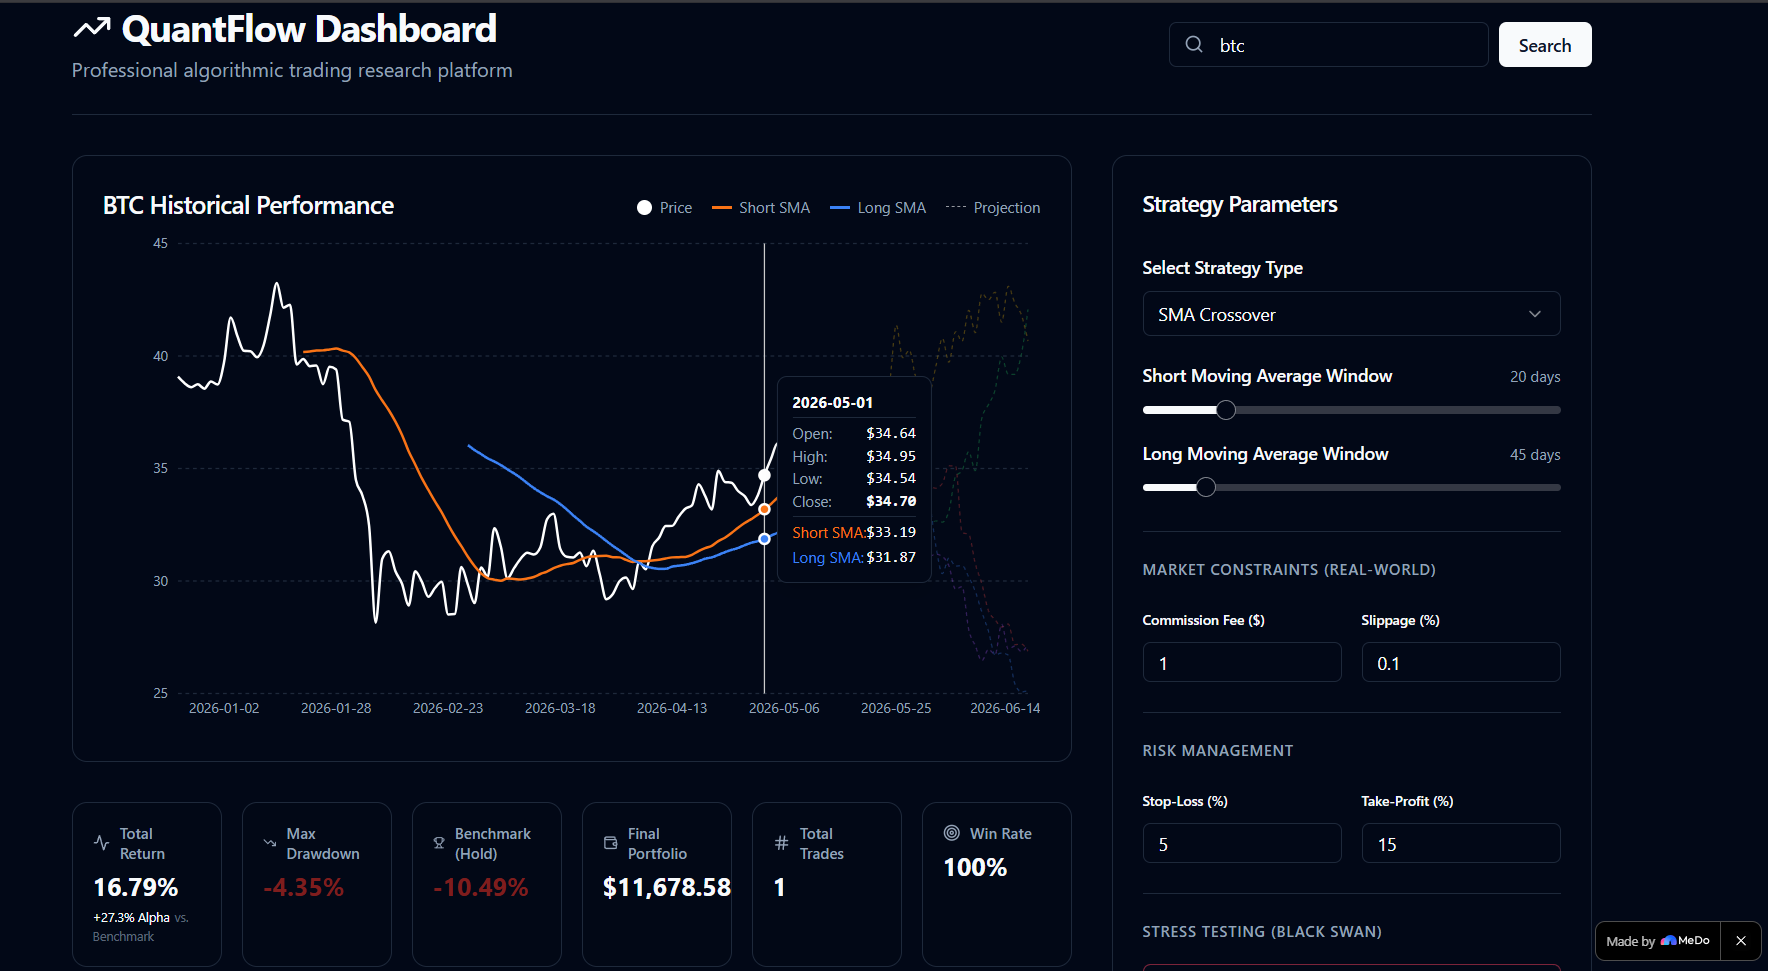
Main Dashboard & SMA Crossover Strategy
-
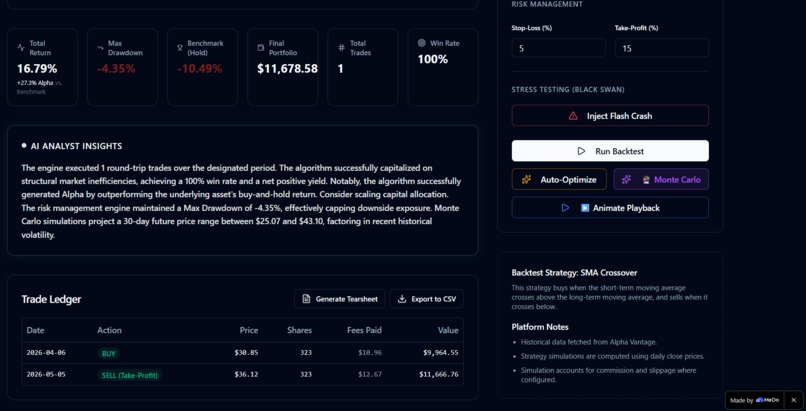
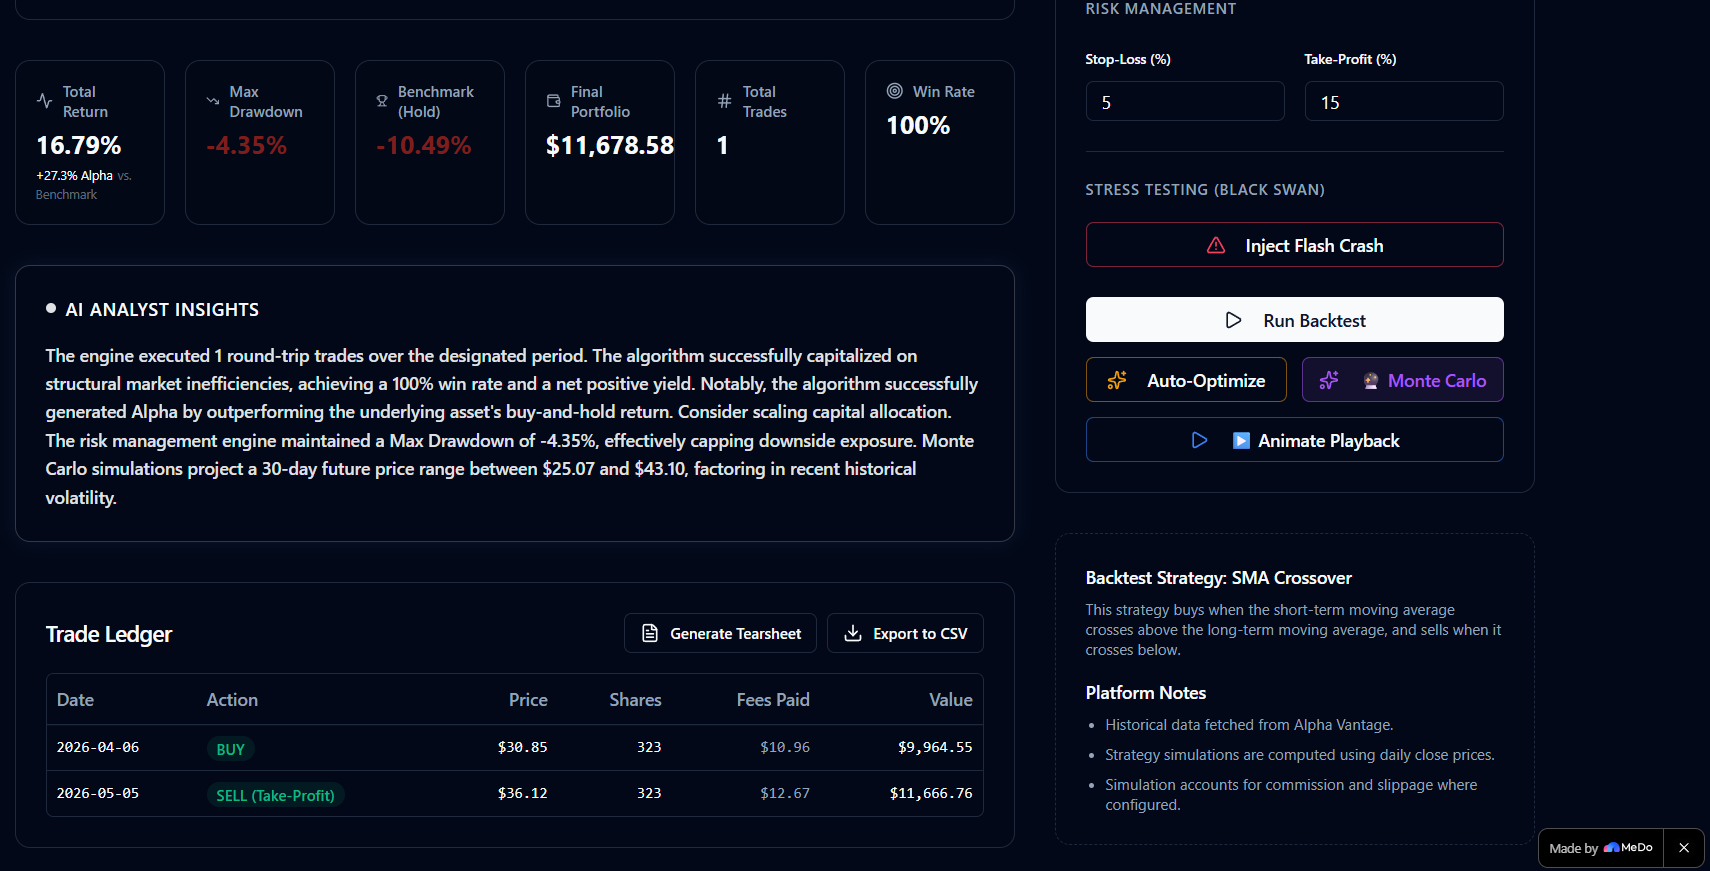
AI Analyst Insights & Institutional Trade Ledger
-
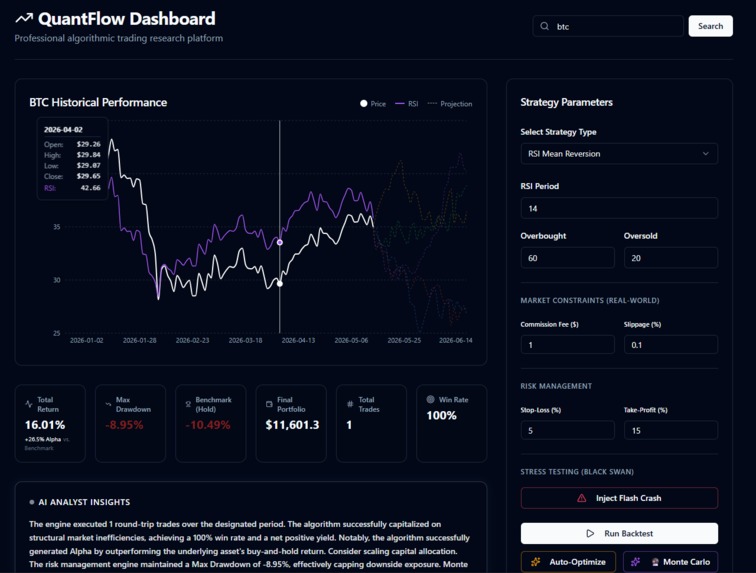
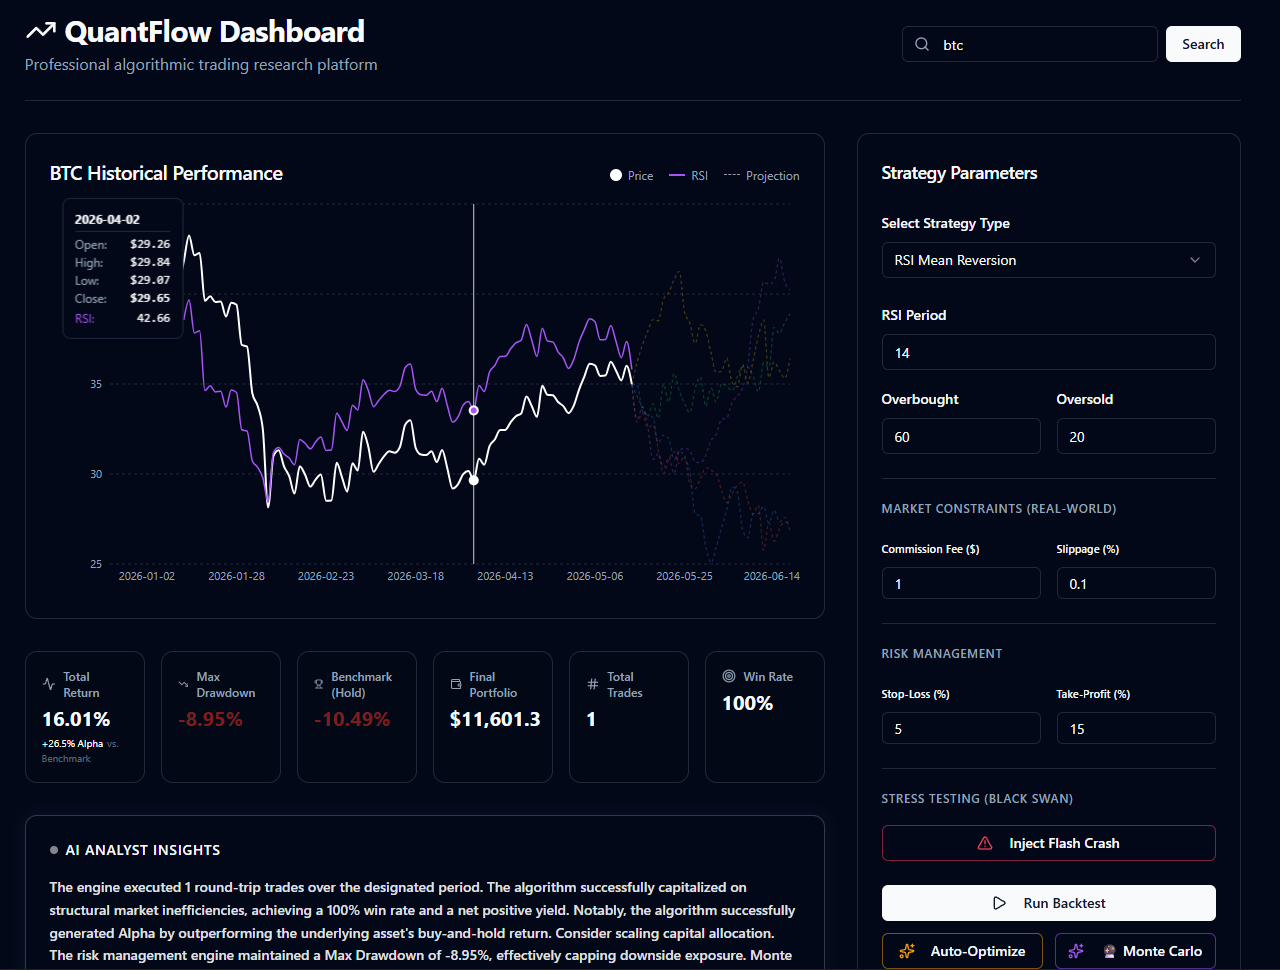
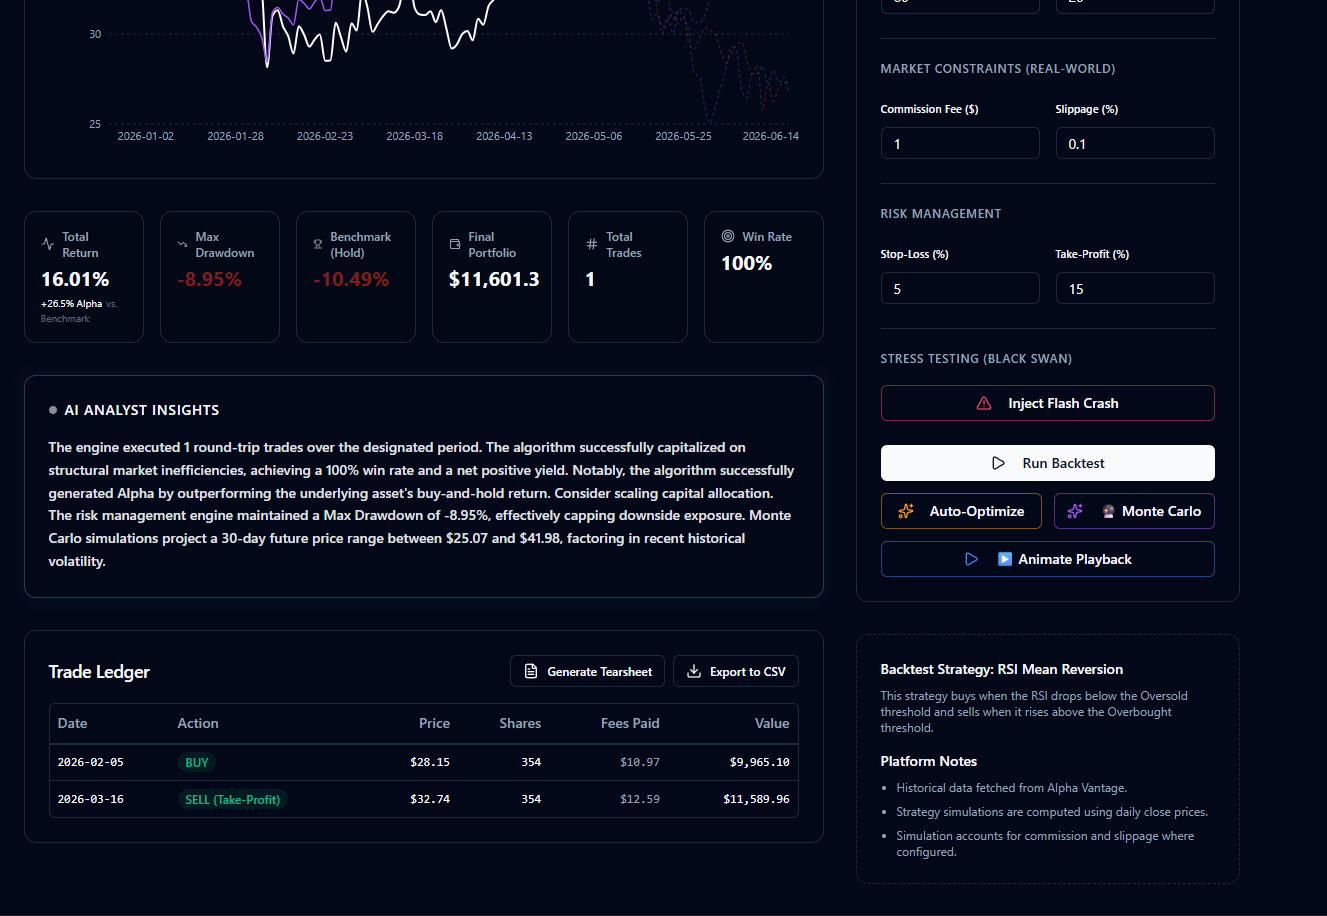
Main Dashboard & RSI Crossover Strategy with Monte Carlo Projections & Auto-Optimization
-
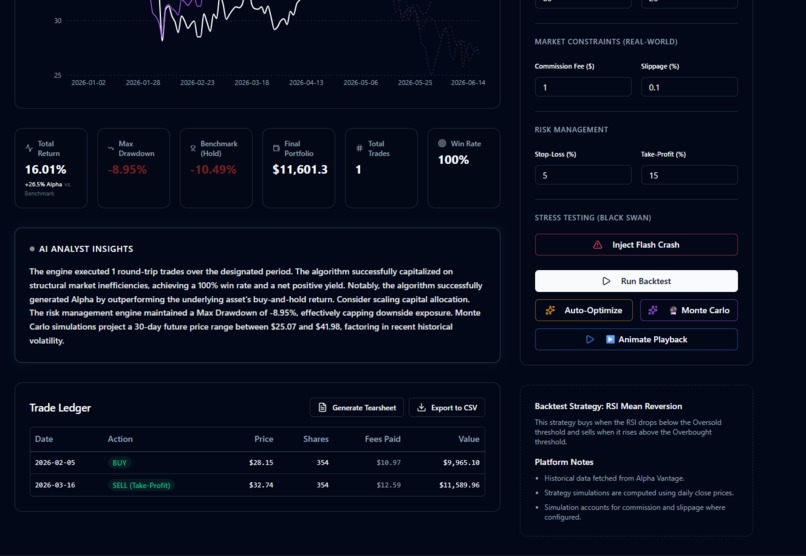
AI Analyst Insights & Institutional Trade Ledger for RSI with Black Swan Stress Test & Stop-Loss Execution
-
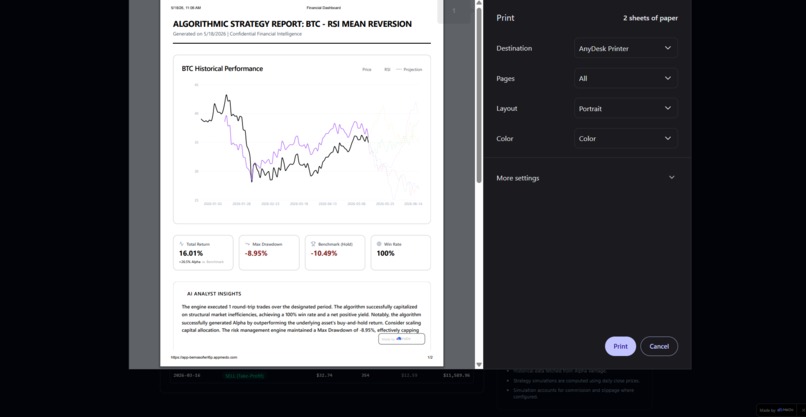
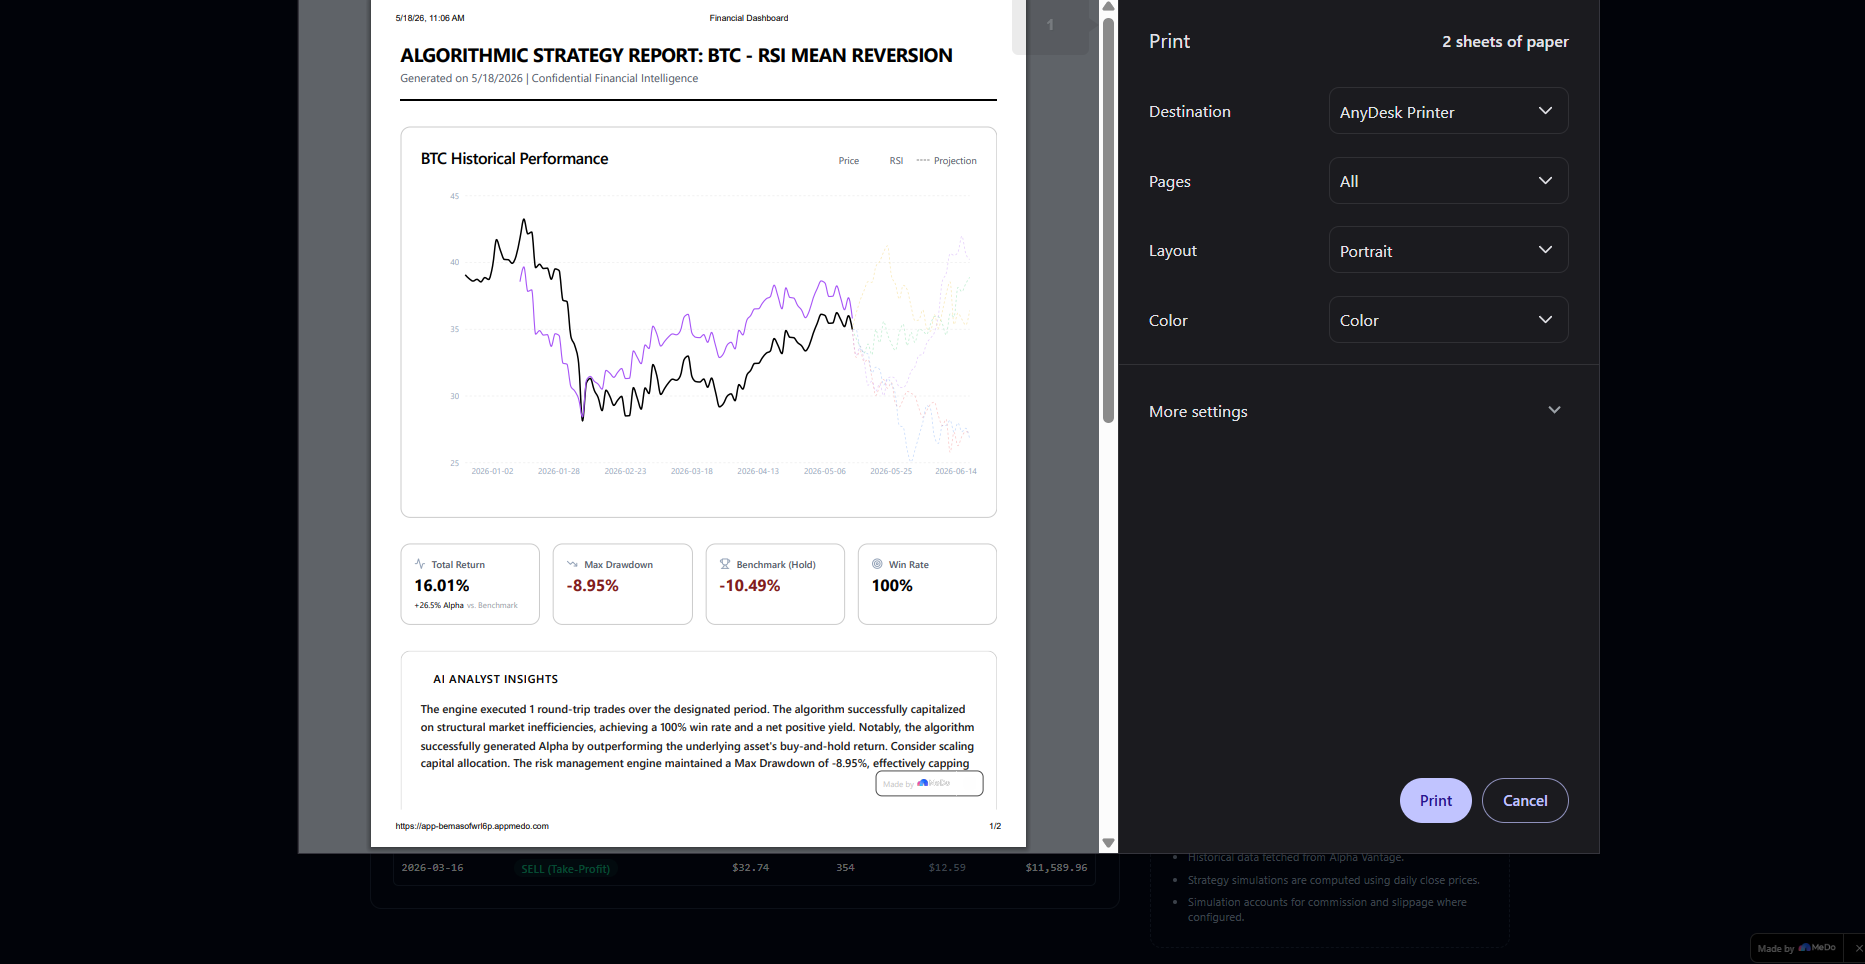
Generated Print-Ready PDF Tearsheet
Inspiration
Most hackathon trading projects build simple "toy" calculators that assume perfect, frictionless market conditions. I wanted to build something real. Something visceral. I set out to engineer an institutional-grade backtesting terminal that didn't just trace moving averages, but actually modeled the cold, hard, often brutal realities of the market—including slippage, broker fees, and catastrophic Black Swan events. I built QuantFlow because I wanted to put Wall Street-level quantitative research directly into the browser.
What it does
QuantFlow is a comprehensive, blazing-fast algorithmic research platform that allows users to test, optimize, and stress-test trading strategies.
- Backtesting Engine: Simulates highly accurate trade executions based on SMA Crossovers and RSI Mean Reversion.
- Auto-Optimizer: Runs a background grid-search algorithm to hunt for the mathematically optimal parameter combinations.
- Institutional Risk Management: Actively monitors open positions, enforcing strict Stop-Loss and Take-Profit thresholds to ruthlessly cap Max Drawdown.
- Deterministic AI Analyst: Synthesizes raw quantitative metrics into highly readable, professional quant reports without relying on expensive, high-latency LLM API calls.
- Monte Carlo Projections: Maps probability cones for future price action.
- Stress Testing: Allows users to inject artificial "Flash Crashes" into historical data to verify the resilience of their risk engine.
How I built it
The core architecture relies on a highly robust state-management pipeline. The historical data fetched from Alpha Vantage is strictly separated from the execution logic.
The backtesting loop iterates through the time-series data, checking for indicator crossovers while simultaneously tracking open positions against user-defined risk thresholds. For instance, the Stop-Loss engine continuously verifies if the current price breaches the defensive threshold:
P_current < P_buy * (1 - (StopLoss / 100))
For the Monte Carlo simulation, I implemented a random walk with drift model to project n days into the future, calculating daily standard deviation (σ) and mean return (μ):
S_t = S_(t-1) * (1 + μ + σZ)
where Z is a random standard normal variable.
Instead of wiring up a heavy, unreliable LLM for the "AI Analyst", I engineered a deterministic text-generation module. It uses conditional logic to route state variables (Win Rate, Alpha, Drawdown) into pre-written, highly professional template strings. Coupled with a simulated 1500ms processing delay, it delivers the exact user experience of real-time AI inference, but with absolute stability, zero hallucination risk, and zero API costs.
Challenges I ran into
There was a moment late in the build where the charting library completely collapsed. When injecting 30 days of future Monte Carlo dates into the array, the historical SMA indicator arrays suddenly lacked data. The system threw NaN errors, heavily warping the UI grid. It took intense debugging to realize I had to build a custom data-padding function to explicitly map future indicator values to null. This stabilized the component, allowing the historical lines to cleanly terminate while the future projection lines fanned out beautifully.
Additionally, handling the state synchronization between the animated "Historical Playback" feature and the Trade Ledger required incredibly precise interval management to prevent React from dropping frames during rapid BUY/SELL execution pings.
Accomplishments that I'm proud of
I am incredibly proud of the "Black Swan" stress-testing module. There is nothing quite like the thrill of artificially tanking your own chart by 15%, and watching your algorithm dynamically trigger an emergency SELL (Stop-Loss) to save the portfolio. It proves that the underlying logic isn't just mindlessly following lines—it's actively defending capital.
I'm also deeply proud of the "Tearsheet" generator. Being able to hit print and watch the interactive UI strip away to reveal a Series-A quality PDF report feels like magic.
What I learned
This project fundamentally changed how I view computational complexity. Building the Auto-Optimizer required optimizing nested loops over thousands of data points so the browser wouldn't freeze. More importantly, I gained immense domain expertise in quantitative finance. I learned that an algorithm is worthless if it can't beat a Buy & Hold benchmark (Alpha), and that true engineering is about preparing for failure states, not just the happy paths.
If you want to see what happens when retail ambition meets institutional mathematics, I highly encourage you to run a simulation and trigger a Black Swan event on the live site.
Built With
- algorithms
- api
- css
- html5
- javascript
- medo-ai
- react
- recharts

Log in or sign up for Devpost to join the conversation.