Inspiration
Financial markets are complex and unpredictable, but most tools don’t let beginners explore them interactively. We wanted to make quantitative finance concepts more accessible and practical. Inspired by real-world models like GBM and Black-Scholes, this project simplifies them into a usable tool. It helps users understand risk and price behaviour through simulation.
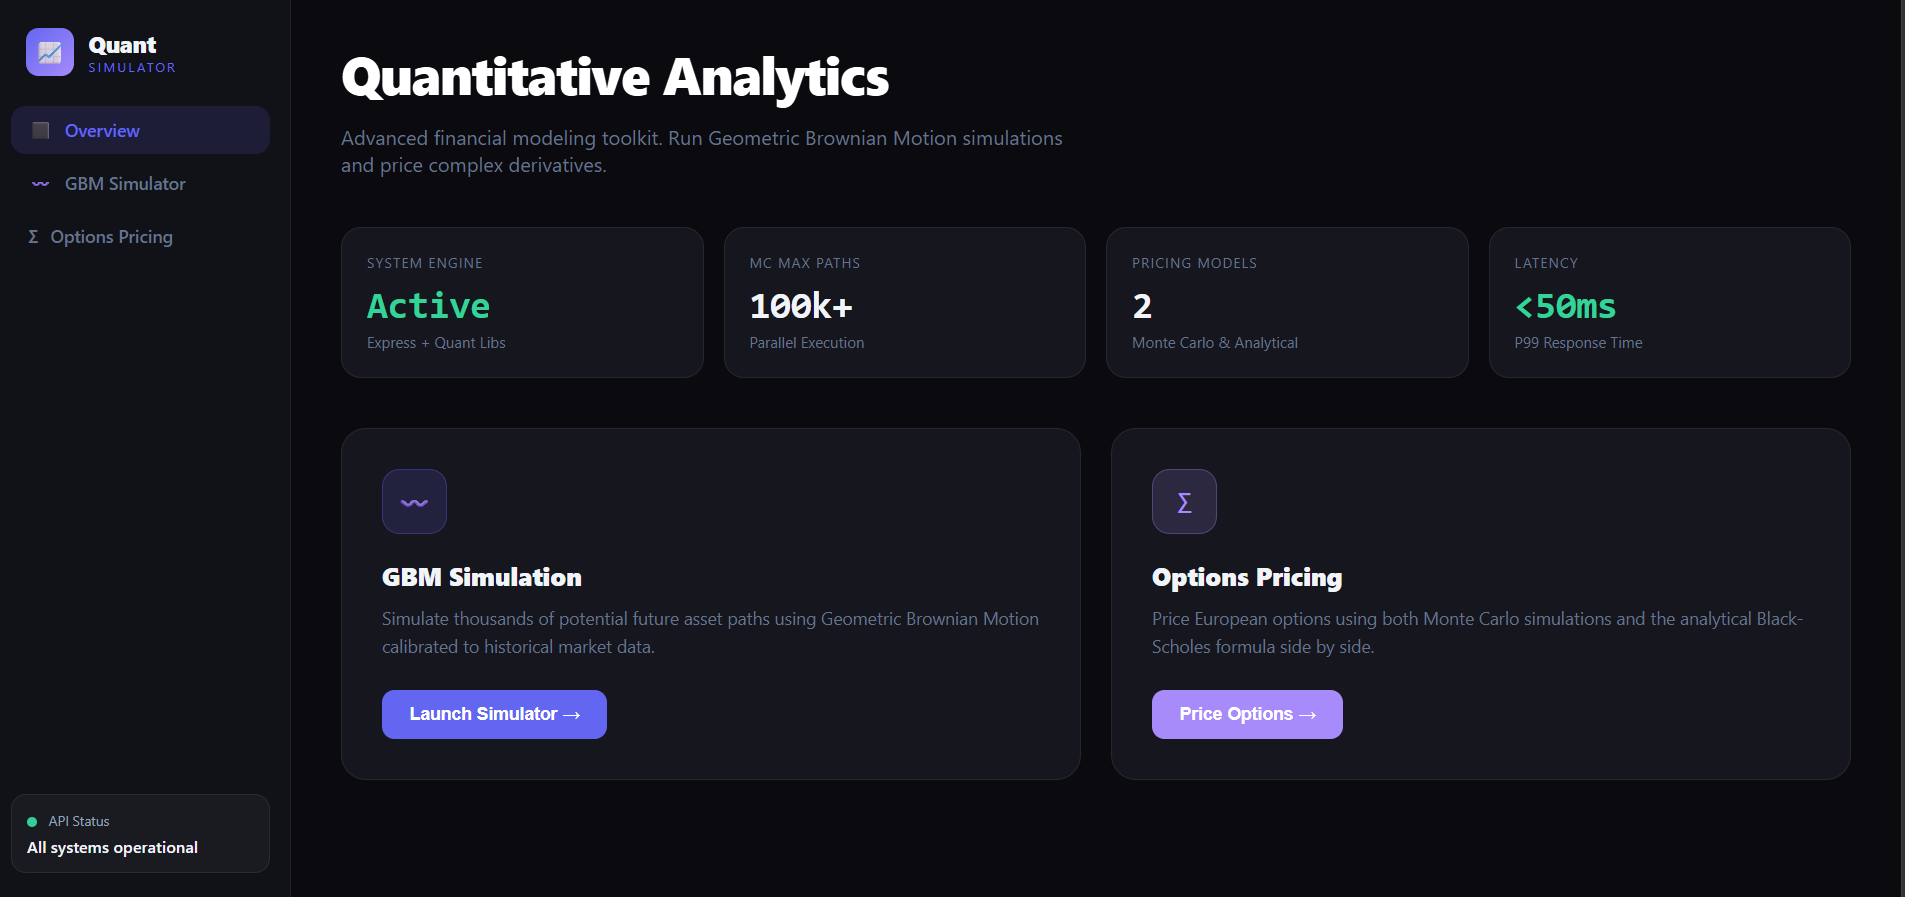
What it does
This project simulates stock price movements using Geometric Brownian Motion. It analyses volatility, expected returns, and possible future outcomes. It also prices European options using both Black-Scholes and Monte Carlo methods. Users can compare results to better understand financial models and risk.
How we built it
The backend is built with FastAPI, using NumPy and SciPy for computations and yfinance for real data. The frontend uses HTML, CSS, and JavaScript to create an interactive dashboard. Core logic includes GBM simulation, Monte Carlo methods, and Black-Scholes pricing. The system connects user inputs to real-time financial computations and displays results clearly.
Challenges we ran into
Understanding and implementing financial models like GBM and Black-Scholes correctly was complex. Handling randomness and ensuring stable simulation results required careful logic. Integrating backend computations with a smooth frontend experience was also challenging. Optimising performance for large Monte Carlo simulations was another key hurdle.
Accomplishments that we're proud of
Successfully built a full-stack quantitative finance tool from scratch. Implemented both analytical and simulation-based pricing models and compared them. Created an interactive UI that makes complex financial concepts easy to explore. Achieved accurate and consistent results across different simulation runs.
What we learned
Gained a strong understanding of stochastic processes and financial modelling. Learned how Monte Carlo simulations work in real-world applications. Improved skills in FastAPI, API integration, and frontend-backend interaction. Understood how to balance mathematical accuracy with performance and usability
What's next for QuantEdge
We plan to add data visualisations like price path graphs for better insights. We aim to include advanced metrics such as Greeks (Delta, Gamma, Vega) for deeper analysis. Integrating real-time market data and expanding to more asset classes is a key goal. We also plan to deploy the platform and improve performance for large-scale simulations.

Log in or sign up for Devpost to join the conversation.