-
-
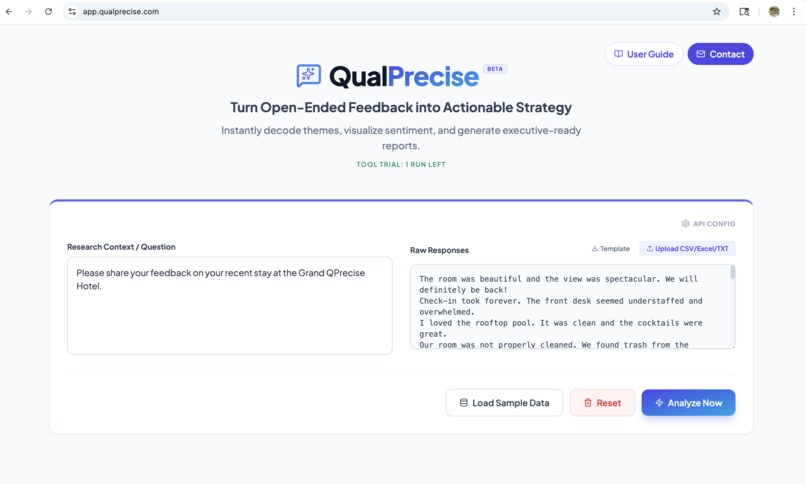
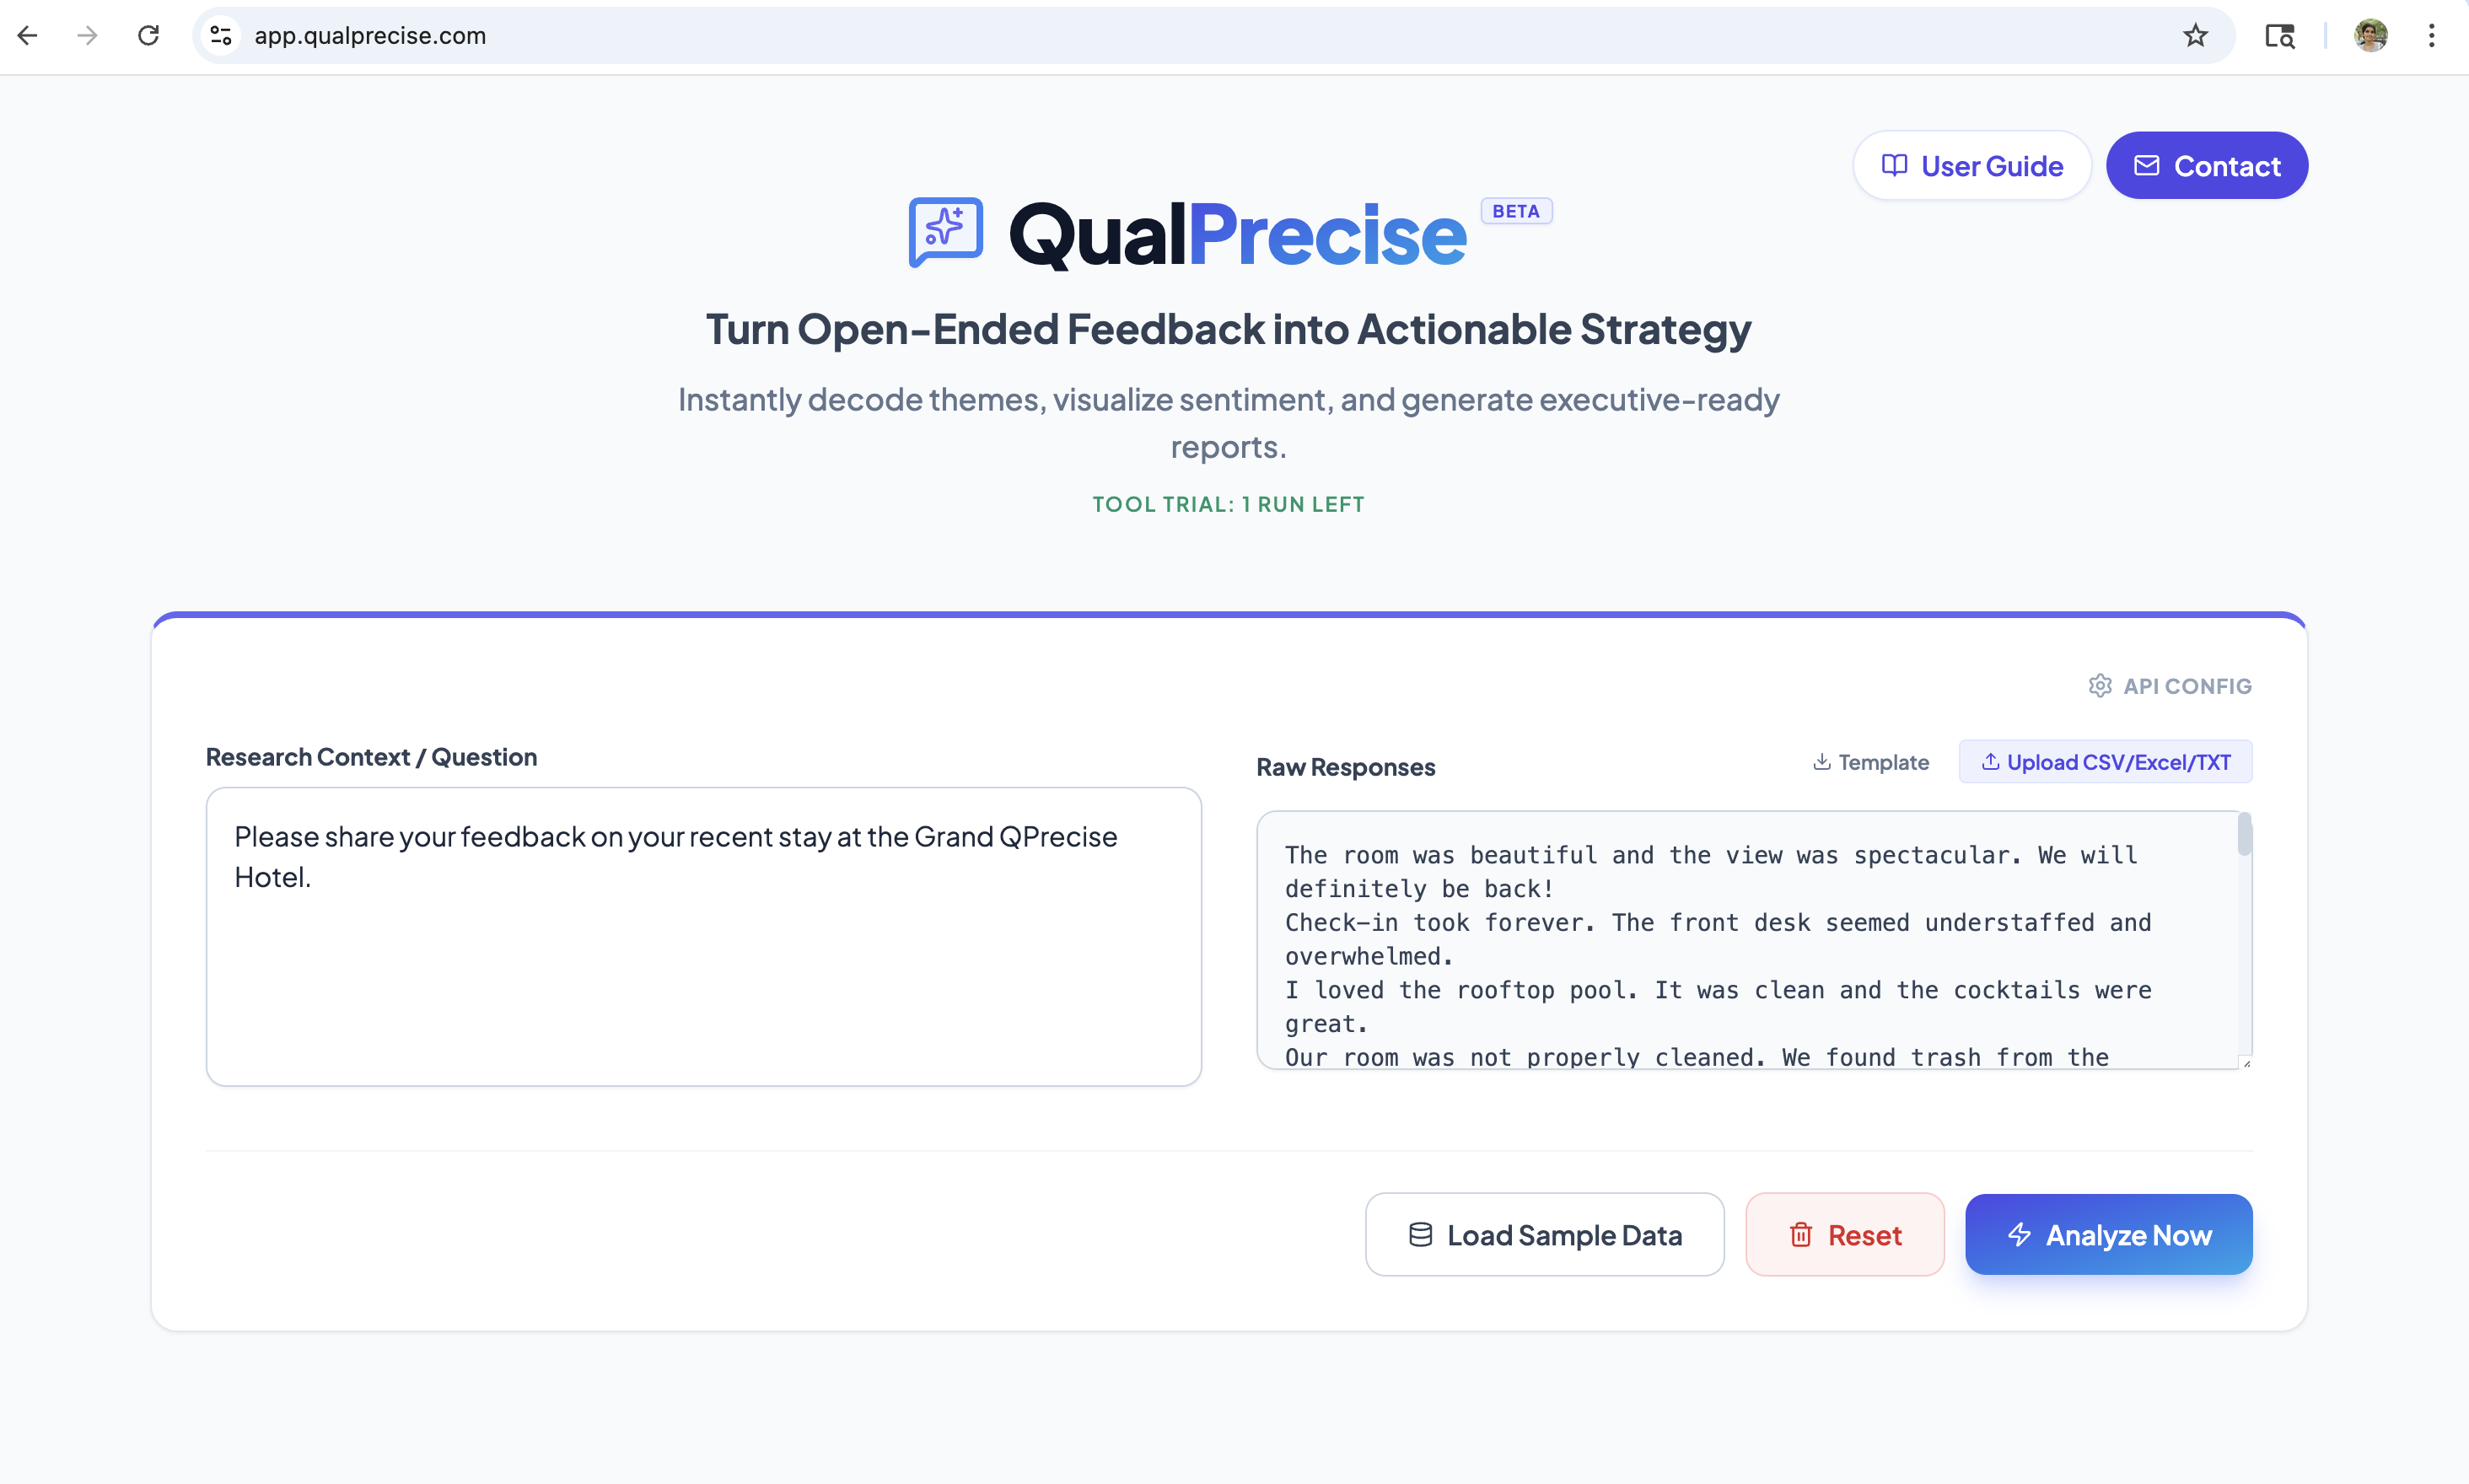
QualPrecise HomePage
-
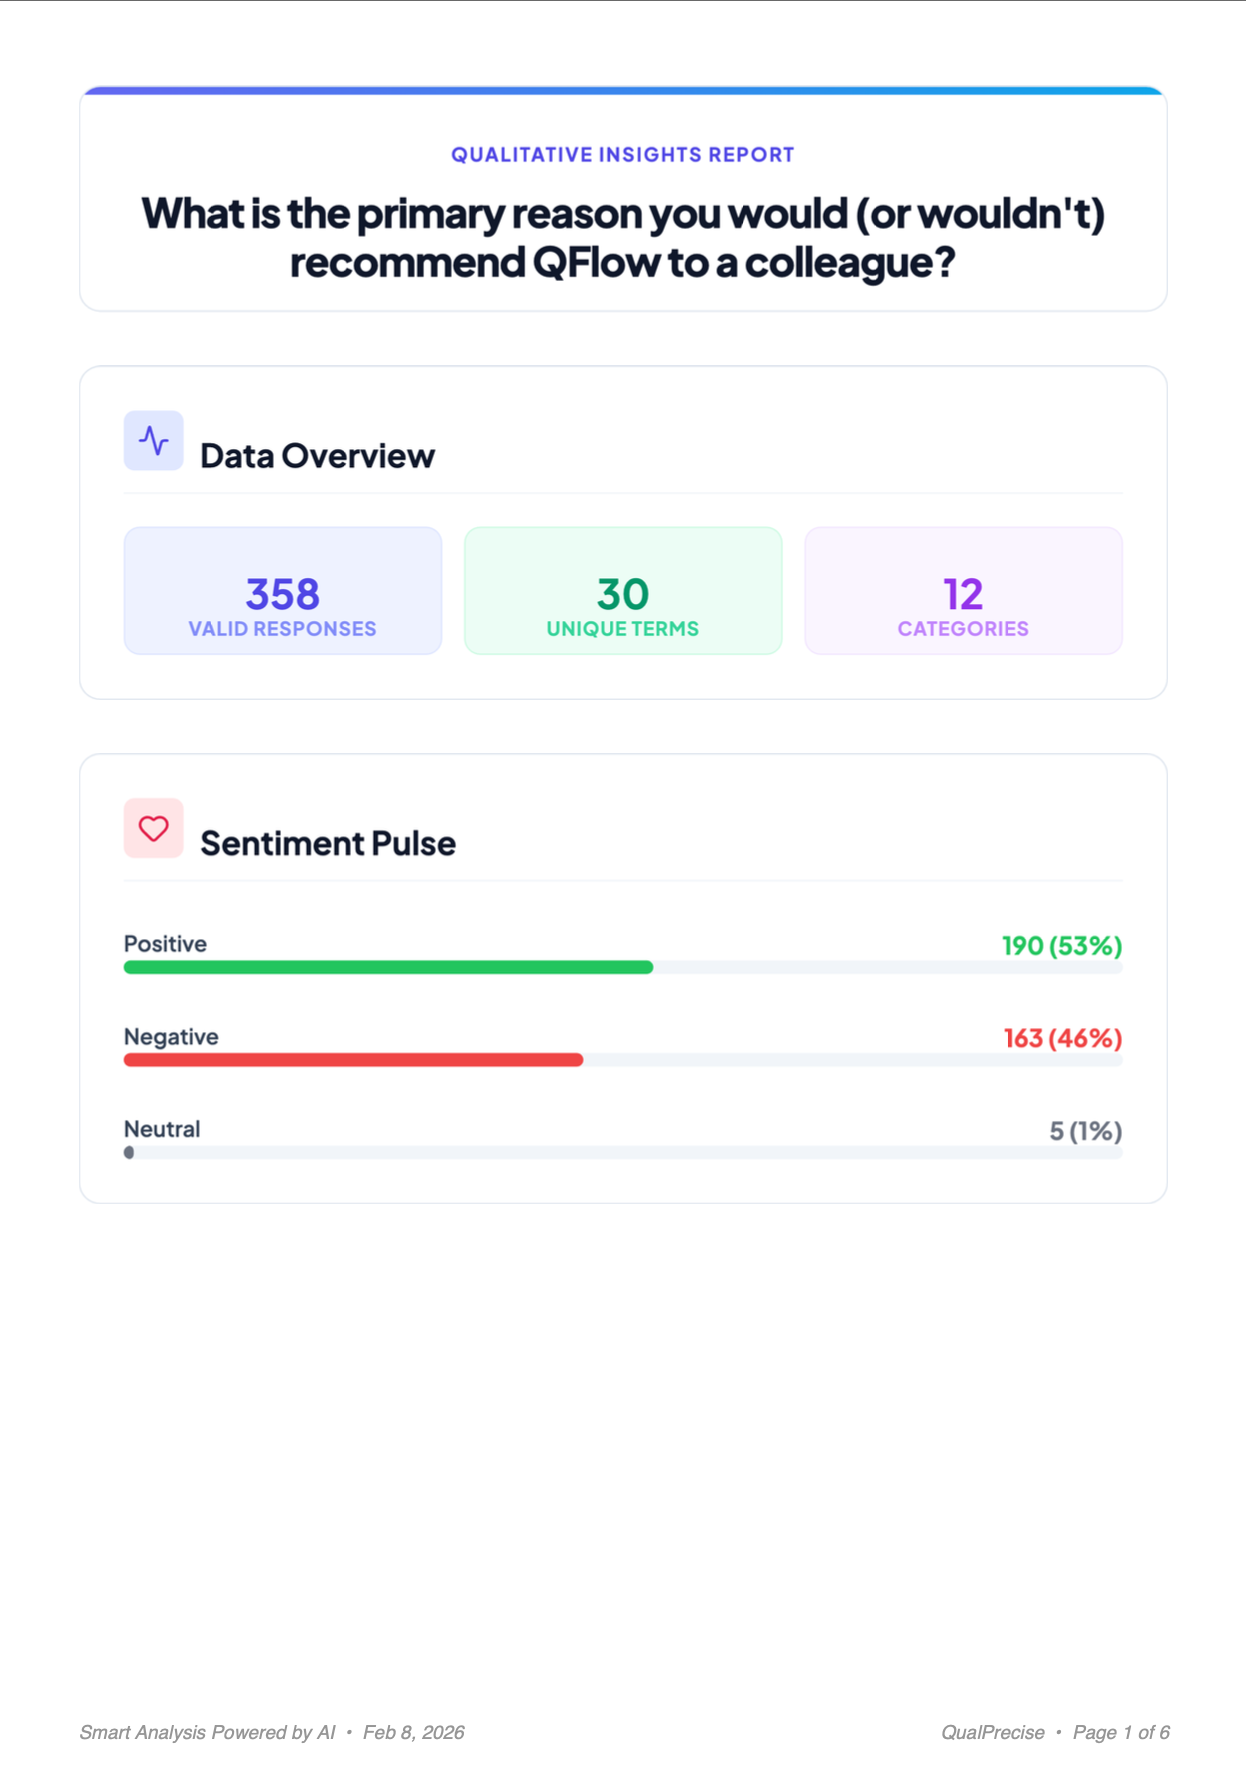
Summary PDF
-

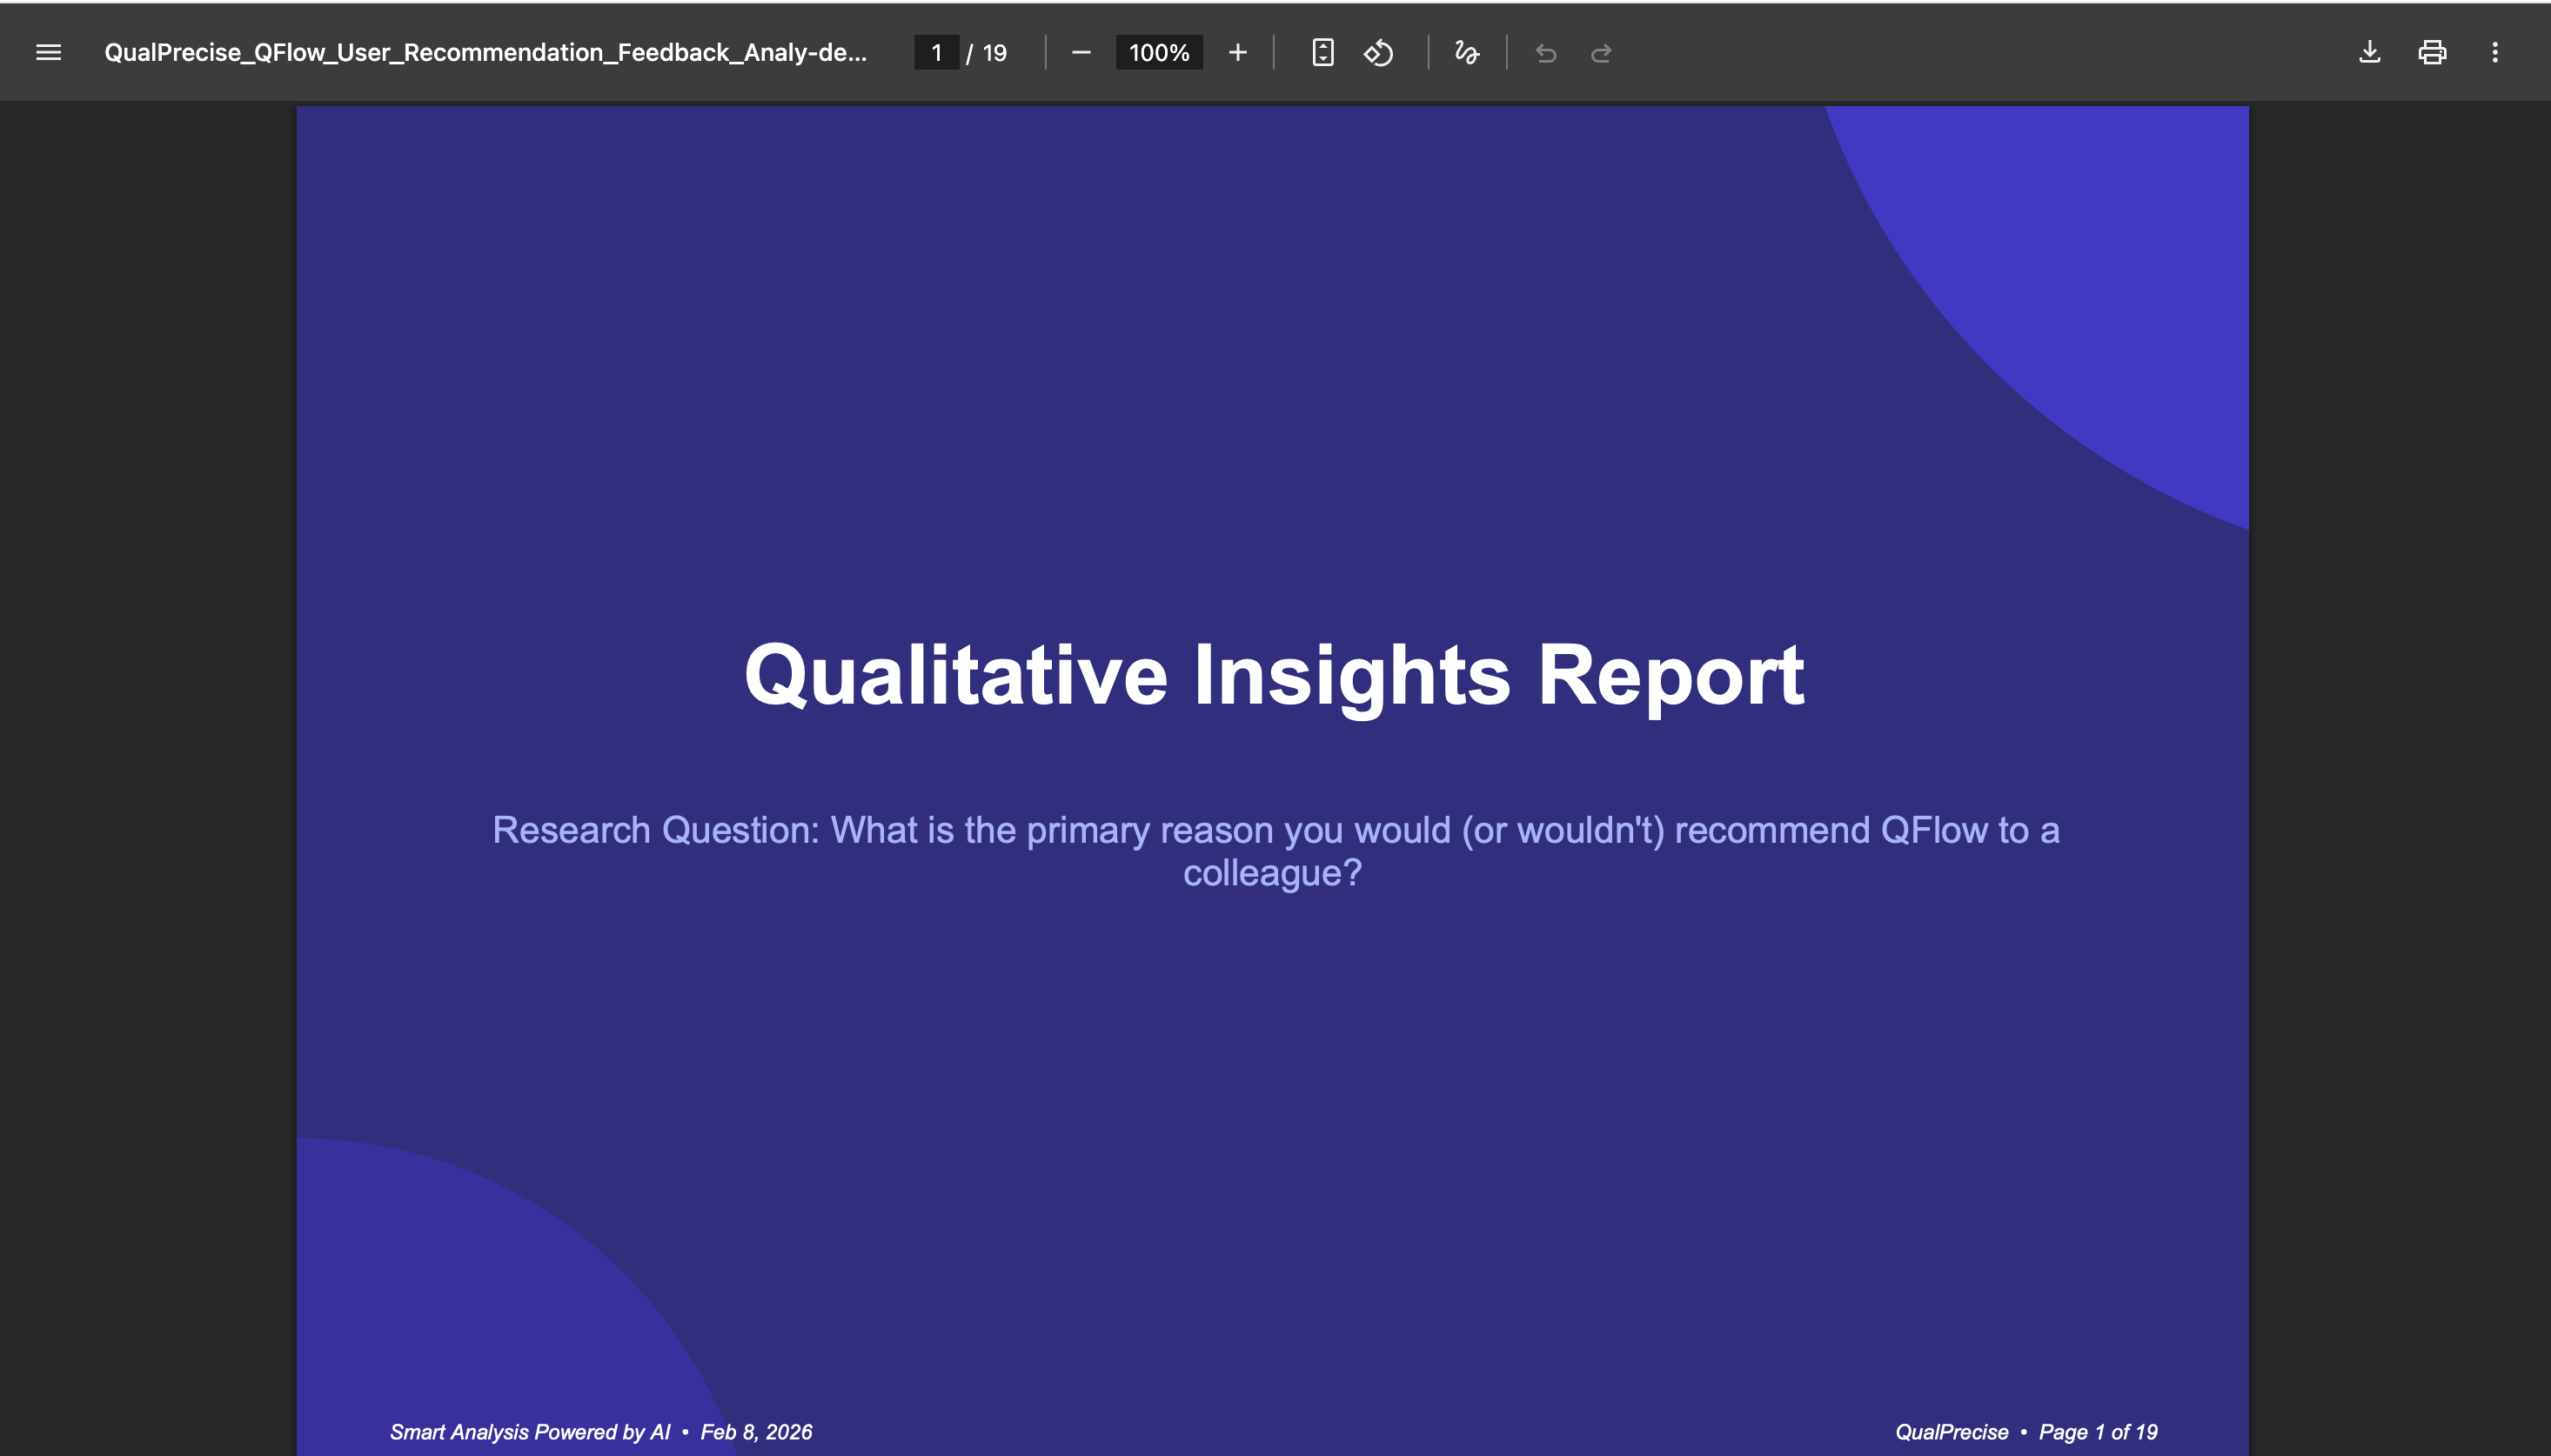
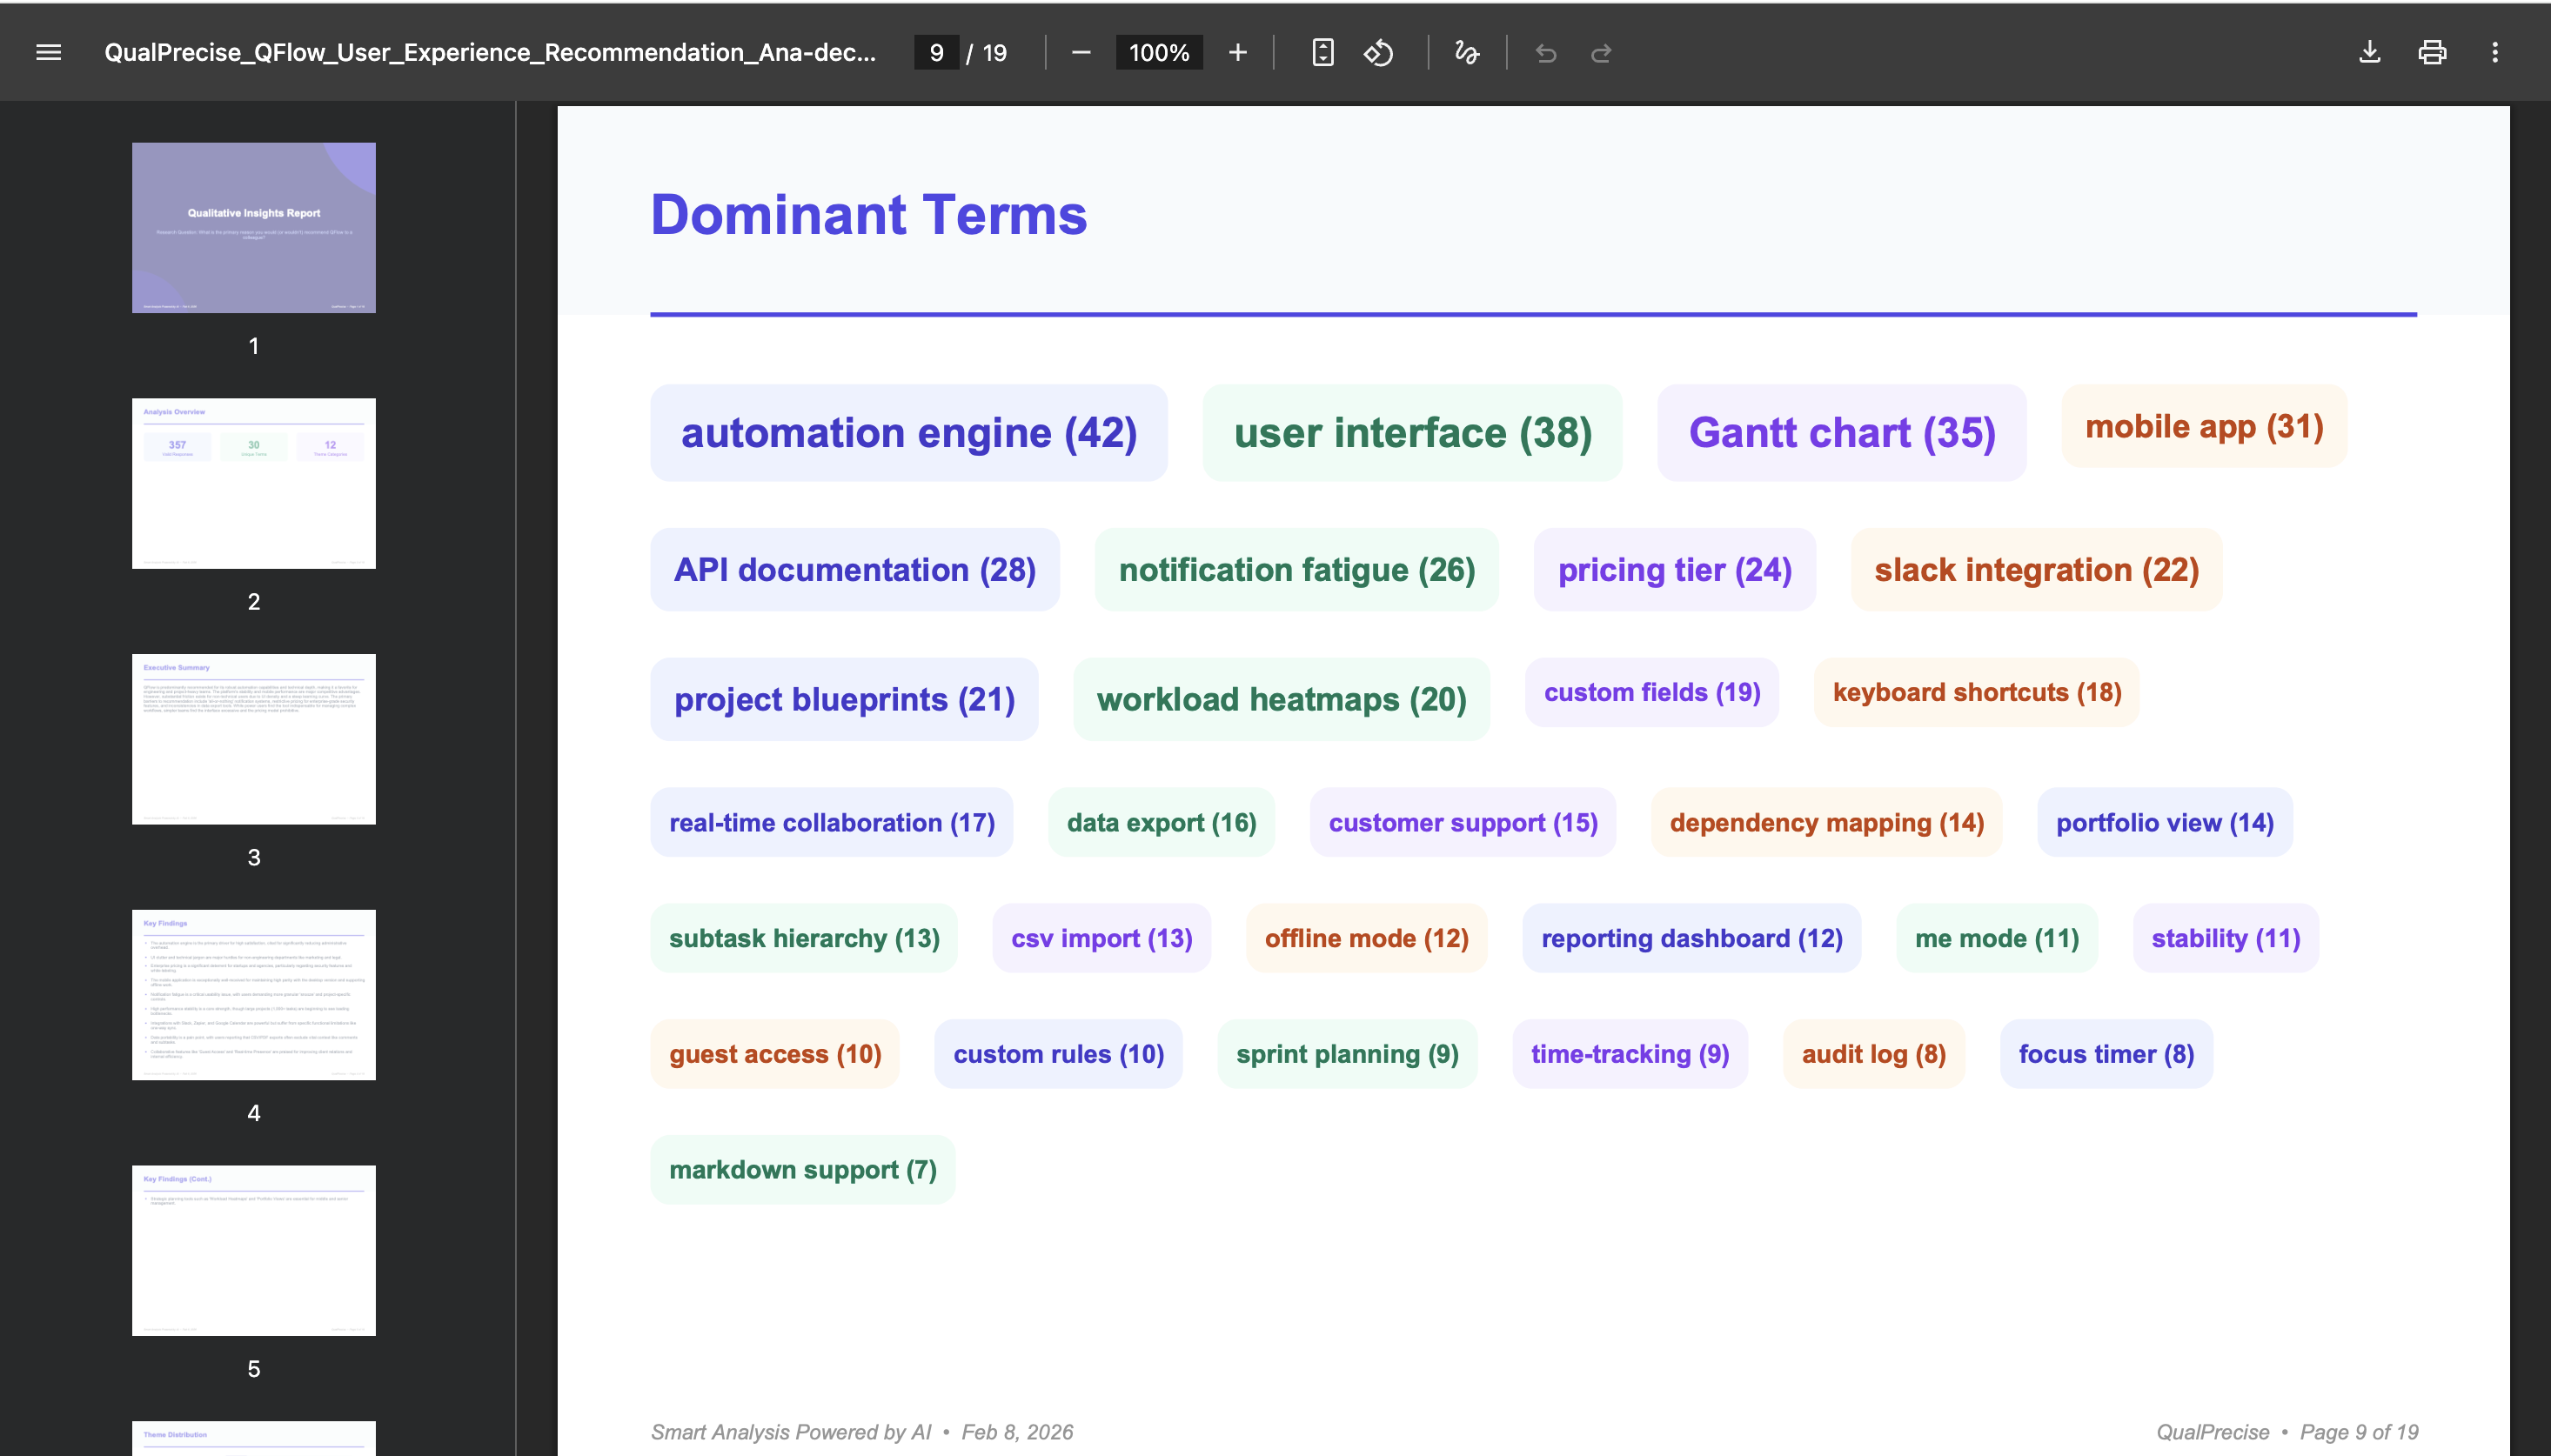
Slide Deck
-
Slide Deck
-
JPG
-
Infographic
-
Infographic Asset
-
Data Integrity Profile
-
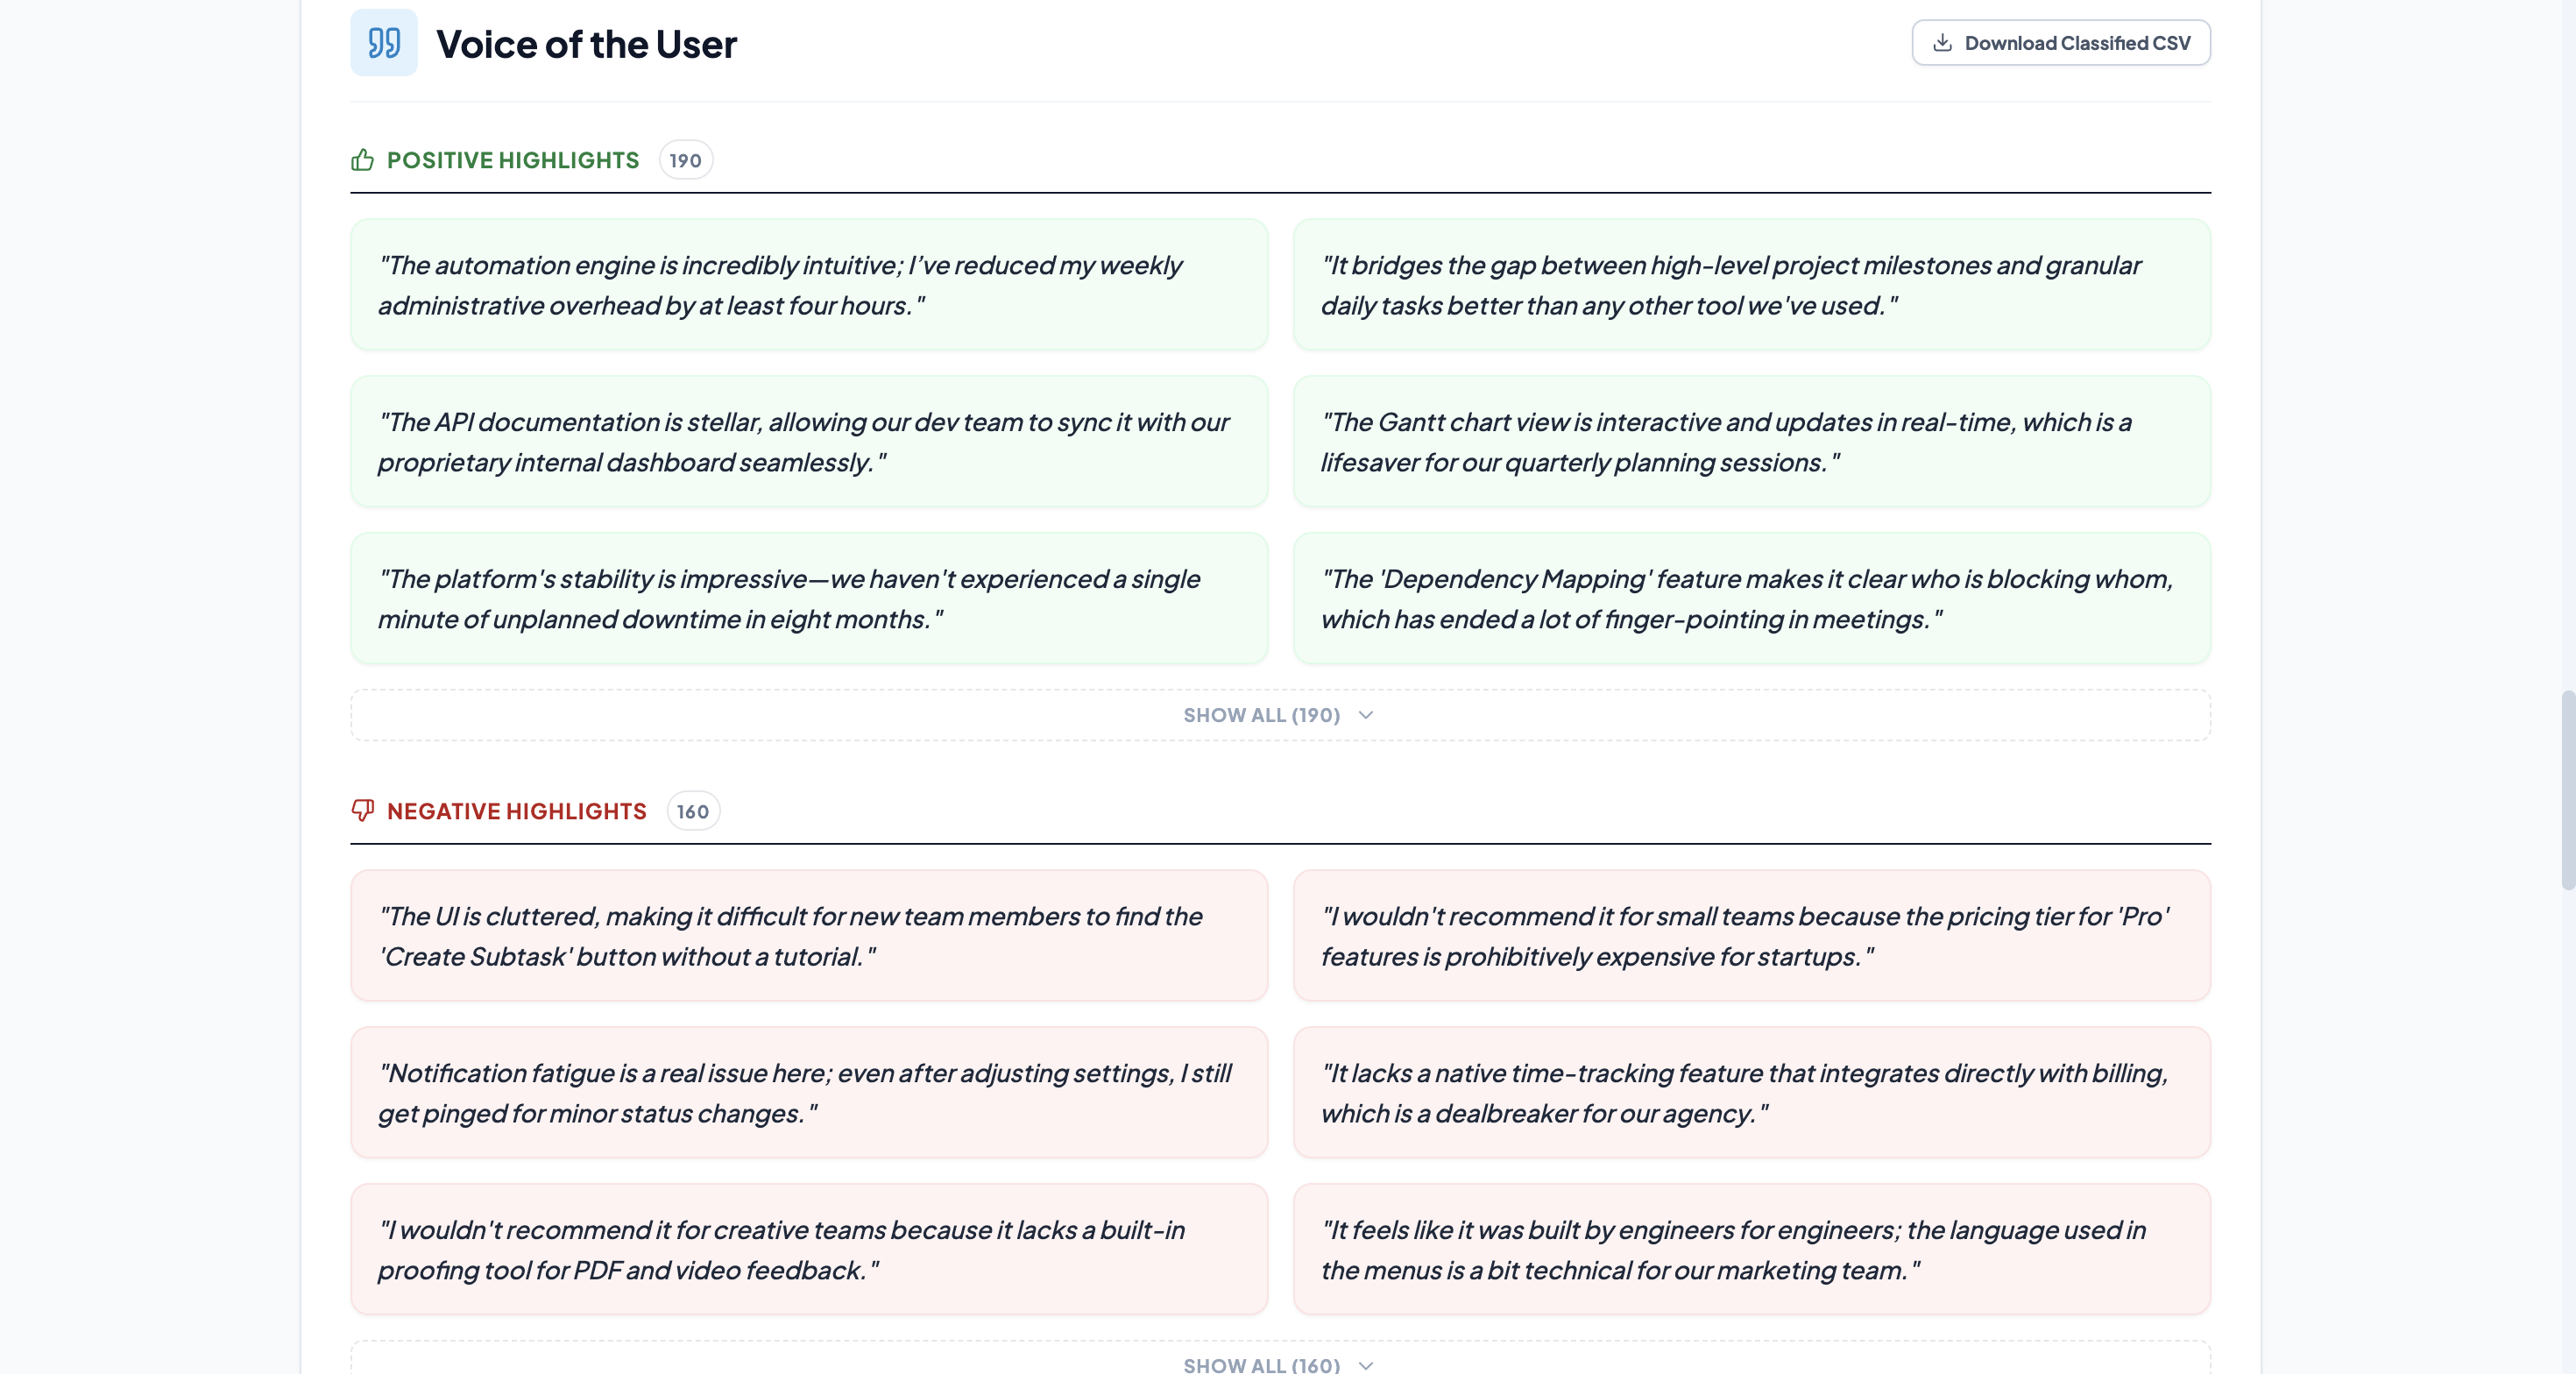
Voice of the User
Inspiration
The "Why" Behind the Numbers
We live in a data-rich world where quantitative metrics like NPS scores, CSAT ratings, and star counts are instant and abundant. Modern survey tools make it easy to visualize what is happening, but they often fail to explain why. The answers lie hidden in the "goldmine" of open-ended text responses. However, mining this gold is currently a nightmare. Researchers and analysts often stare at spreadsheets with 500+ rows of unstructured feedback, facing a painful choice:
Ignore It: Simply overlook the open-ended responses because the volume is too high, leaving the most crucial insights hidden in the noise. The Manual Grind: Spend days—or even weeks—manually coding rows in Excel or using expensive, complex software. It is a tedious cycle of reading, tagging, and iterating on themes that delays reports and burns out analysts.
The Insight Gap - The traditional "data-to-action" timeline for qualitative research is sluggish—often taking 2 to 7 days of heavy lifting to categorize sentiments and iterate on themes. By the time a report is ready, the pulse of the customer may have already shifted.
My Vision - QualPrecise was born from my deep passion for the "voice of the customer." I believe that open-ended feedback isn't just noise, it is the most valuable asset a company has.
As a researcher who deeply values the power of insights, I wanted to address these challenges head-on. My vision was to create a simple yet sophisticated tool that handles the heavy lifting, not just cleaning data or assigning static tags, but building an engine that:
Understands Nuance: Goes beyond keywords to grasp the intent and emotion behind the text. Accelerates Insight: Shrinks the timeline from days to minutes. Delivers Strategy: Bypasses the spreadsheet entirely to generate board-ready reports immediately.
QualPrecise transforms the chaotic noise of thousands of voices into a clear, actionable strategy, empowering teams to understand the why as instantly and as precisely as they understand the what.
What it does
QualPrecise: Where Qualitative Depth Meets Precision
As the name suggests, our mission is simple: to bring scientific precision to the art of Qualitative analysis.
QualPrecise is an AI-driven, powerful tool for qualitative data analysis. Built using React, TypeScript, and Google's Gemini API, it significantly reduces the time spent on coding open-ended data. This innovative solution automatically converts raw text from sources like open-ended survey responses, reviews, and customer feedback into executive-level insights, visual themes, and sentiment analysis almost instantly.
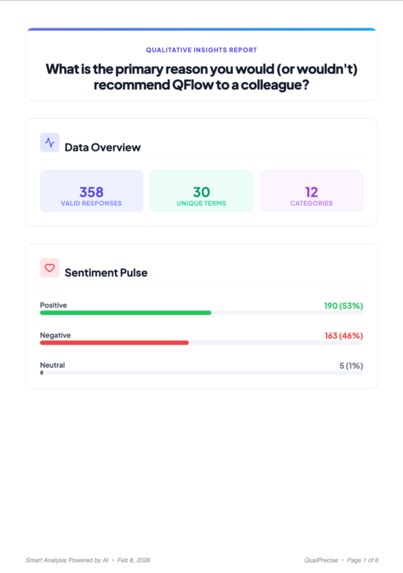
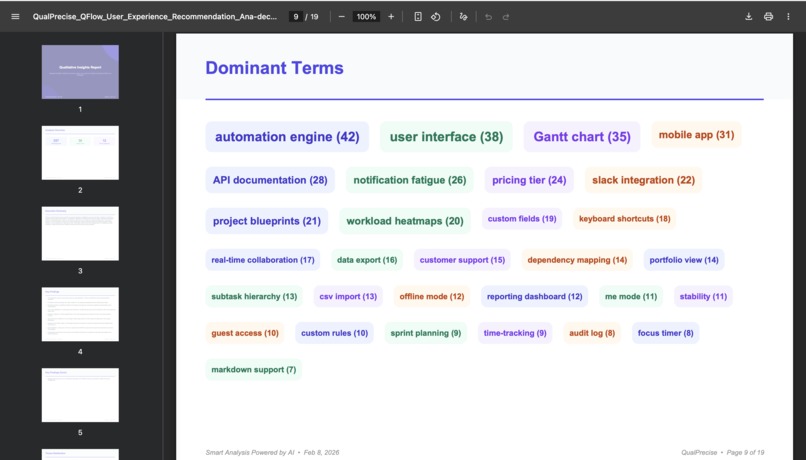
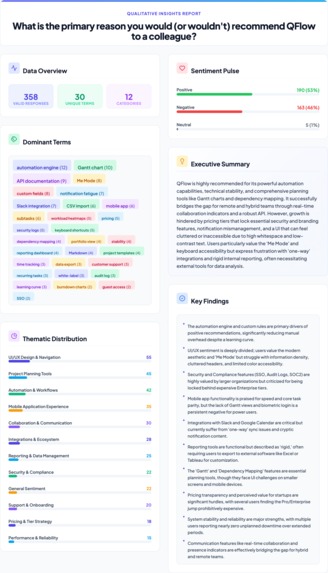
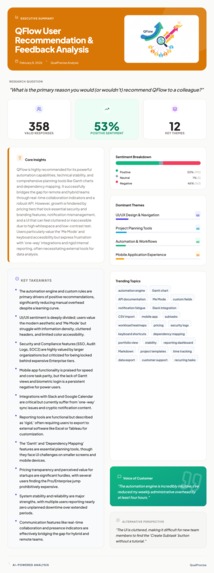
Data Ingestion: Users can import text, CSV, or Excel files or paste responses directly. Smart Sanitation: QualPrecise AI automatically detects and segregates "Noise" (useless answers like "n/a", "idk" or “gibberish") from "Valid Insights," ensuring your analytics aren't skewed by low-quality data. Deep Analysis: It identifies dominant themes, calculates sentiment distribution, and extracts the key actionable findings. Instant Assets: Instead of just showing text on a screen, QualPrecise generates downloadable assets: PDF Slide Deck: A complete, formatted presentation ready for stakeholders. Executive Summary PDF: A high-level summary report. PNG: Sharable PNG image Copy Text option for emails & excerpts AI-Powered Infographic: A visual poster that uses Google Image Generation models to generate a unique, context-aware illustration representing the specific dataset, combined with high-fidelity charts.
Currently, we support, Bring Your Own Key model, where users could enter their free API key from Google AI Studio. Also, we have Demo Mode which Includes pre-loaded datasets (WFH Policy, Hotel Feedback, etc.) to explore features without an API key.
How we built it
QualPrecise is a React application built entirely on the Google GenAI SDK. The Core Engine: We utilize gemini-3-flash-preview for its superior reasoning speed and context window. Structured Data Pipeline: We bypass traditional text parsing by utilizing Gemini’s responseSchema. The app sends raw text and demands a strict, nested JSON return containing valid analysis, filtered noise IDs, and sentiment counts. This allows the frontend to render interactive charts directly from the LLM output without a backend database. We also support gemini-2.5-flash model. Visual Metaphor: We integrated the Gemini 3 Pro/ Imagen 4/ Gemini Flash Image models to generate dynamic infographic headers. The app programmatically constructs a visual prompt based on the analysis summary to give reports a professional polish. Deduplication Layer: To maximize token efficiency, we built a pre-processing layer in TypeScript that maps identical responses to IDs, sending unique entries to Gemini and reconstructing the weights client-side.
Challenges we ran into
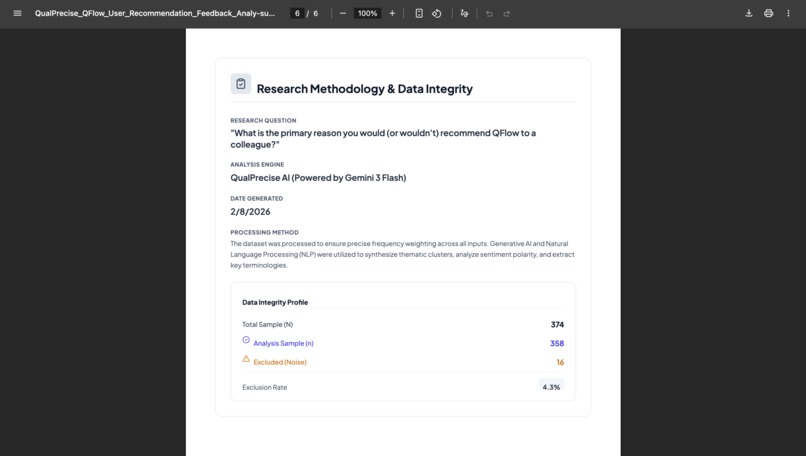
The "Hallucination" of Structure: Early on, getting models to strictly adhere to complex JSON schemas (like nested arrays for themes) was difficult. Gemini 3’s native structured output capabilities solved this, drastically reducing parsing errors compared to older models. Getting an LLM to output mathematically consistent data (where sentiment percentages add up to 100%) was tricky. We had to iterate heavily on the system instructions to enforce logic checks within the generation and brought in Data Integrity profile as well part of the tool to be totally transparent about our methodology and the percentages.
Defining "Noise": Teaching the AI to distinguish between short valid sentiment (e.g., "Good") and invalid noise (e.g., "n/a") was tricky. We overcame this via "System Instruction" engineering, explicitly teaching the model that brevity does not equal low quality, but lack of semantic meaning does.
Token Economics: Analyzing 1000+ rows hits context limits fast. We have implemented a client-side frequency map that consolidates duplicates before they reach the API, reducing token usage by up to 40% on highly repetitive datasets (like NPS comments).
Executive Ready Reports - Making the downloadable reports and getting it to professional formatting was challenging, but with multiple iterations, we could able to address it.
Accomplishments that we're proud of
Built the First "Response-to-Report" Tool: I am incredibly proud to have successfully built QualPrecise as a "Raw-Data-to-Presentation" engine. It bridges the gap between raw text and executive strategy, transforming days of manual labor into seconds of automated insight.
The "Zero-to-Deck" Workflow: We are proud that a user can upload a messy text file and download a polished PDF Slide Deck in minutes. It feels like magic.
Noise Filtering: Most summarizers fail because they include garbage data. Our "Poor Quality" filter effectively cleans the dataset before analysis, significantly increasing the accuracy of the insights.
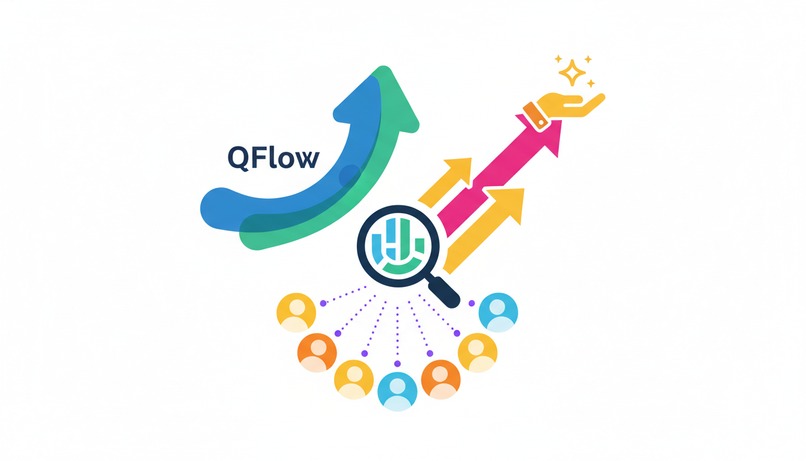
The AI Visuals: Successfully integrating Imagen to create relevant art for the infographic. It doesn't just pick a stock photo; it generates new art based on what the users actually said.
What we learned
Model efficiency - We learned that Gemini 3 is not just a text generator, it is a logic processor. It captures the nuances and excels at detecting noise, understanding context, and providing deep reasoning, which made this tool powerful. This project proved that sophisticated research tools don't need clunky legacy codebases - they just need better models.
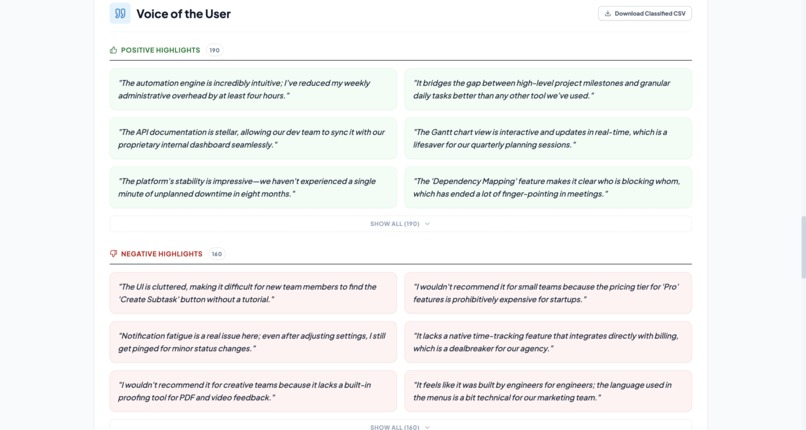
User Trust: Users trust AI analysis more when they can see the "receipts." Adding the "Data Integrity", "Filtered Noise" section and the "Key Quotes" section helped bridge the gap between AI magic and verifiable data. This made the tool totally transparent and users can trust and validate by seeing it straight forward.
What's next for QualPrecise
Enterprise level features, account creation and users could save projects as dashboard and share the dashboard view as well. More filtering capabilities to give users the ability to dive deep on their themes of interest. Multiple datasets and comparative Analysis support, allowing users to upload two or more datasets (e.g., "Q1 vs Q2") and having QualPrecise to analyze the change in sentiment over time.

Log in or sign up for Devpost to join the conversation.