-
-
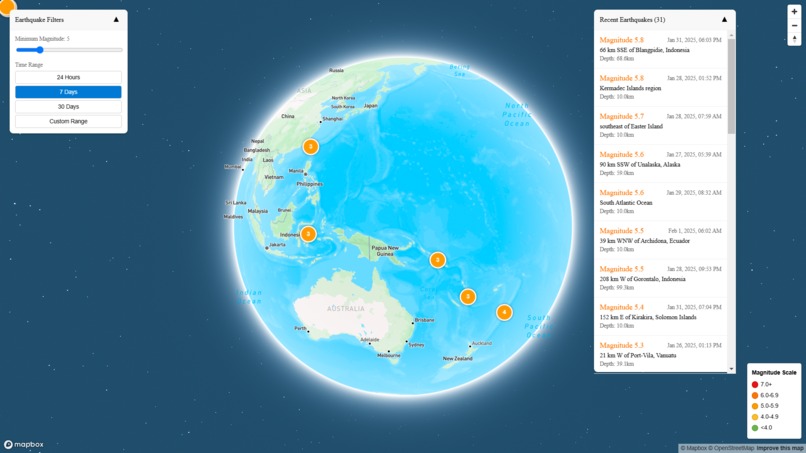
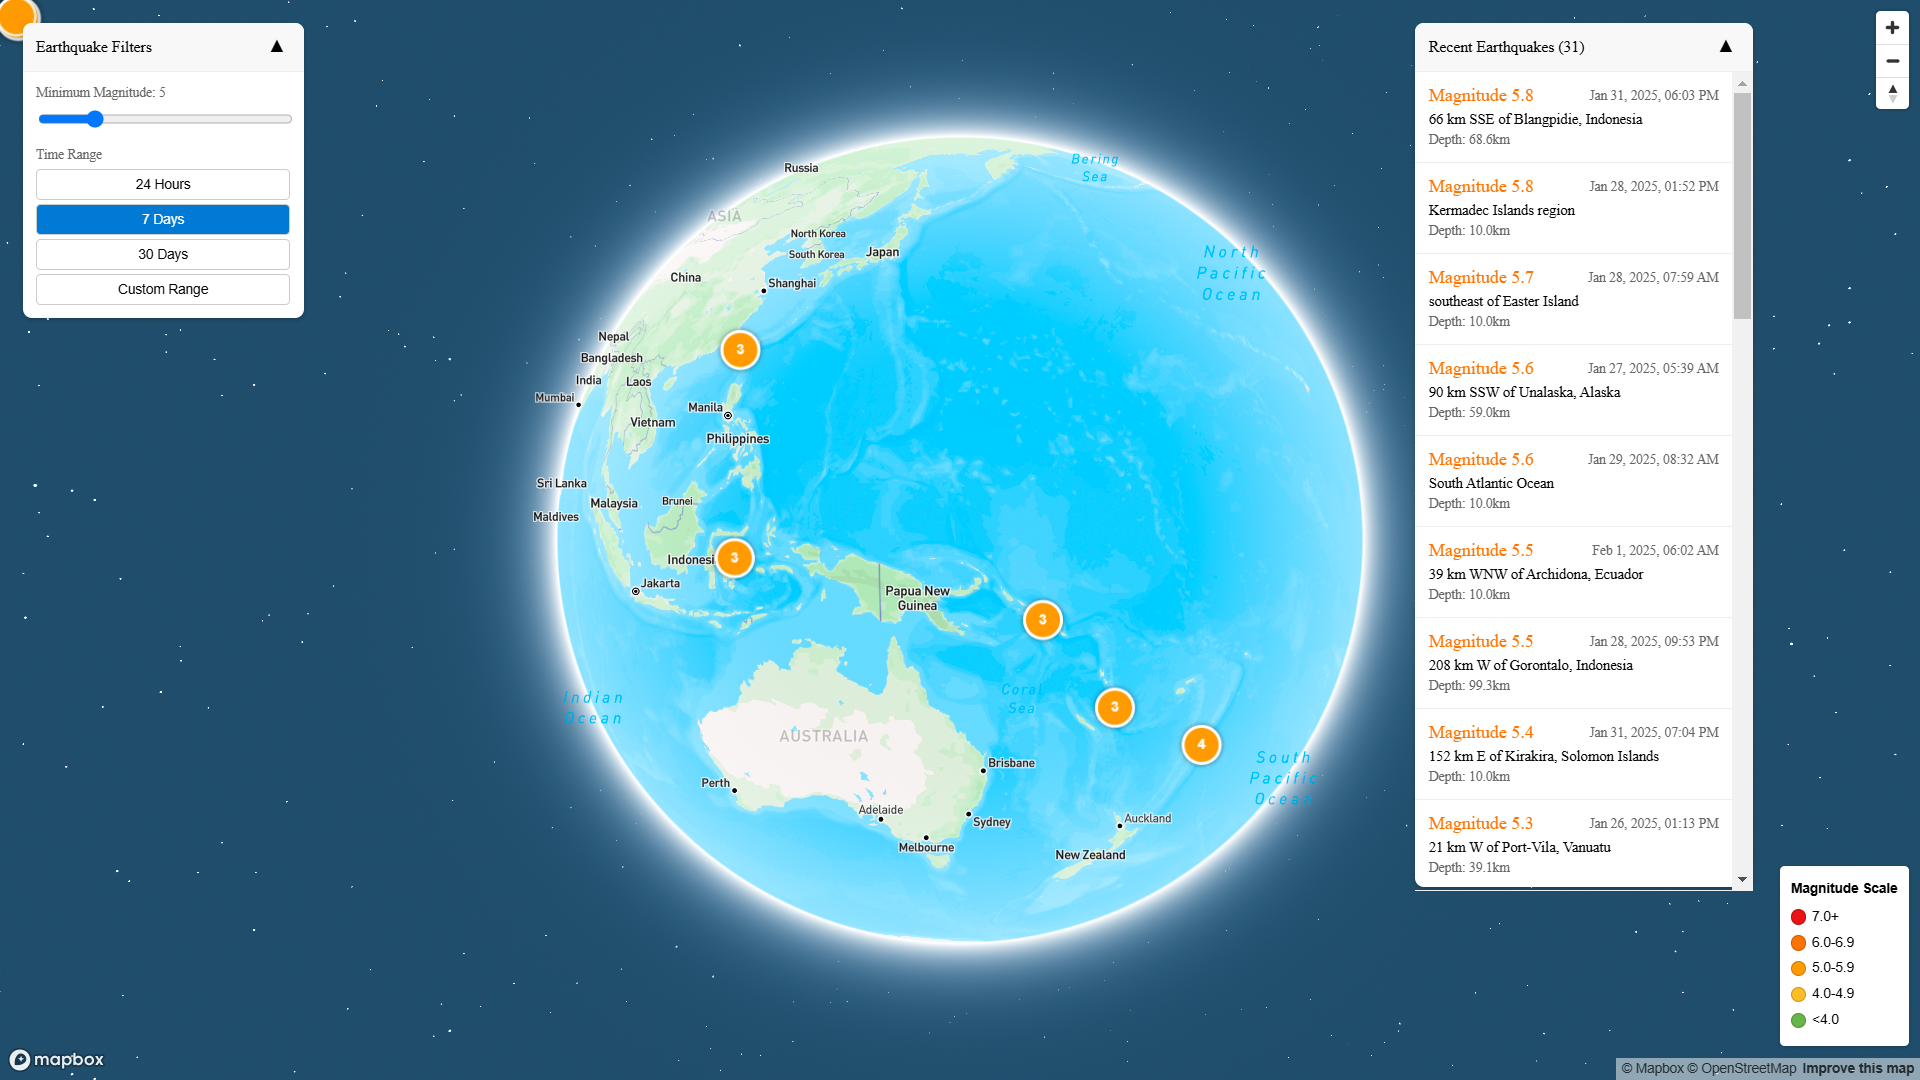
main app with filtering, list of earthquakes, clustering, and magnitude scale legends
Inspiration
Living in Indonesia, one of the most seismically active regions in the world's "Ring of Fire", I've experienced firsthand the impact of earthquakes on communities. With Indonesia experiencing thousands of earthquakes annually, there's a critical need for accessible, real-time earthquake monitoring tools.
What it does
QuakeWatch transforms complex seismic data into an intuitive, interactive map visualization. Users can track earthquake patterns, filter by magnitude, and see clustering patterns to understand seismic activity in their region.
How we built it
I developed QuakeWatch using React and Vite for fast performance, integrated with Mapbox for visualization, and connected to USGS API for real-time data. The interface is styled with TailwindCSS for a clean, responsive design.
Challenges we ran into
The biggest hurdle was optimizing map performance with large datasets, especially crucial for Indonesia's frequent seismic events. Implementing efficient clustering algorithms while maintaining real-time updates required careful balance.
Accomplishments that we're proud of
Successfully created a tool that makes complex seismic data accessible to everyone, particularly valuable for regions like Indonesia where earthquake awareness is crucial for public safety.
What we learned
Gained deep insights into handling real-time data streams and creating user-friendly visualizations. The project improved my understanding of geospatial data presentation and performance optimization.
What's next for QuakeWatch
Planning to add local language support, starting with Bahasa Indonesia, and integrate historical seismic data analysis to help identify patterns in earthquake-prone regions. Future updates will include early warning features and community reporting.
Built With
- mapbox
- mapbox-gl-js
- react-+-vite
- react-query
- tailwindcss
- usgs-earthquake-catalog-api


Log in or sign up for Devpost to join the conversation.