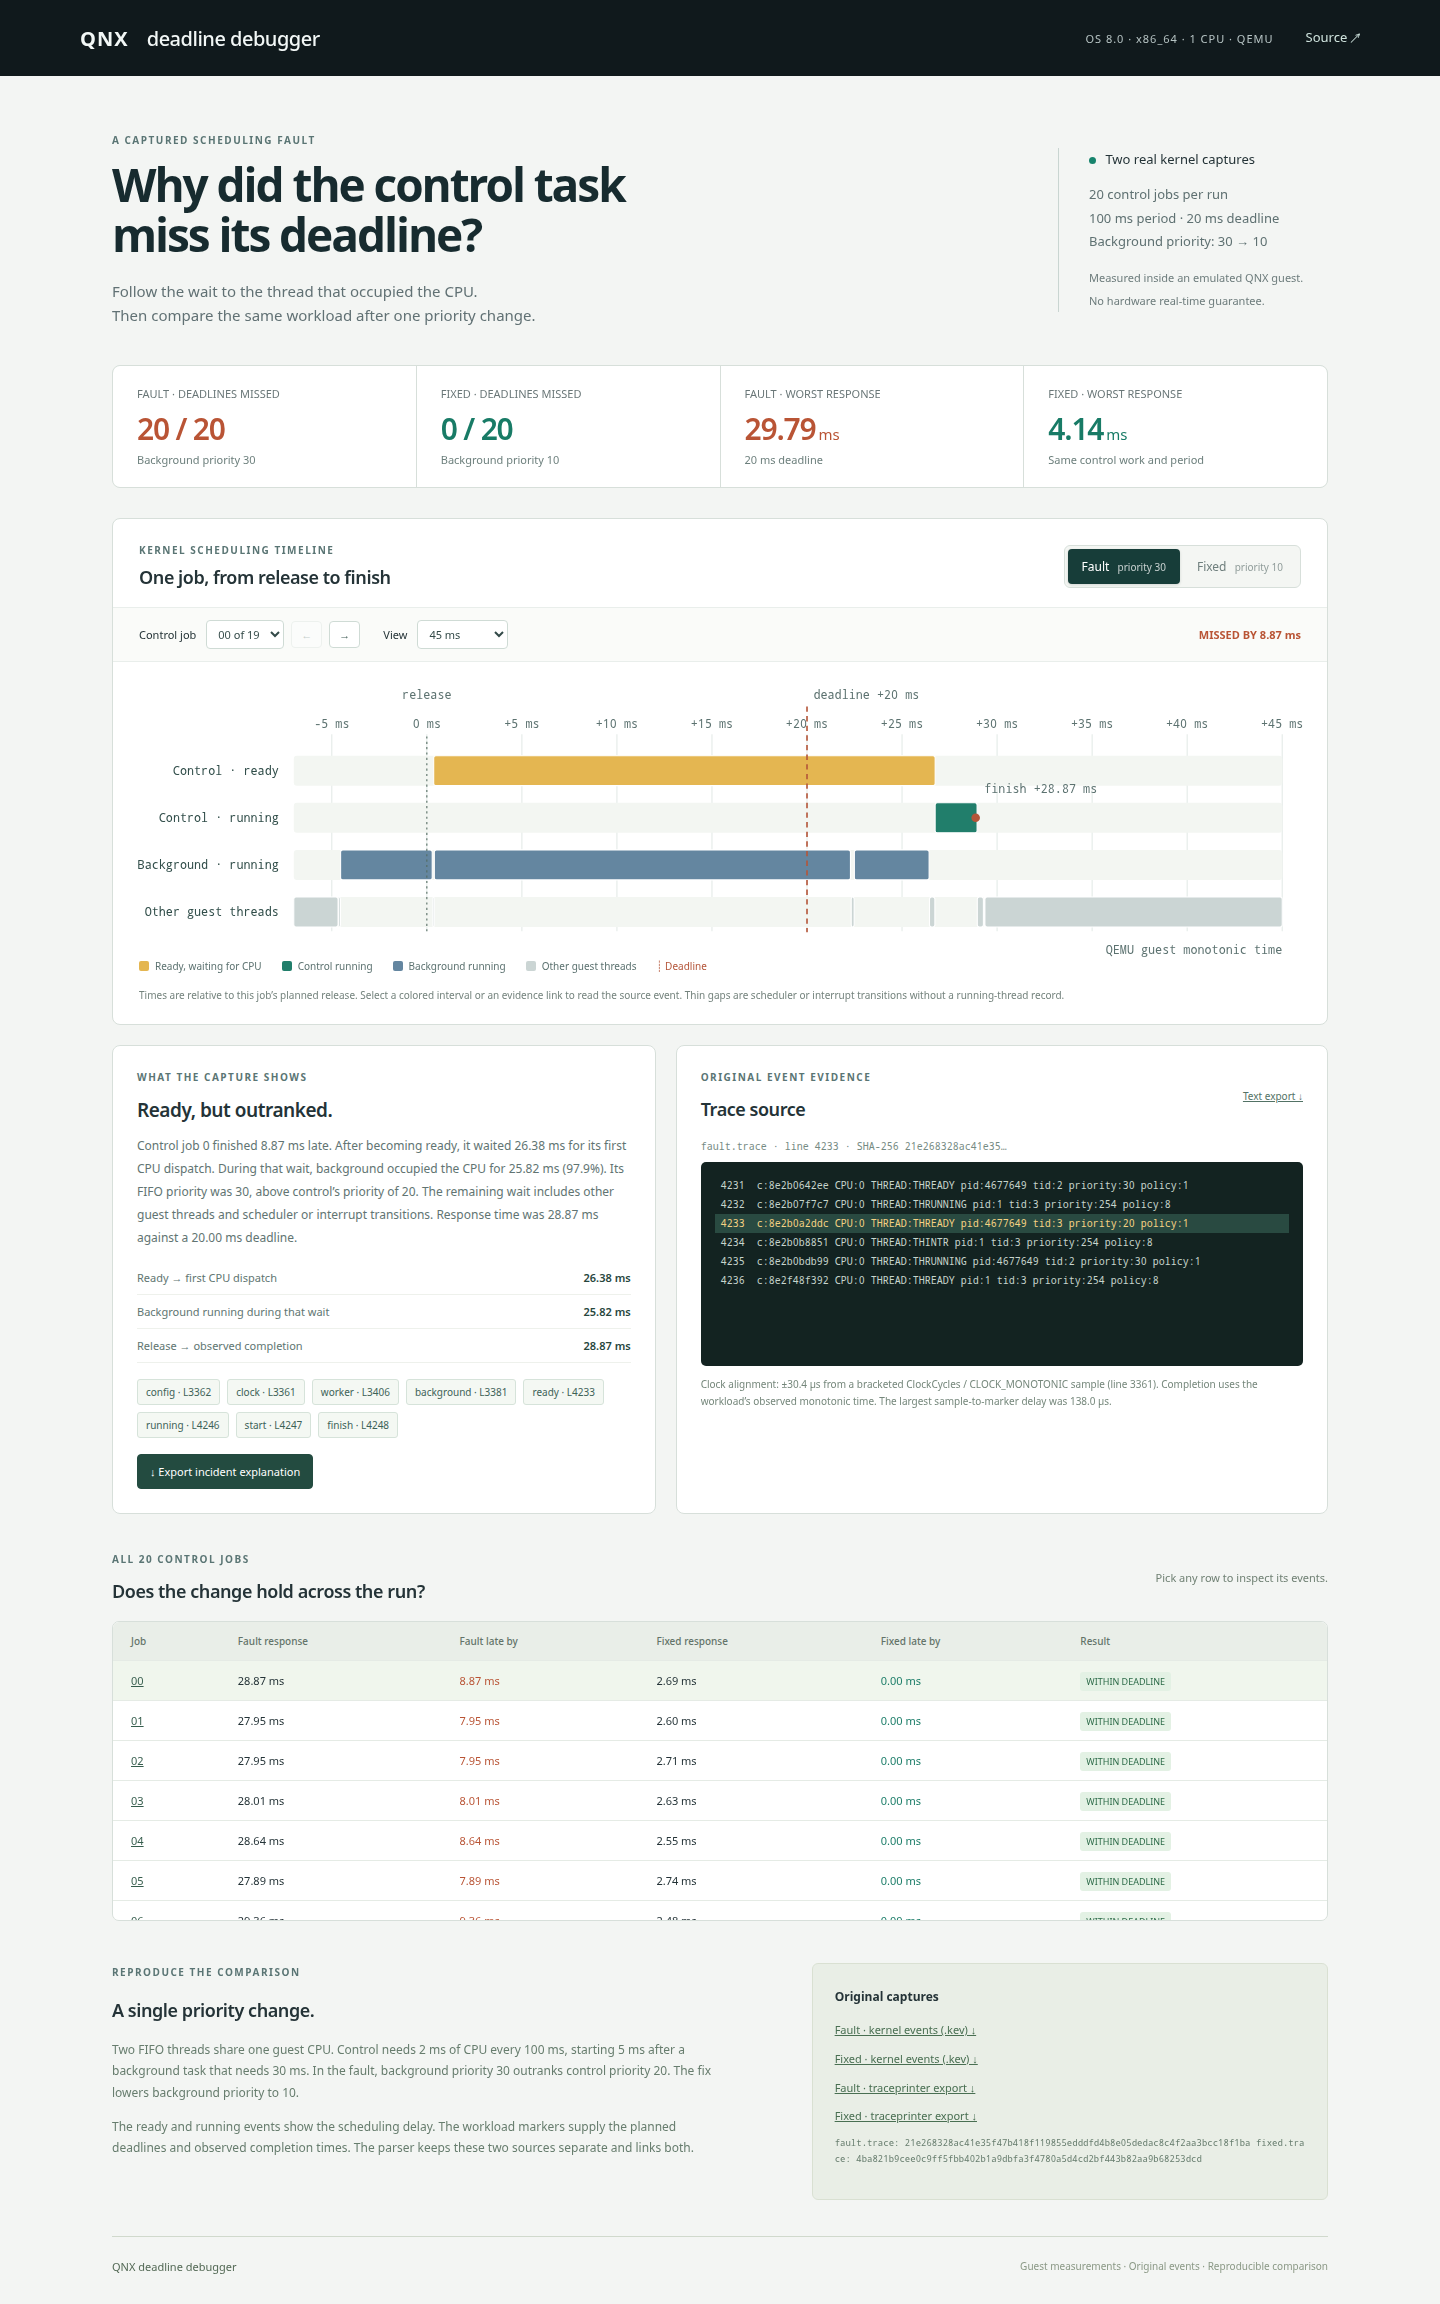
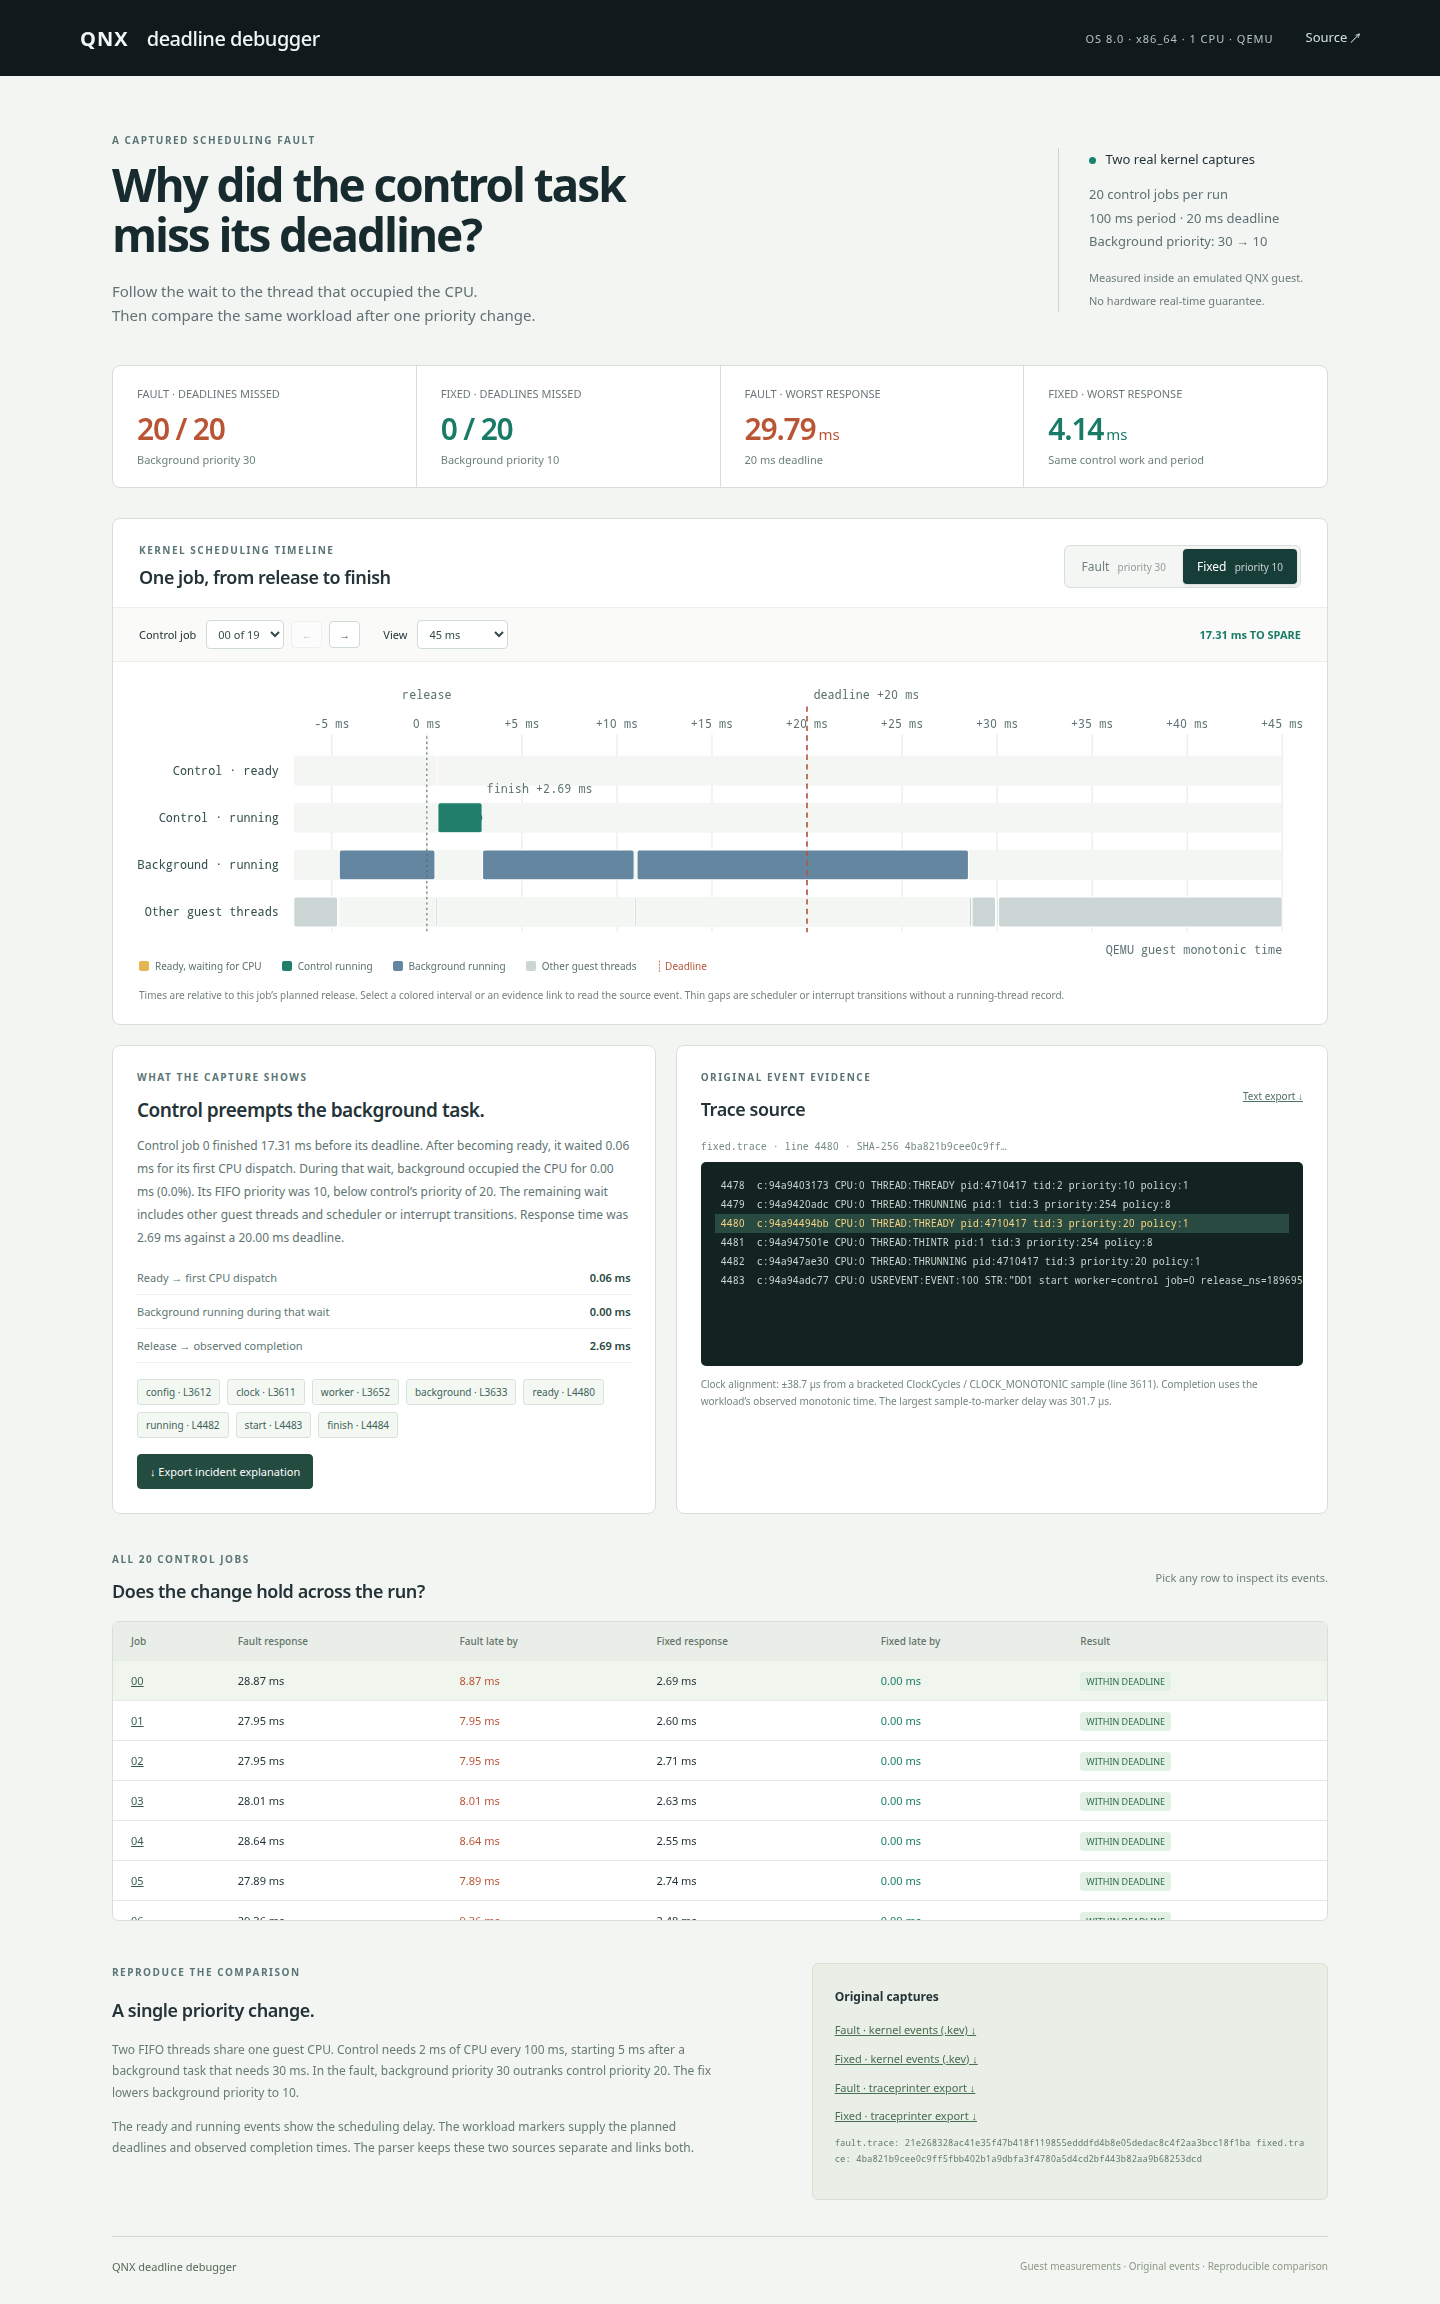
I built a host-side debugger for a missed deadline in a QNX 8.0 workload. It follows a control job from its planned release to its completion, shows when it became ready and ran, and links the explanation to the original kernel events.
The workload has two FIFO threads on one QNX guest CPU. Control needs 2 ms of CPU every 100 ms and has a 20 ms deadline. Background needs 30 ms and starts 5 ms earlier. When background has priority 30, it outranks control at priority 20. Lowering background to priority 10 is the only workload change.
In the first capture, all 20 control jobs missed their deadline. In the second, none did. The worst control response fell from 29.795 ms to 4.145 ms. A repeat recording also had 20 misses before and zero after the change. These are QEMU guest measurements, with no hardware real-time guarantee.
The browser lets you inspect every job, switch between captures and export an incident explanation. Each export includes the source hash, the control task’s ready and running events, its deadline and finish markers, and the background running intervals used in the explanation.
A QNX team investigating a periodic sensor-processing task in an automotive or industrial prototype needs to tell a late release from a task that was ready but could not get CPU time. Kernel thread-state events and FIFO priorities make that distinction visible. This experiment gives the team a small case they can reproduce before using the same approach on their own captures.
QNX already provides System Profiler for exploring traces. I kept this tool focused on one useful question: which thread occupied the CPU while the delayed task was ready, and what changed in a controlled second run? That makes a scheduling incident easier to hand to another engineer with the evidence attached.
The workload builds with QNX SDP 8.0 for x86_64 and records real events through tracelogger. The host parser reads traceprinter output. It uses a bracketed clock reference to place planned deadlines on the kernel timeline, and rejects incomplete jobs, missing trace buffers and mismatched workload settings.
The host tool uses Python’s standard library and a browser. A judge can inspect the supplied captures without installing QNX or extra Python packages. The repository includes the C source, original .kev files, text exports, capture commands, SHA-256 hashes, screenshots and tests. The README also covers rebuilding and recording both modes on QNX.
Built With
- c
- css3
- fifo-scheduling
- html5
- javascript
- pthreads
- python
- qemu-10.2.1
- qnx-os-8.0
- qnx-sdp-8.0
- qnx-traceevent
- svg
- tracelogger
- traceprinter
