-
-

Nodal Logo
-
Landing Page 1 (Light)
-
Landing Page 2 (Dark)
-
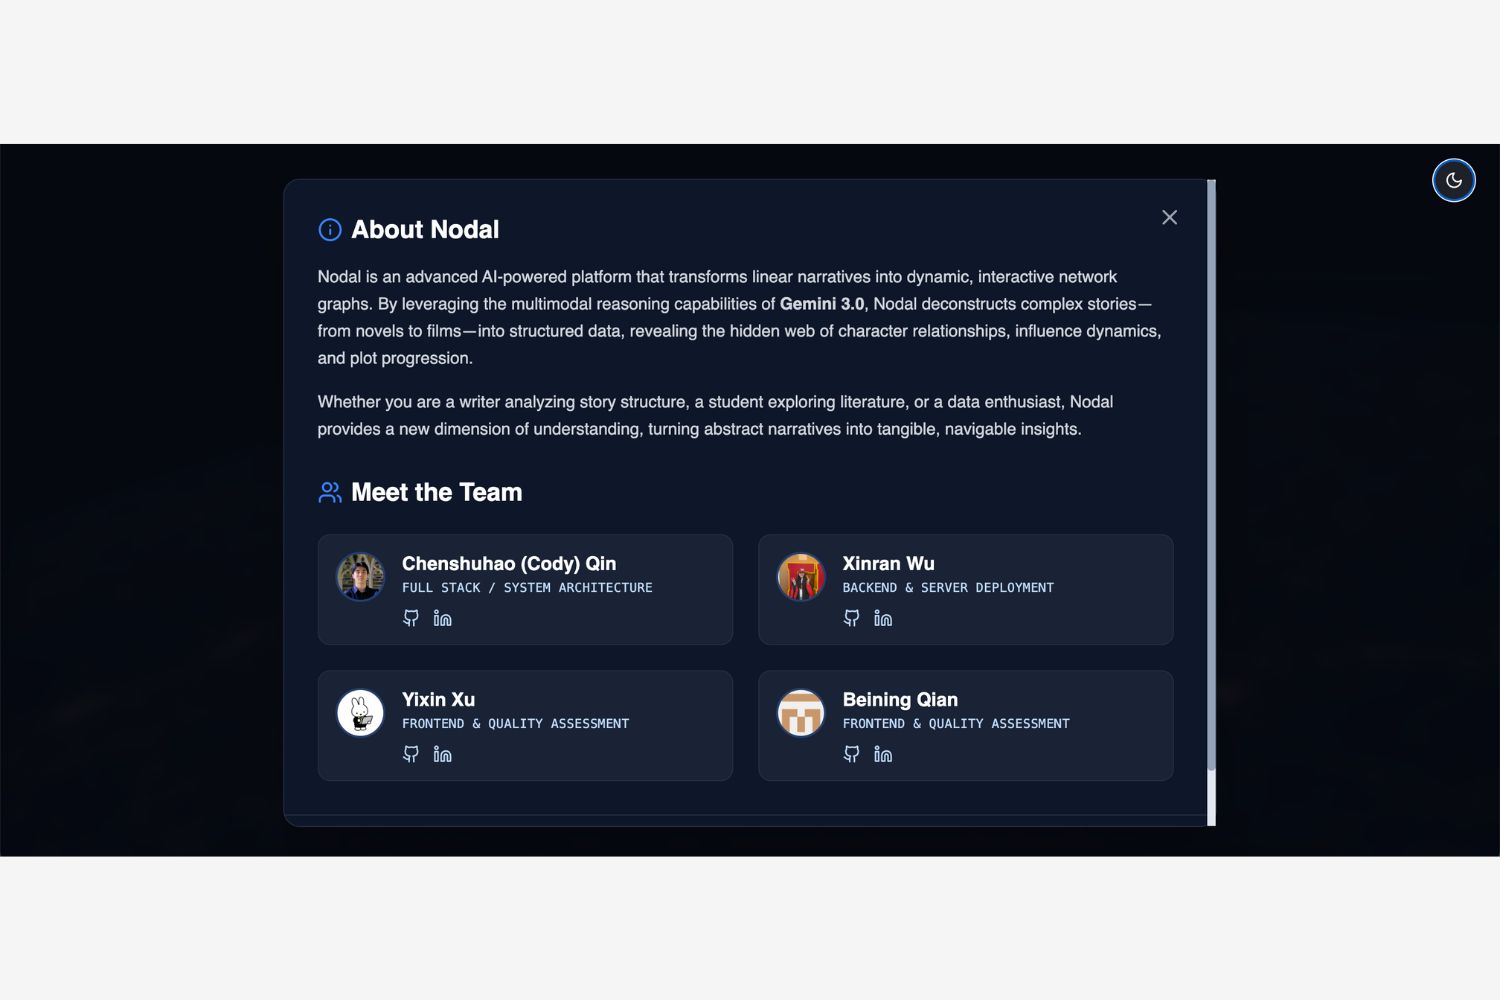
About Nodal
-
Thinking Process
-

Graph View 1
-
Graph View 2
-
Graph View 3
-

Graph View 4


Nodal: Unraveling the Threads of Story with Gemini 3.0
Inspiration
The spark for Nodal ignited during a dinner conversation with friends from the USC School of Cinematic Arts. As they debated the complexities of screenwriting, character arcs, and plot progression, we realized a fundamental gap in their creative workflow.
They frequently tried to use LLMs to summarize scripts or analyze relationships, but they expressed frustration that the output was always... just text. Dense blocks of words. Even when they explicitly asked for "relationship maps," current models would often hallucinate useless ASCII art or provide generic lists that failed to capture the structure of the narrative. They could "read" the story via AI, but they couldn't see it.
The AI understood the plot, but it lacked the spatial reasoning to present it as a rigorous data structure. This gap—between understanding a story and visualizing its underlying topology—inspired us.
We asked: What if we combined Gemini 3.0's massive multimodal context window with rigorous graph theory?
We wanted to build a tool that doesn't just "summarize" a movie or a book, but deconstructs it into a navigable network. We wanted to create a platform where writers and students could instantly visualize who influences whom, identifying the "bridges" between social clusters, and watching the narrative topology shift over time.
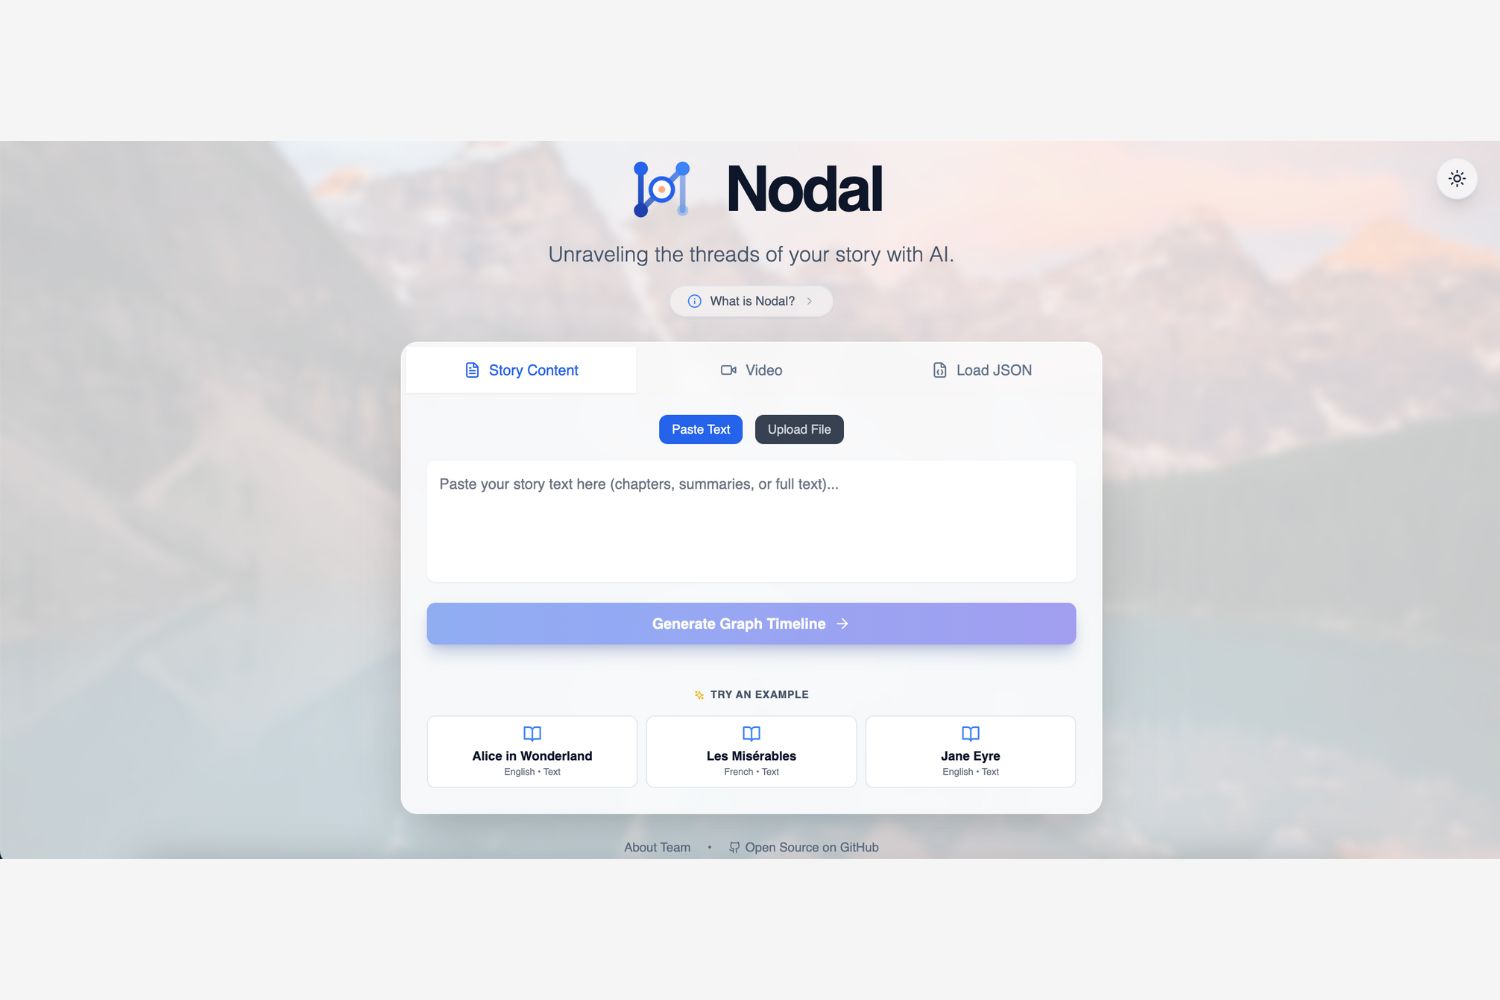
What it does
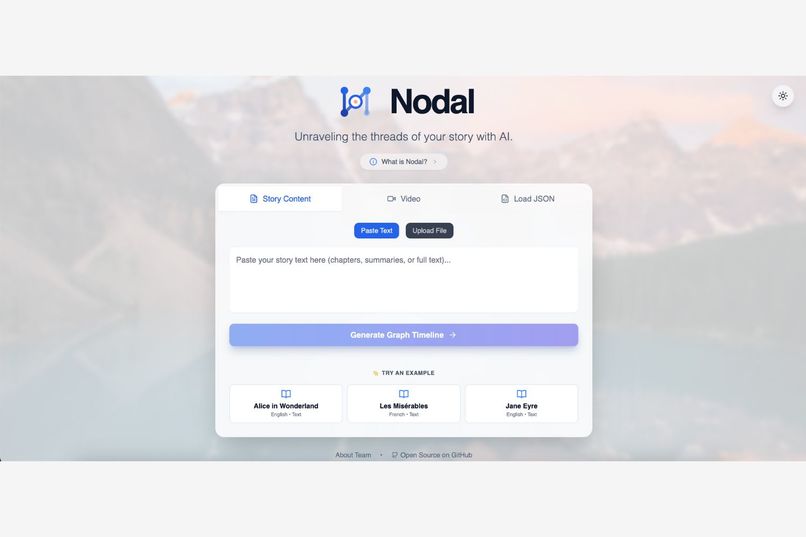
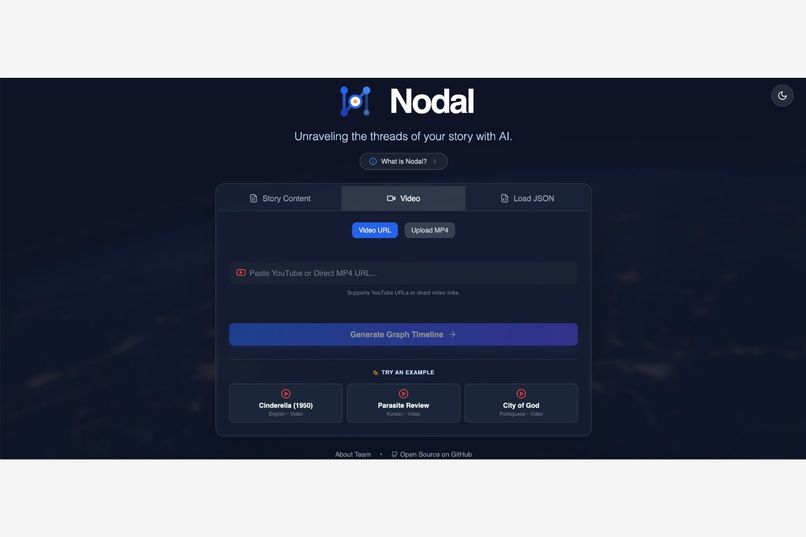
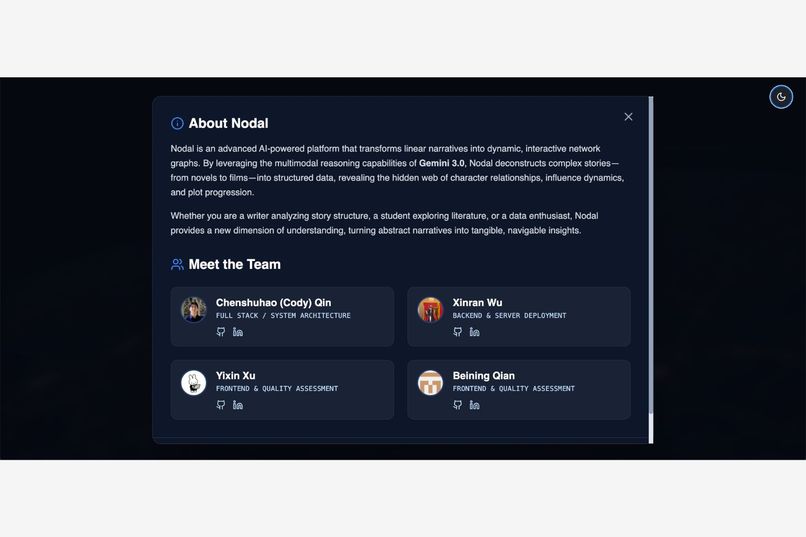
Nodal is a full-stack narrative intelligence engine that transforms linear storytelling (Text or Video) into dynamic, interactive knowledge graphs.
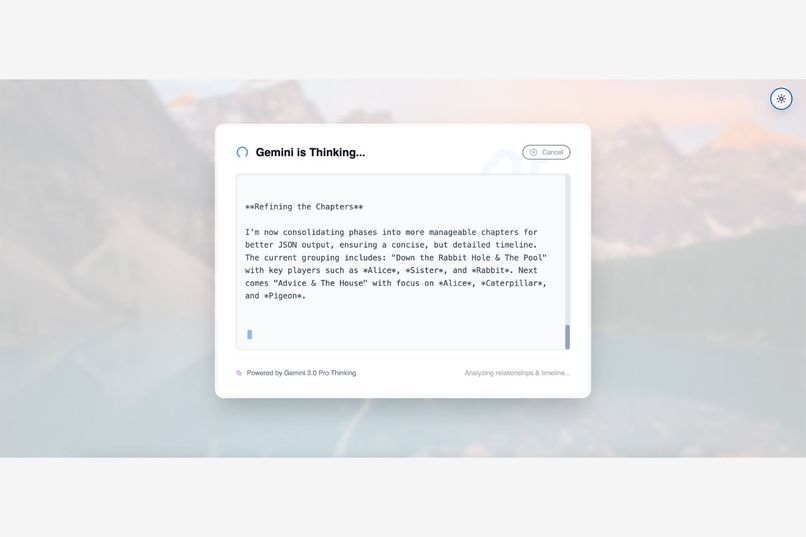
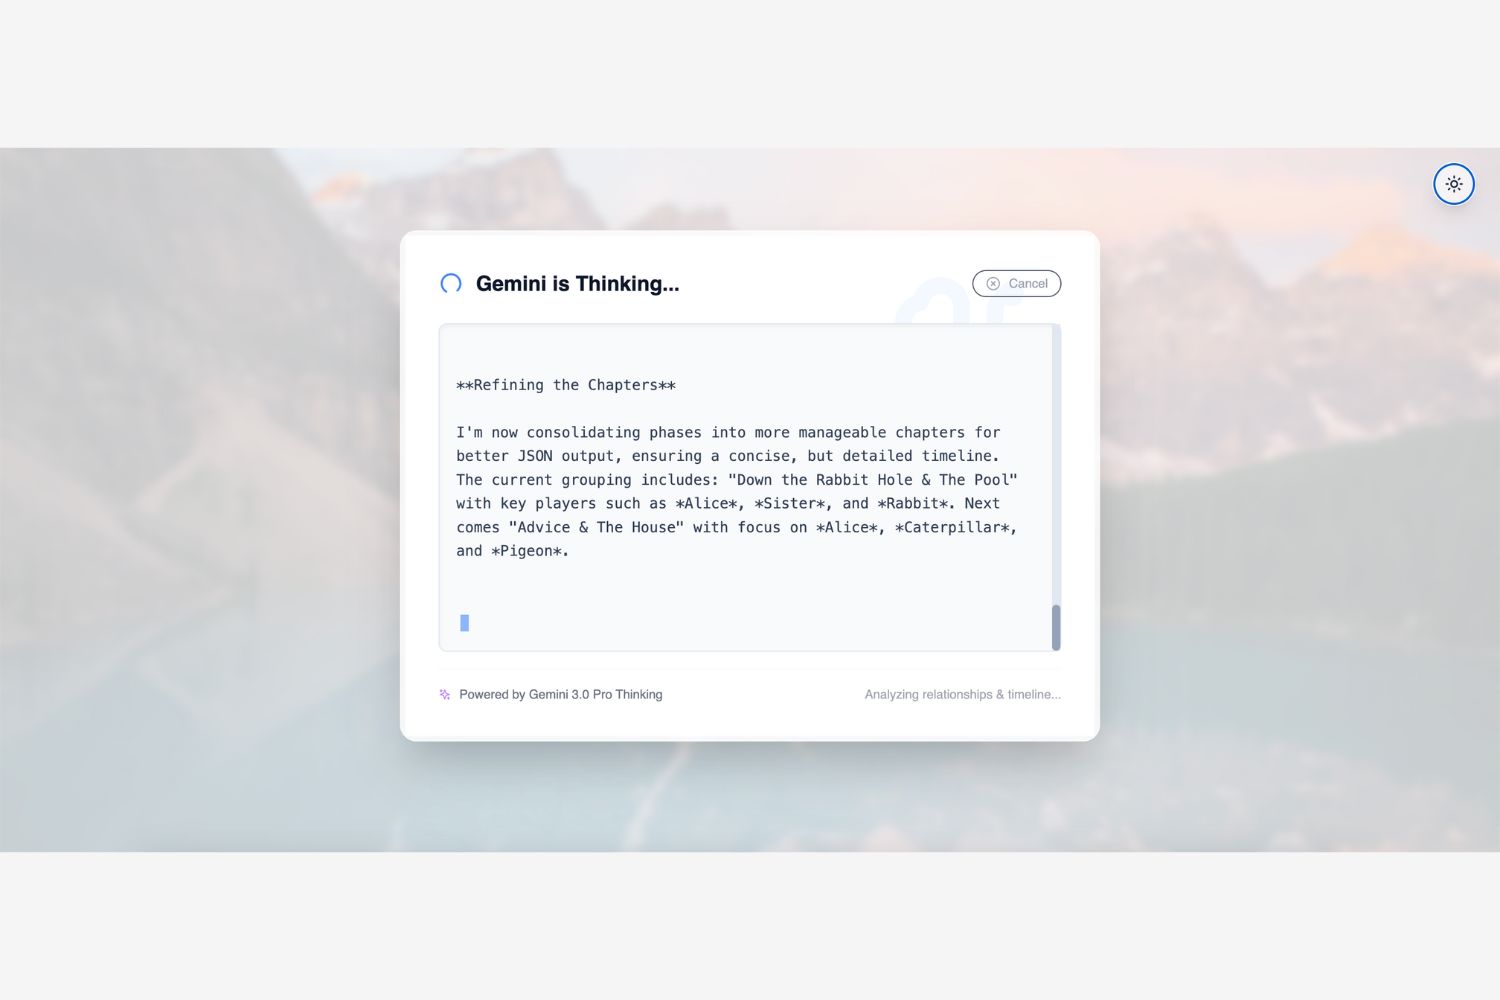
1. 🧠 Visualizing the "Thinking" Process
We utilize the Gemini 3.0 Pro Thinking Model. Instead of a static loading spinner, Nodal streams Gemini's raw "thoughts" to the user in real-time. You can watch the AI debate with itself: "Is 'The Count' the same person as 'Edmond'? Yes, the context suggests a disguise. I will merge these nodes." This provides unprecedented transparency and trust in the data.
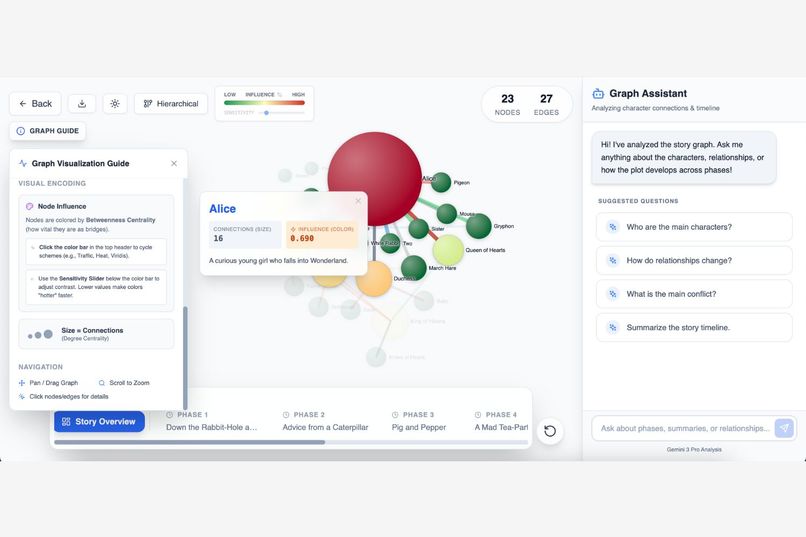
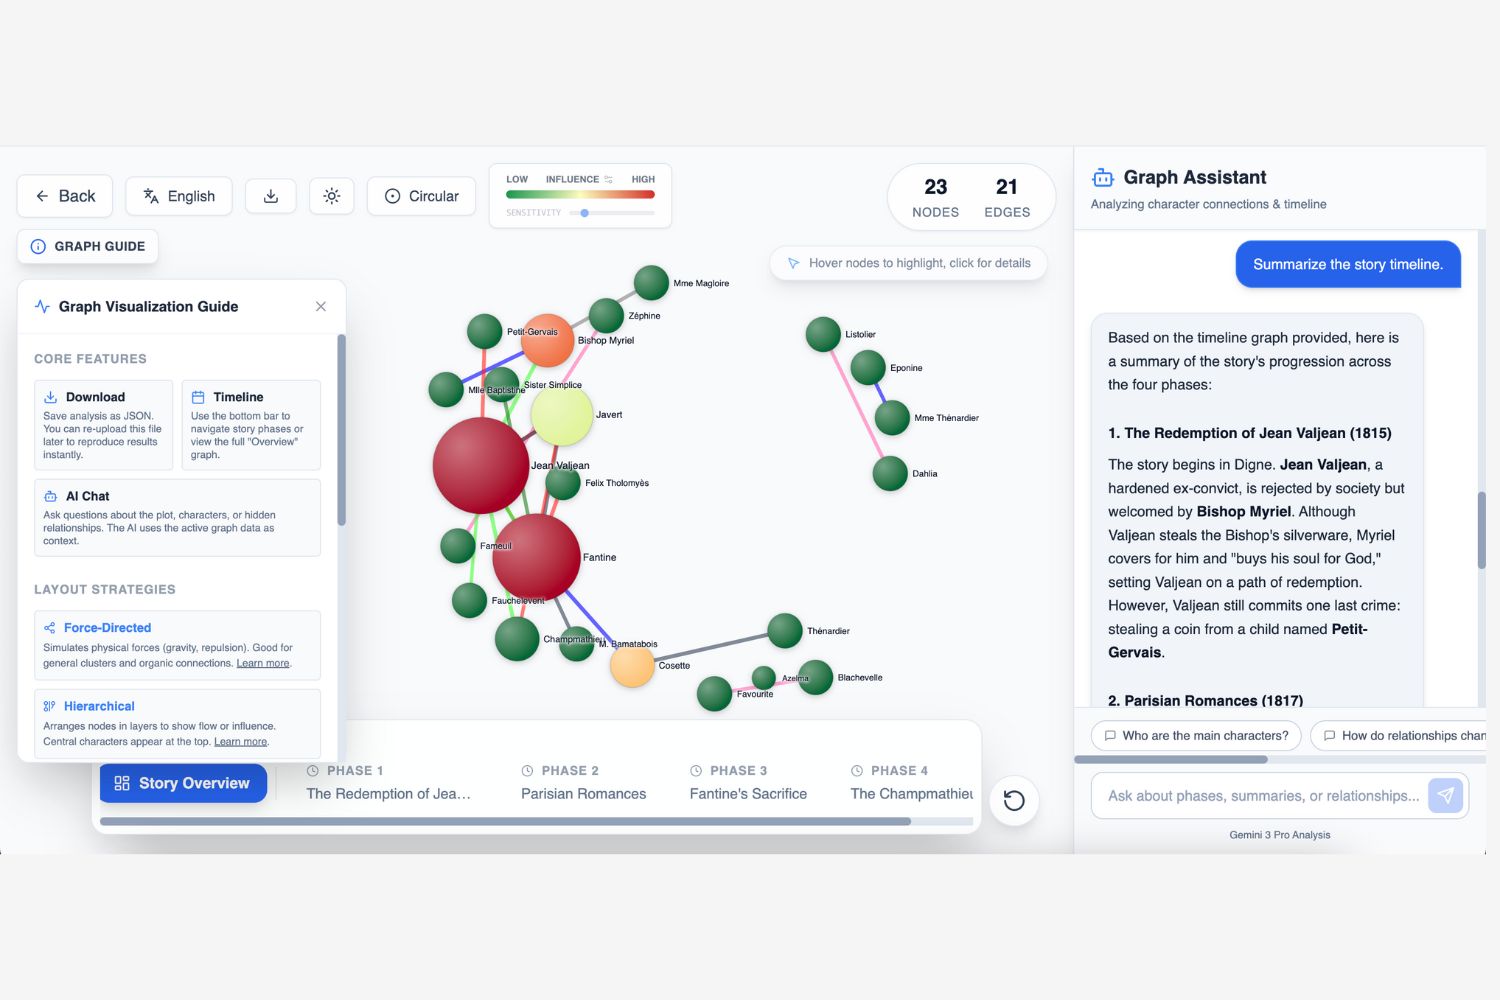
2. 📊 Scientific Graph Visualization
We don't just draw dots; we visualize influence using rigorous Graph Theory metrics calculated server-side via NetworkX:
- Node Size = Popularity: Nodes are sized based on Degree Centrality: $$C_D(v) = \deg(v)$$ A larger node means the character interacts with more unique people.
- Node Color = Influence: Nodes are colored using a heatmap gradient based on Betweenness Centrality: $$C_B(v) =\sum_{s \neq v \neq t} \frac{\sigma_{st}(v)}{\sigma_{st}}$$ This mathematically identifies "Bridge" characters. A character might be small (few friends) but "Hot/Red" (high influence) because they are the only link between two warring factions.
- Dynamic Layout Strategies:
- Force-Directed: Simulates physics for organic clustering.
- Hierarchical: Arranges characters by influence/generations (great for family trees).
- Circular: Highlights network density and isolated communities.
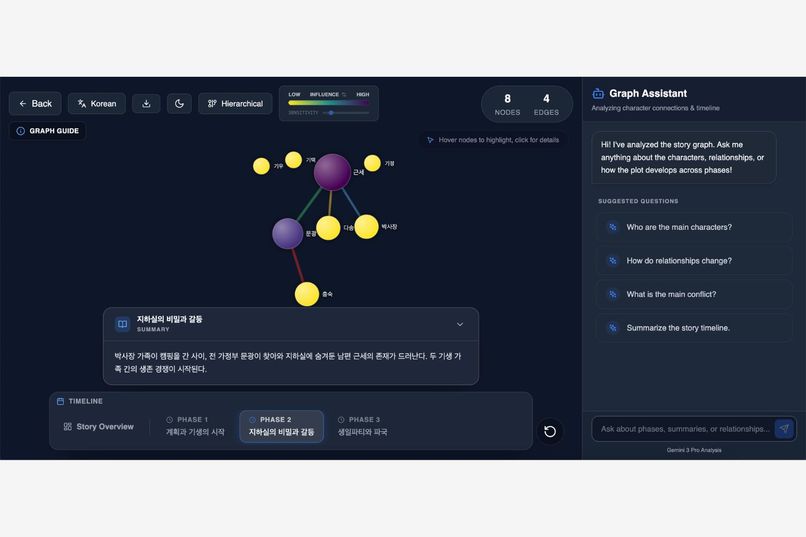
3. ⏳ Temporal Narrative Timeline
Stories aren't static images; they are flows. Nodal breaks the narrative into chronological Phases. Users can slide through the timeline at the bottom of the screen to watch relationships form, break, and evolve as the plot thickens. Each phase includes an AI-generated summary of events.
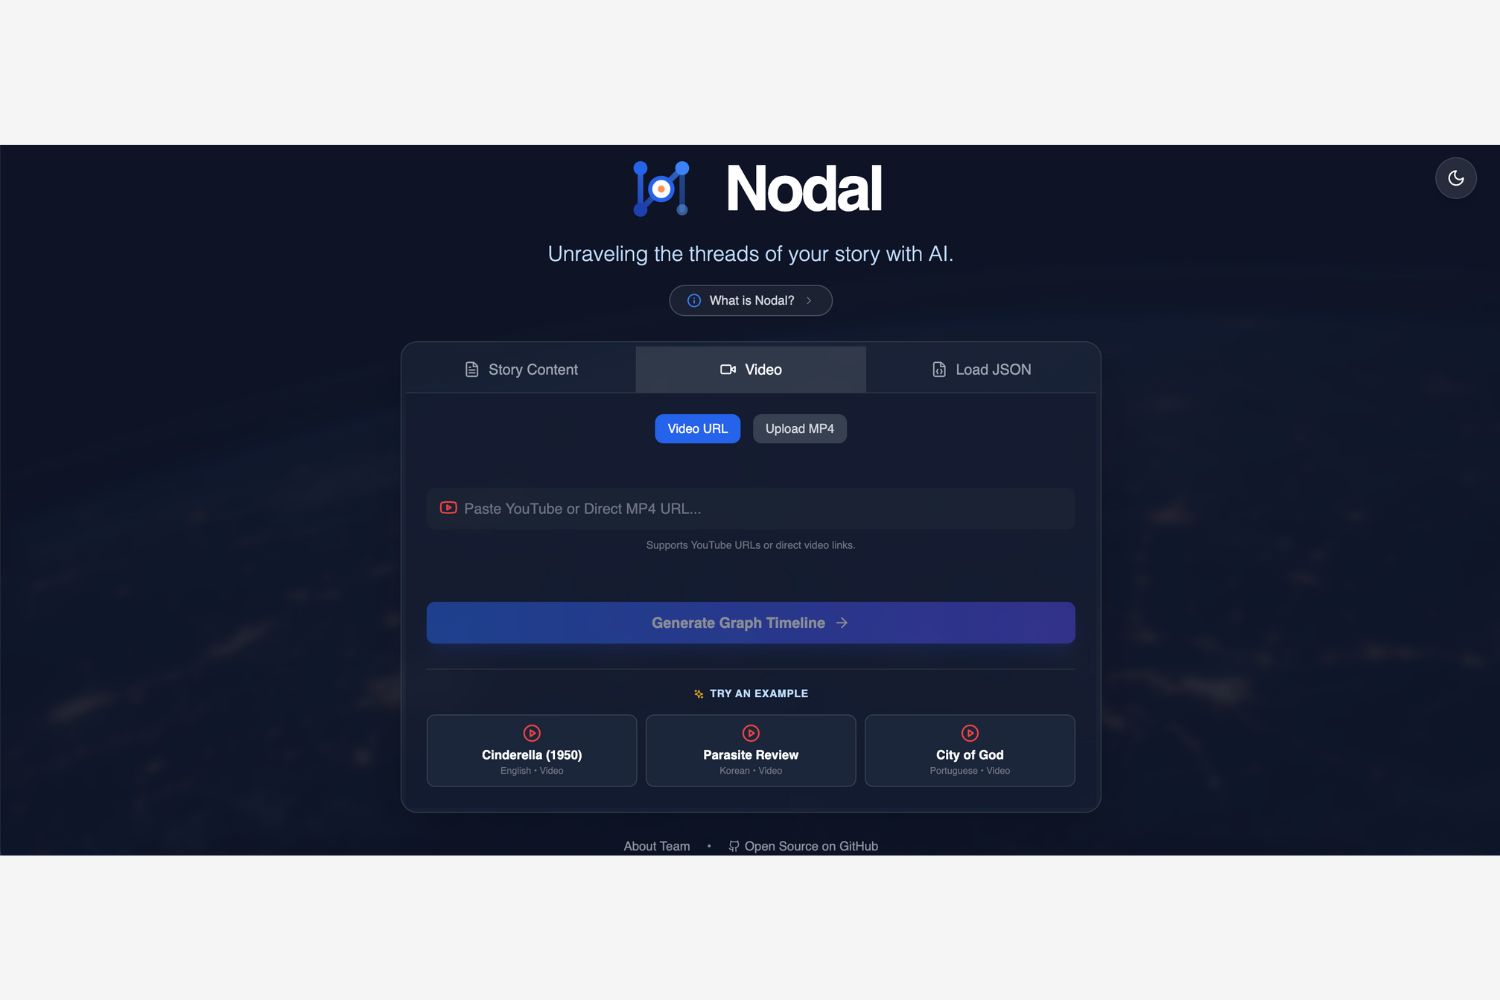
4. 🌐 Bilingual Translation
Nodal is built for a global audience. The graph supports instant toggling between the Original Language (e.g., French for Les Misérables, Korean for Parasite) and English. This is perfect for language learners or analyzing foreign cinema.
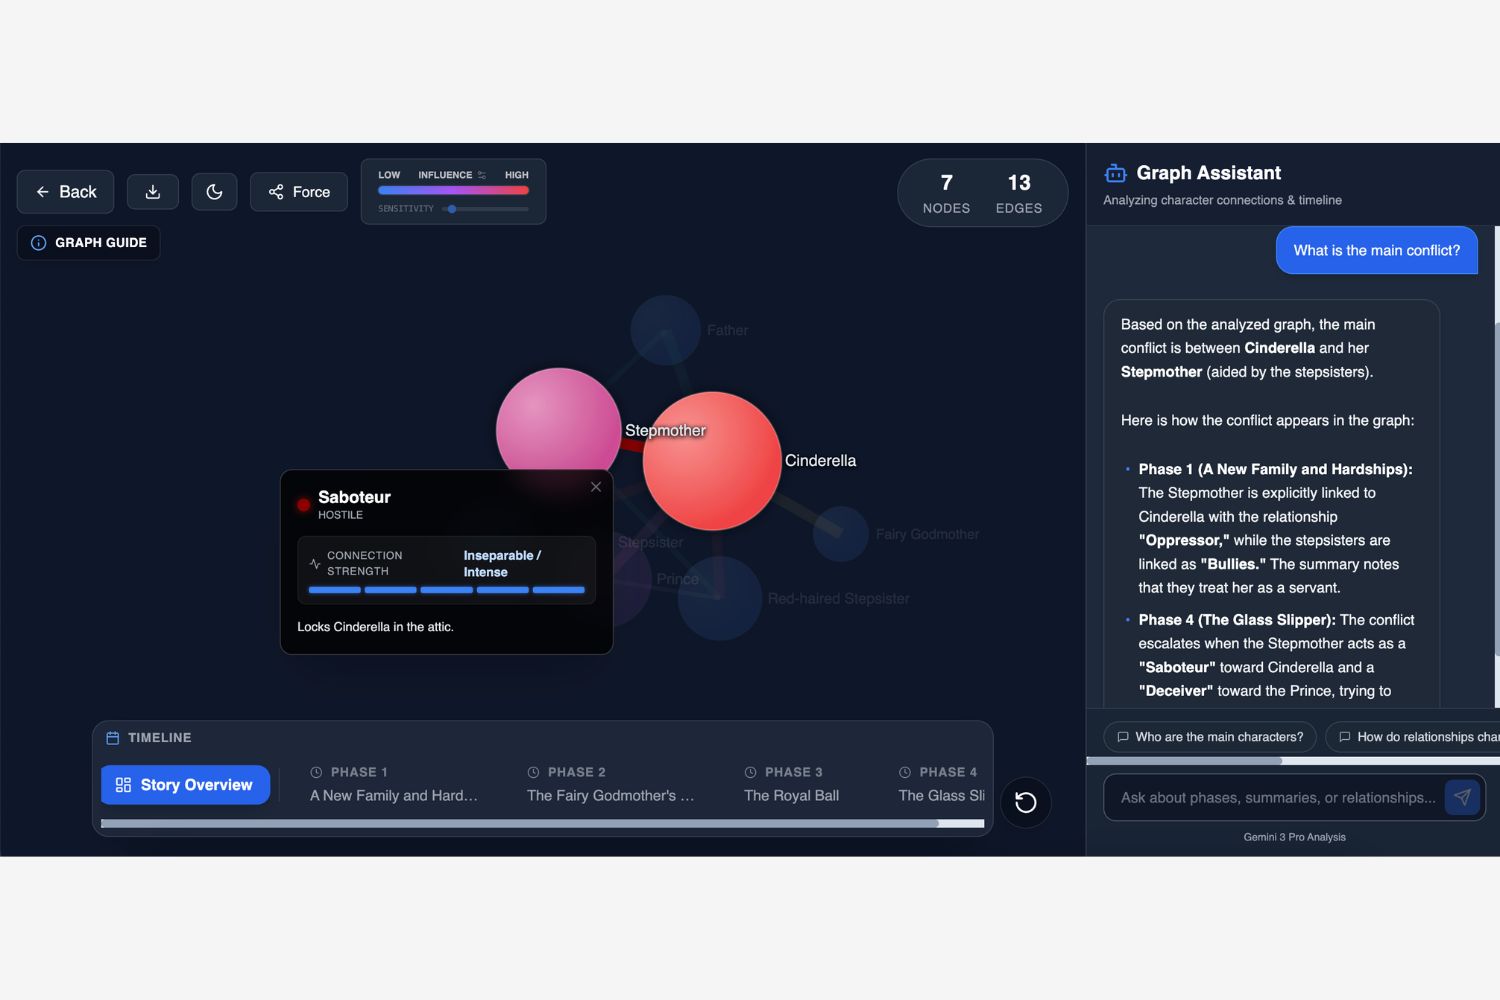
5. 💬 Context-Aware Chat
We built a RAG-like chat interface that is grounded in the current graph state. Users can ask: "Why is the relationship between Character A and B red (hostile) in Phase 3?" The AI answers using the specific edge data and summary from that exact timeline phase.
6. 💾 Reproducibility & Export
Users can download their entire analysis as a JSON file. This allows for instant reloading of complex graphs without re-querying the API, facilitating sharing and further study.
How we built it
We architected Nodal as a high-performance modern web application:
- The Brain (Gemini 3.0 Pro): We utilized the
gemini-3-pro-previewmodel via the Google GenAI SDK. Its extended context window allows us to feed entire chapters or large video files in a single pass. We heavily utilized the Thinking Config to ensure the model reasons through character identities before outputting JSON. - Backend (FastAPI & Python):
- NetworkX Integration: We perform server-side graph algorithms to ensure the visual metrics (Centrality) are mathematically accurate, not just hallucinations.
- Dual-Stream Architecture: We stream NDJSON to the frontend, allowing us to send "Thought Events" and "Data Events" simultaneously over a single HTTP connection.
- Frontend (React 19 & D3.js):
- Physics Engine: The core visualization uses D3.js. We implemented a custom force simulation (
forceManyBody,forceCollide,forceLink) to prevent "hairball" graphs. - UI/UX: Built with Tailwind CSS, featuring a seamless Dark/Light mode, Glassmorphism panels, and interactive legends.
- Physics Engine: The core visualization uses D3.js. We implemented a custom force simulation (
- Video Pipeline: We used the Gemini File API for video processing. The backend handles the upload, polls for processing status, and injects the file URI directly into the multimodal prompt.
Challenges we ran into
- The Entity Resolution Problem: In stories like Les Misérables, the protagonist is referred to as "Jean Valjean", "Monsieur Madeleine", and "Number 24601". Initially, the AI created three separate nodes. We solved this by refining our System Prompt to strictly enforce ID consistency and leveraging Gemini's "Thinking" capabilities to reason through aliases before generating the JSON.
- Visualizing "Hairballs": Raw relationship data is often messy. A graph with too many edges becomes unreadable. We had to fine-tune the D3 physics parameters and implement a dynamic filtering system based on edge weight to keep the visualization clean.
- Streaming Structured Data: Streaming raw text is easy. Streaming a valid JSON object while simultaneously streaming the model's "thoughts" required a complex parsing architecture on the frontend to handle the incoming data chunks without crashing the UI.
Accomplishments that we're proud of
- Seamless Multimodality: Building a single pipeline that accepts both raw text and video files (MP4/YouTube), treating them with equal analytical depth.
- The "Thought" Stream: The loading experience is a highlight. Watching the AI "think" turns the waiting time into a fascinating feature rather than a nuisance.
- Bridging Math & Art: We successfully combined LLM creativity with Graph Theory rigor. The colors and sizes in Nodal aren't arbitrary; they represent actual mathematical properties of the narrative structure.
What we learned
- The Power of "Thinking" Models: We learned that enabling Gemini's visible thinking process significantly improved the quality of the structured JSON output. The model "self-corrects" its understanding of character relationships during the thinking phase.
- D3.js Physics: We gained deep insights into balancing physical simulation forces to make a graph look "human-readable" and organic.
What's next for Nodal
- Real-time Live Analysis: Implementing WebSocket support to analyze live video feeds (e.g., Twitch streams, News broadcasts) to map character dynamics in real-time.
- Comparative Analysis: Adding a "Diff" view to compare two different stories side-by-side (e.g., comparing the book Romeo and Juliet vs. the movie West Side Story) to visualize structural similarities.
- Export to Gephi/Neo4j: Allowing researchers to export the graph data for professional academic analysis.
- Granular Drill-down: Clicking a node could pull up the specific video timestamp or text paragraph where that character is most active, creating a perfect bridge between the abstract graph and the source material.
Built With
- d3.js
- fastapi
- gemini-3.0-pro
- google-gemini-api
- networkx
- python
- react
- tailwind-css
- typescript
- vite


Log in or sign up for Devpost to join the conversation.