-
-
Demo 1
-
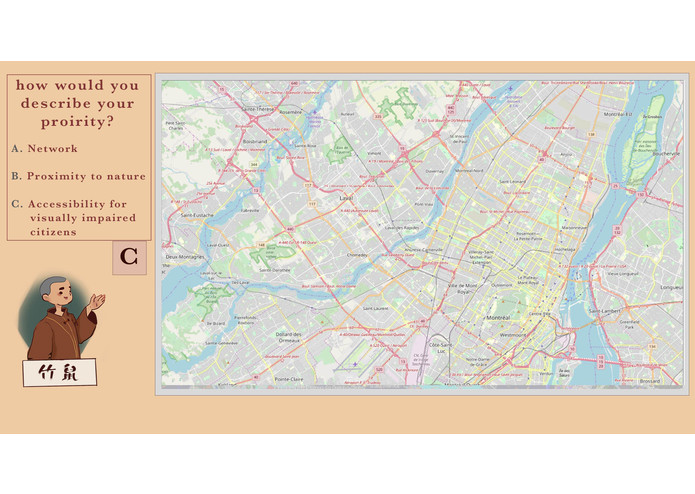
Demo 2
-
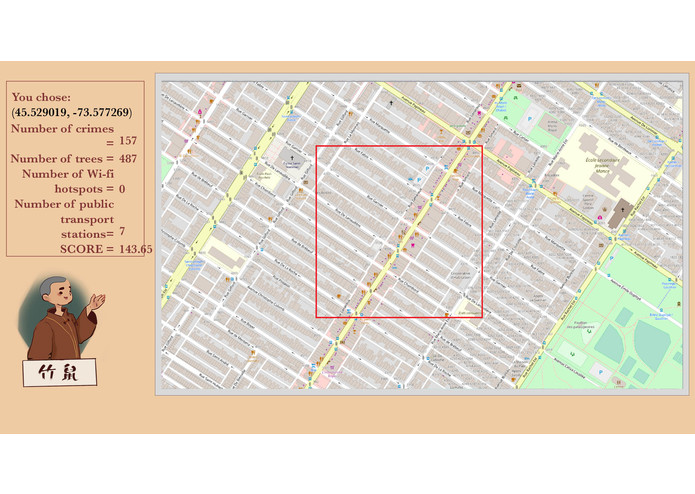
Demo 3
-
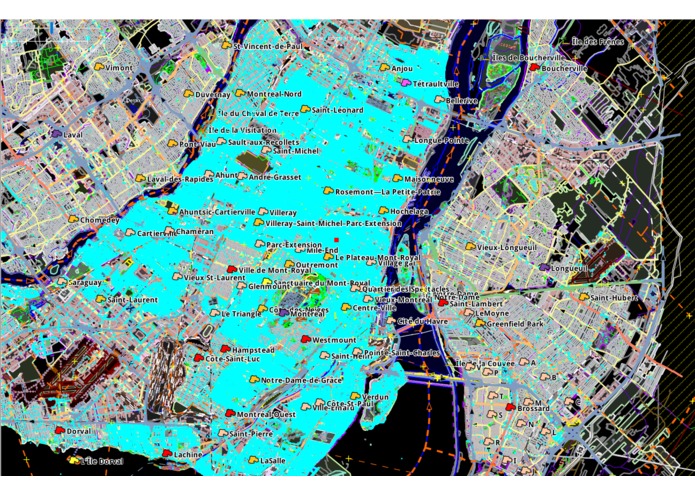
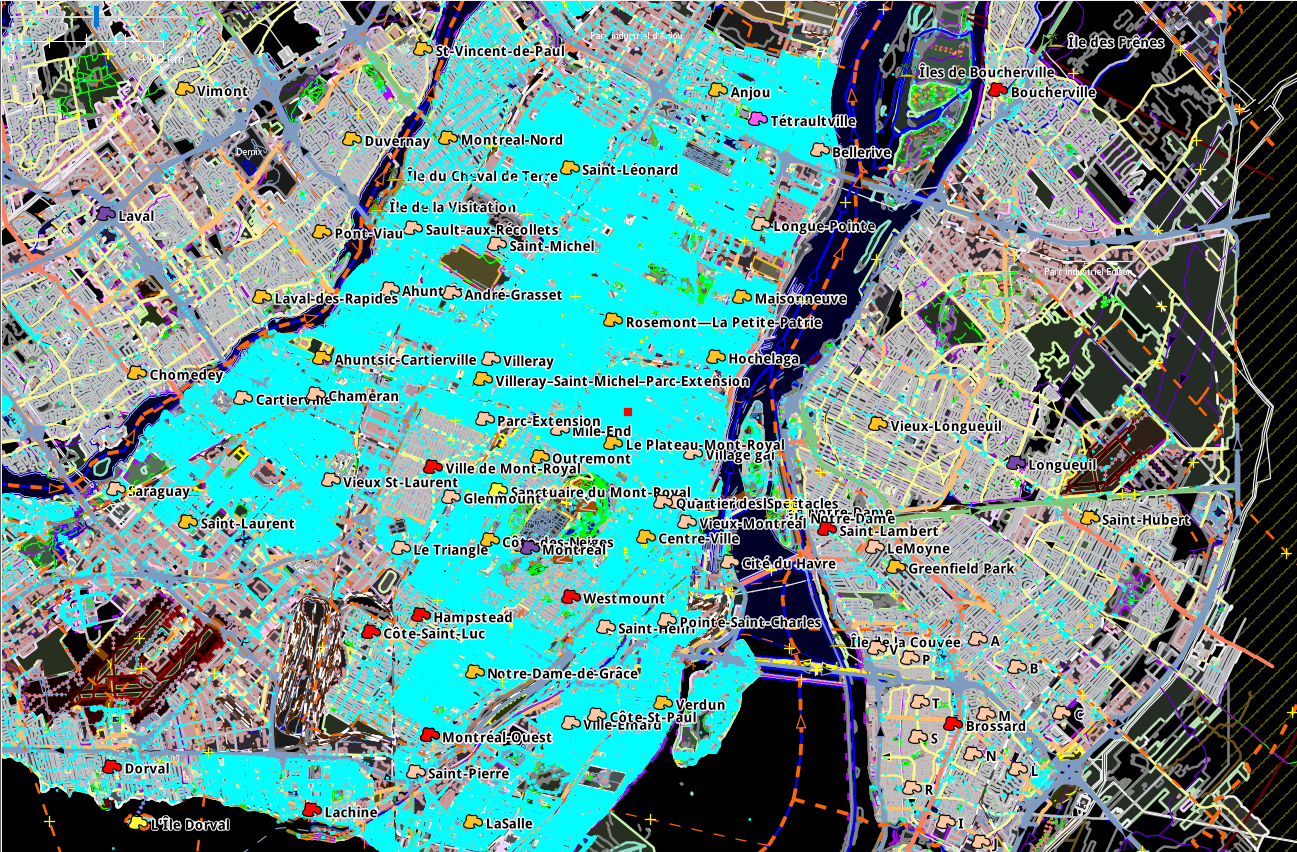
Developer view
Inspiration
Google maps mainly offers convenience for everyday commuting and global traveling, however, we would also need some official census data to reflect the social environment when people plan to move into a new community. In addition, we were inspired by Chinese Metaphysics Feng Shui Theory which taking consideration of multi-variables to choose a perfect location. Therefore, our team considered integrating 5 factors, namely public Wi-Fi, the crime rates, traffic accidents, and traffic lights which are favorable to visually impaired citizens, and the trees in Montreal, into JOSM to generate a new form of map as a beginning to explore this area.
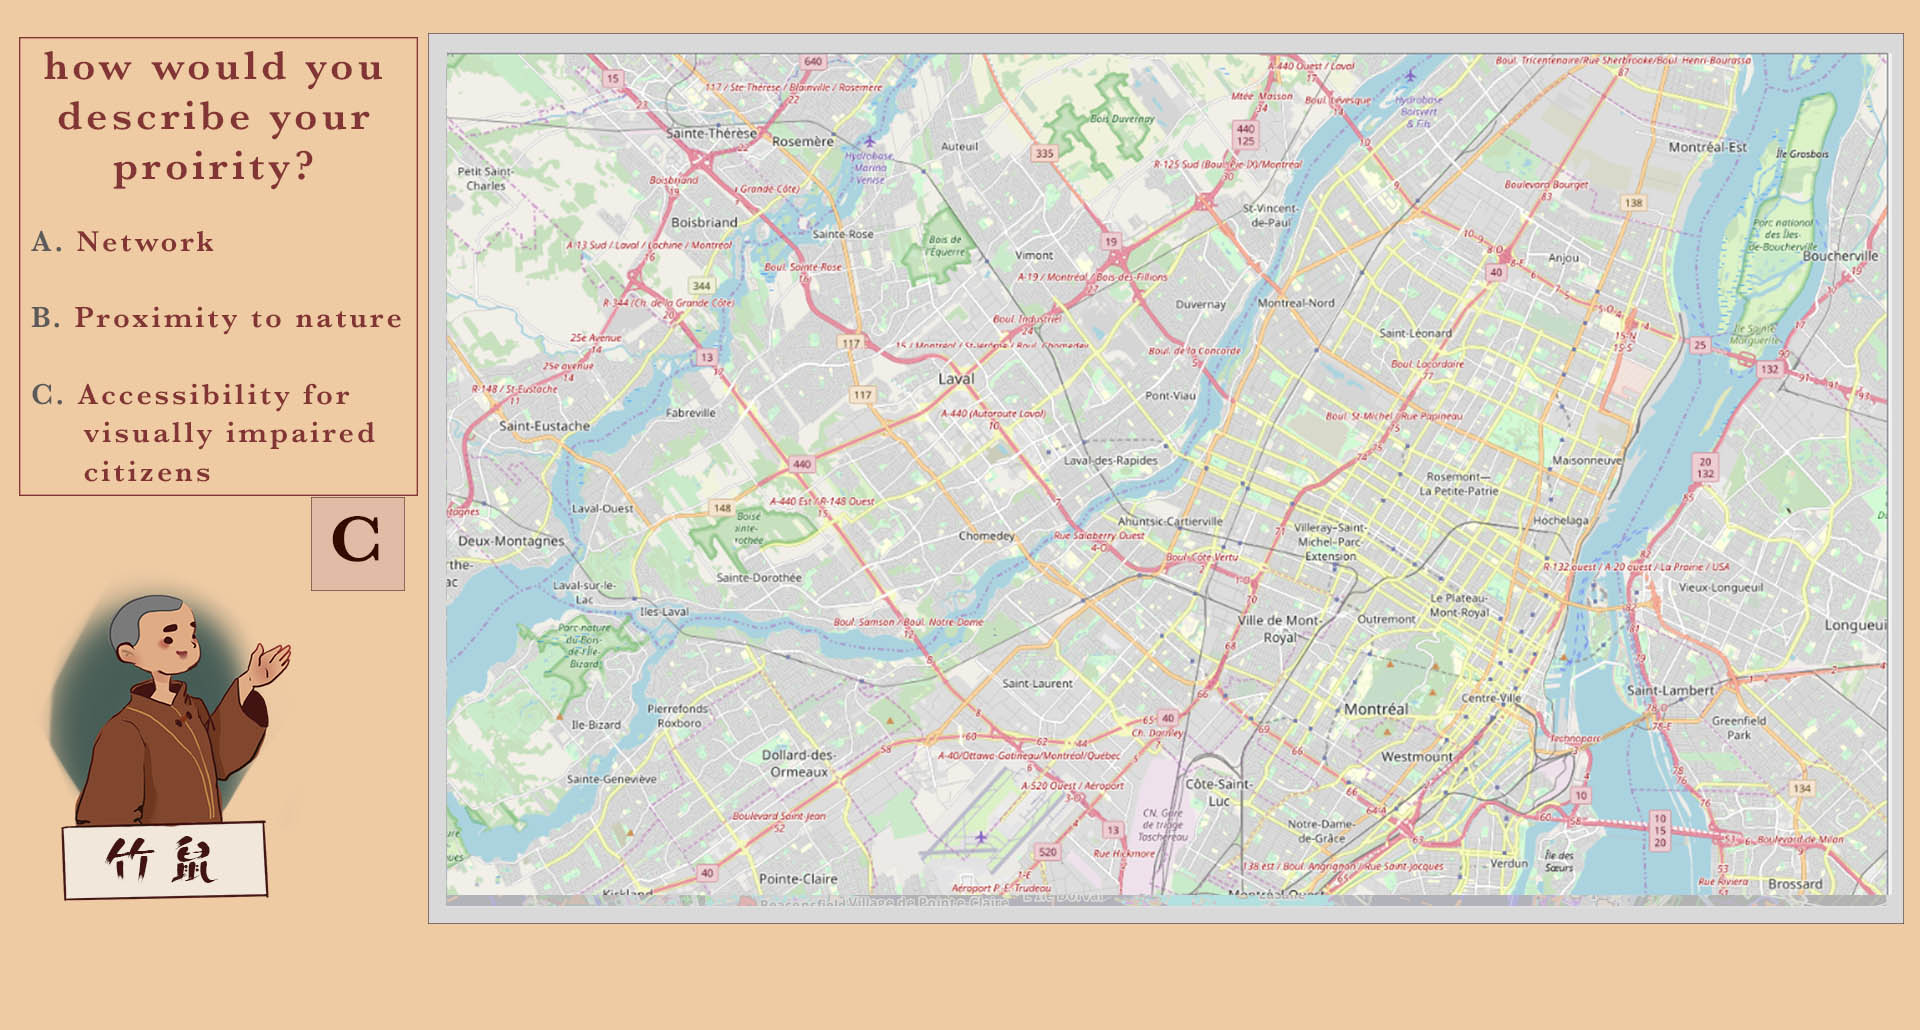
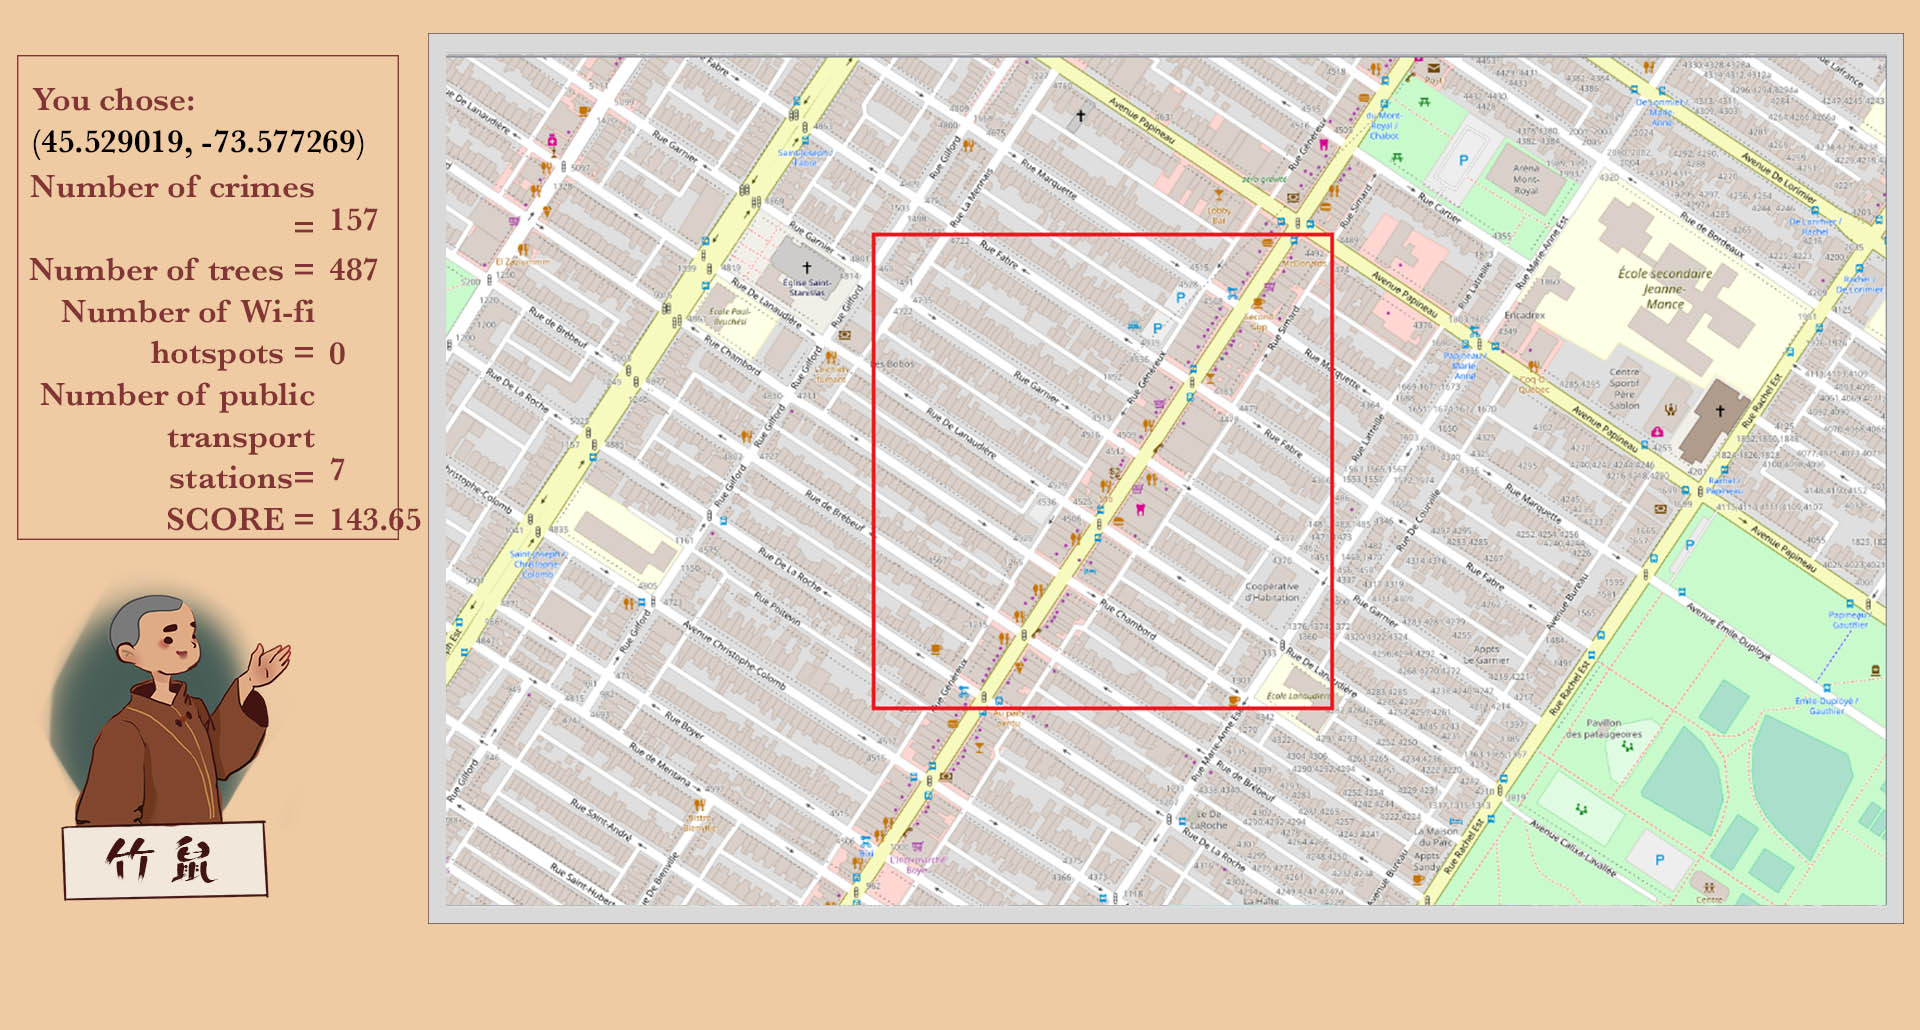
What it does
Our group’s project is a location rating program for the location that gives rating for a location at user's choice. In terms of diversity of individuals, we provide a customized ranking for each kind of user according to their identities and preference.
How we built it
First of all, we managed to get the map of Montreal open street map. Later, in order to get the social and cultural factors and add tags to each spot on the map, we managed to get access to Montreal governmental statistics information and translate it into pinned layer on the map by Javascript and QGIS. Based on the 5 different factors, we built an integrated map with JOSM where user can see our rating on any location they like to check.
Challenges we ran into
- Given the time limitation, we only developed a beta version with very limited application. So in the future, we can enrich our database by introducing more parameters and attributes from certain big data.
- When we processing millions of data into this map, we accidentally found some errors in the governmental census data, one of them being that the coordinates appear in other continent which are supposed to be only in Montreal.
- We simplify our scoring models where one node represents only an event without considering, for example, the severity of different crimes and traffic accidents.
Accomplishments that we're proud of
- It takes in consideration of five publicly concerned factors, which not quite accessible to public.
- We present data in a user-friendly way.
- Fancy UI.
- An app in an area people rarely run into.
What we learned
- We learned how to deal with multiple file types, such as
.osm,.geojson, and.csv. - We also gained an insight into how to tackle with big data processing, such as that the nodes generated in the map are up to 3,000,000 and that each attribution entries can be up to 340,000.
- Javascript and Geographic information software, namely
QGIS, andJOSM.
What's next for Qi
- Based on the criminal rates or other related factors, the insurance companies are able to get access of the scores from our project to make some changes to their existed insurance plans.
- We also took great consideration into the well beings of physically challenged individuals by applying the special traffic light distribution to this rating system.
- We plan to take more information such as air flow, elevation, and proximity to health care facilities and services.
- We will apply the idea to all over the world.
Built With
- javascript
- jsmo
- photoshop
- procreate
- qgis


Log in or sign up for Devpost to join the conversation.