-
-
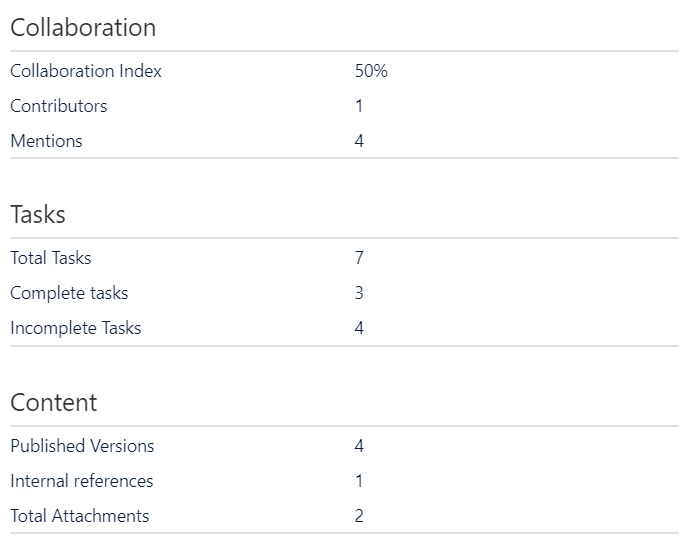
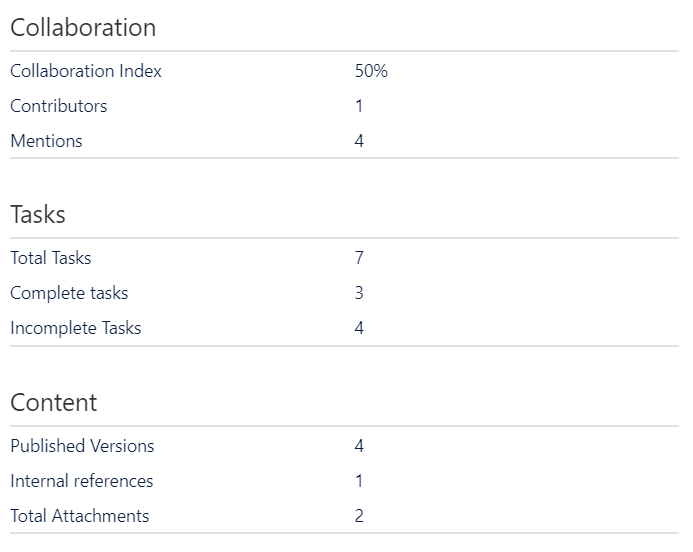
Collaboration, Tasks, and Content fields
-
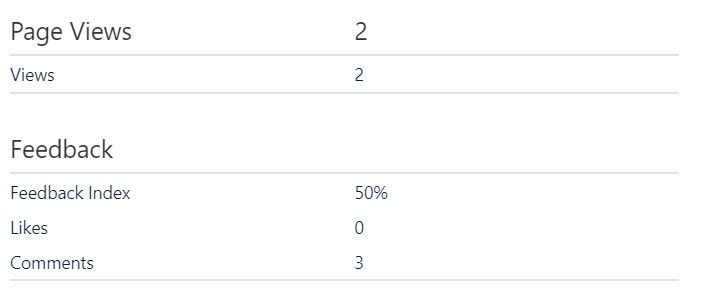
Page views and Feedback fields
-
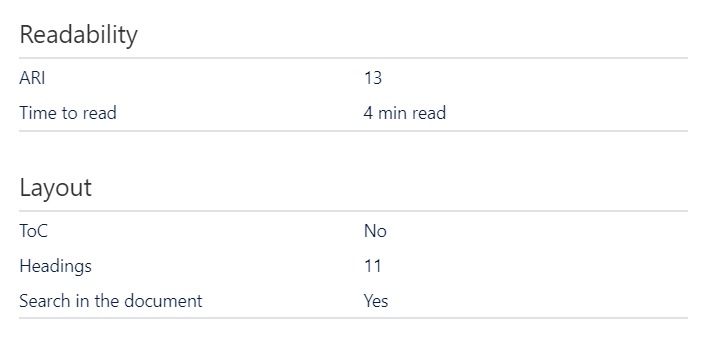
Readability and Layout fields
-

QC Page Metrics logo

Inspiration
Confluence is a collaborative platform with many useful tools, however, we wanted a better way to control the quality of the documentation. Many companies, like ours, use Confluence Cloud to store Internal Processes, SOPs, their Employees' Handbooks, etc.
There are two challenges we wanted to overcome with this solution. The first one is how could someone better monitor the efficacy of the documents. The QC Page Metrics answers questions like:
- How easy is it to read a particular document?
- How engaged are the readers? -How many people contributed to creating the document in its current look?
The second challenge is that of page content improvement. Someone could possibly wonder:
- Are there any critical processes for the business that have low views?
- Which of the company’s processes should be improved based on the Layout field, and how to trace them?
What it does
The usage of the app is quite simple. All it does is go through the document pages and count the following metrics:
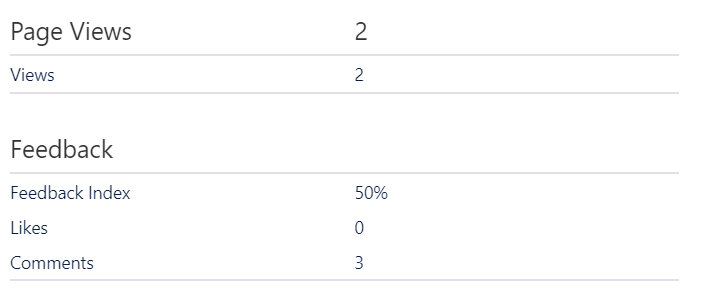
Page Views
- Views Index: This number shows the percentage of the total users that have access to the page, that actually viewed its content.
- Views: How many views does the page have?
Feedback
- Feedback Index: This is an index calculated by adding the Likes and the Comments of a page, dividing them with the Views, and then multiplying this number by 100, to find the percentage.
- Likes: How many people have liked the page?
- Comments: How many comments does this page have?
Collaboration
- Collaboration Index: This is calculated by adding the Contributors and the Mentions.
- Contributors: People who have created and/or edited the page.
- Mentions: People who have been tagged within the page.
Tasks
- Tasks Index: This is calculated by adding the Complete and Incomplete tasks within a page.
- Complete tasks: Marked checkboxes of tasks that have been completed.
- Incomplete tasks: Unmarked checkboxes (tasks that have not been completed yet).
Content
- How many Published versions of the page are there?
- How many Versions were created per year?
- How many Internal references are within the page?
- Does the page have any Images, Tables, and Attachments?
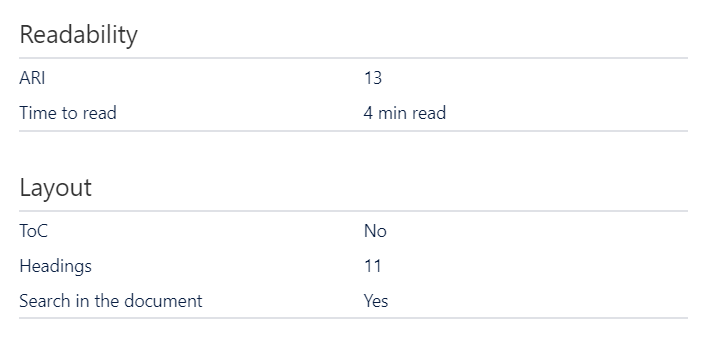
Readability
If you have any doubts about your documents and how easy it is for the users to understand the content of them, then you will find this field really useful. The ARI (Automated Readability Index) will show you the understandability of your text, while the Time to read is how many minutes it will take for a user to go through the content of the page.
Layout
- Is there a ToC (Table of Content)?
- How many Headings are there?
- Is there a Search field in the document?
How we built it
We built the QC Page Metrics app using JavaScript, Node.js, and Confluence REST API.
Challenges we ran into
The biggest challenge we faced while getting ready for Codegeist 2022, should be the race with the time we did to come up with an idea and start developing it. However, it was a really good experience and we are glad we managed to submit our project.
Accomplishments that we're proud of
Codegeist 2022 is our first-ever hackathon and we are really proud we made to develop an app for this purpose. Being able to work as a team to overcome any difficulties related to time is quite an important accomplishment for us as well.
What we learned
During this project, we were reminded that teamwork can actually do wonders. Also, getting to build an app with Forge was a new experience for us.
What's next for QC Page Metrics for Confluence
QC Page Metrics will soon be available in the Atlassian Marketplace. We aim on implementing some more features that we find really useful and hope will help Confluence users improve their documentation.
Built With
- confluence-rest-api
- forge
- javascript
- node.js


Log in or sign up for Devpost to join the conversation.