-
-

Landing
-
Home
-
Forward Look/Biggest Rank Shifts
-
Top 10 leaderboard
-
Patrick Mahomes Stats/WhatIF
-
Patrick Mahomes Portability Score/Trends
-
Explore Page
-
Methodology preview

Inspiration
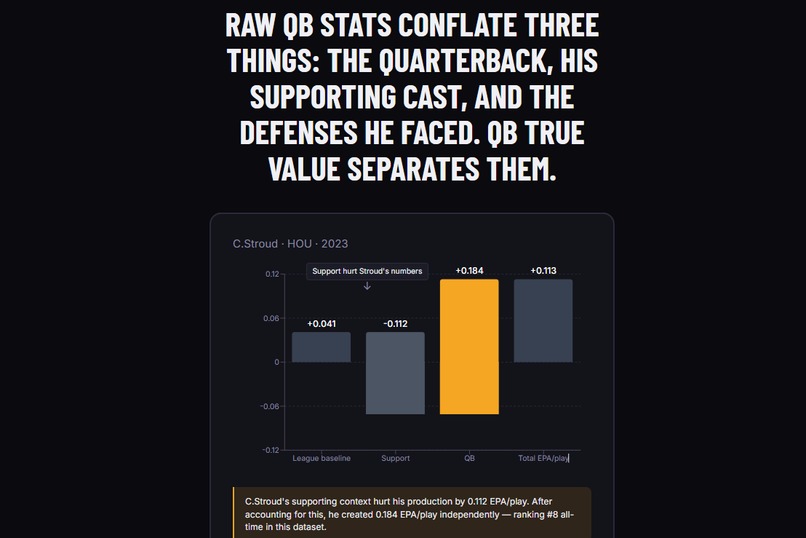
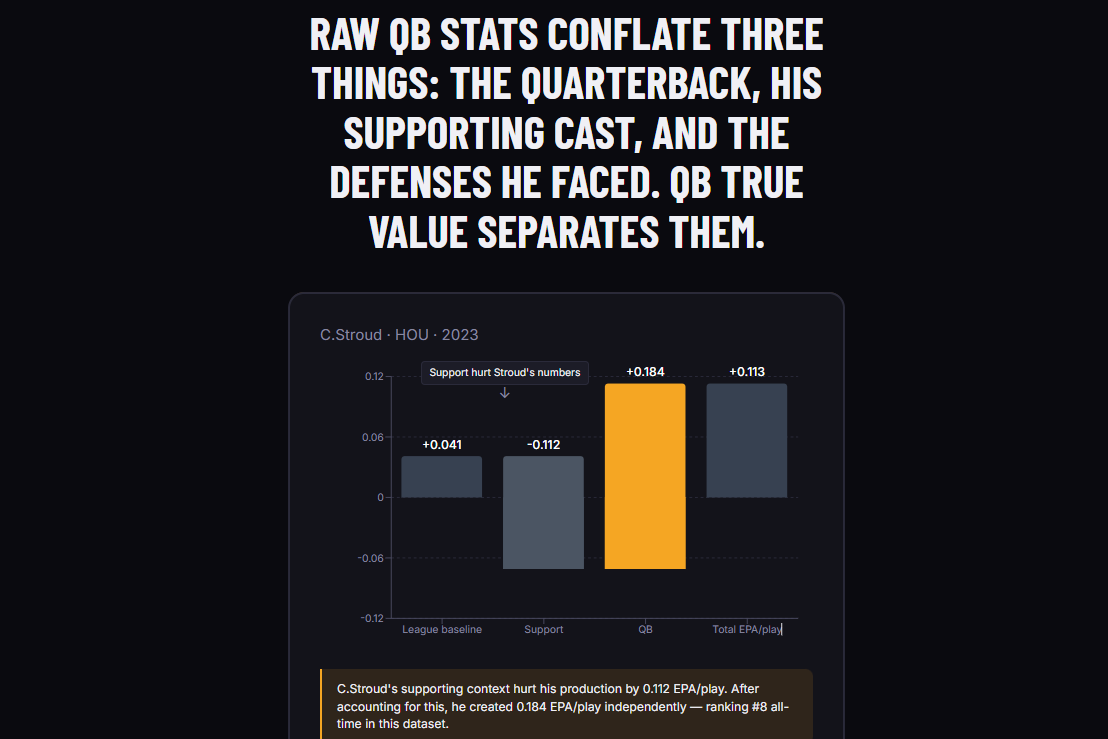
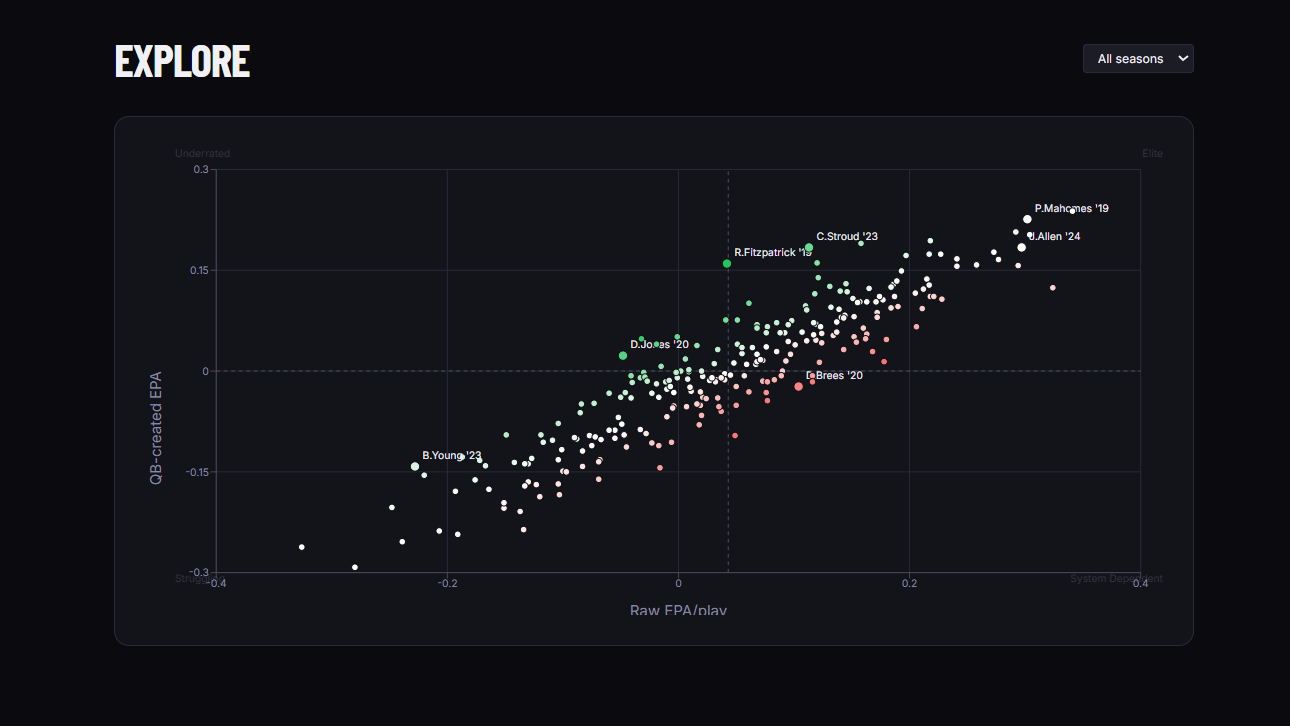
In 2023, C.J. Stroud ranked 80th among NFL quarterbacks by raw EPA per play. He ranked 8th by the value he actually created. The 72-spot gap between those two numbers is the problem QB True Value was built to solve.
Raw EPA per play (the most common advanced QB stat) is a team stat wearing a quarterback's jersey. It rewards quarterbacks on strong offensive lines with elite receivers, and it buries quarterbacks who are outperforming their context. Front offices know this intuitively, but every existing tool for separating quarterback value from team context is either proprietary, unauditable, or doesn't decompose the full picture. PFF grades can't be reproduced. NFL Next Gen Stats' Passing Score doesn't separate QB contribution from support contribution in an additive, inspectable way. Kevin Cole's AQE adjusts for schedule but doesn't isolate protection and receiver talent as explicit separate variables.
We wanted a model where anyone could run the pipeline, check every number, and move the support sliders themselves.
What it does
QB True Value decomposes every qualifying QB-season from 2019–2025 (200+ attempts) into exactly three additive components that always sum to the quarterback's real EPA per play:
League Baseline: what a replacement-level player would be expected to produce in the same game situations (down, distance, field position, score state, win probability, time remaining, weather, roof type), estimated by a gradient-boosted model trained with no QB identity features.
Support Contribution: the additional value attributable to the quarterback's supporting cast: receiver separation, time to throw, pass-block win rate, and opponent defensive EPA, estimated by OLS regression on the residual after Step 1.
QB-Created Value: what's left. The value the quarterback generated independent of his situation and his support.
The app surfaces this decomposition through:
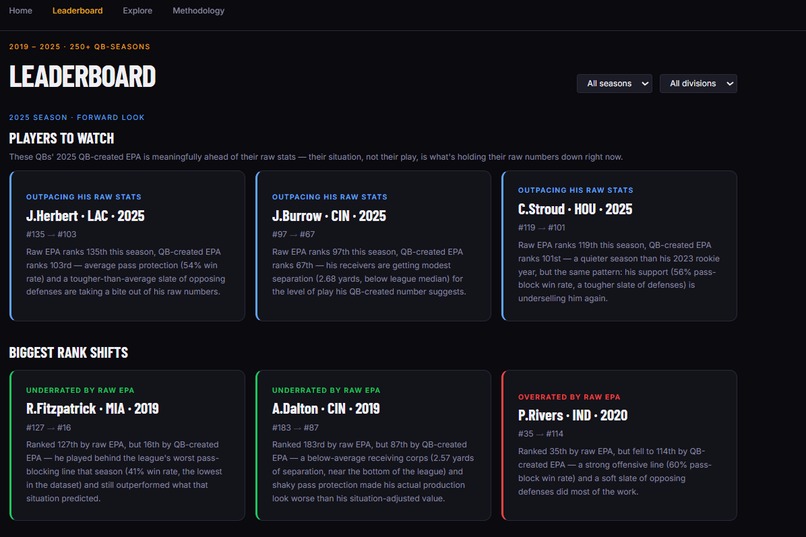
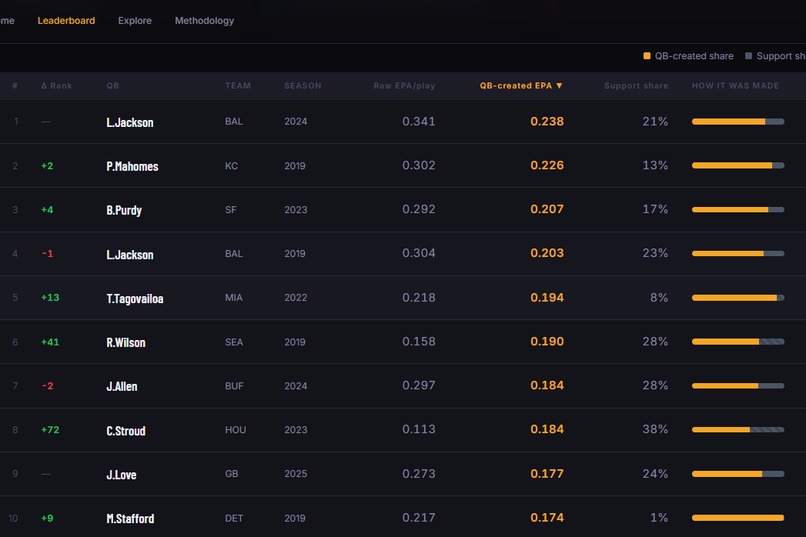
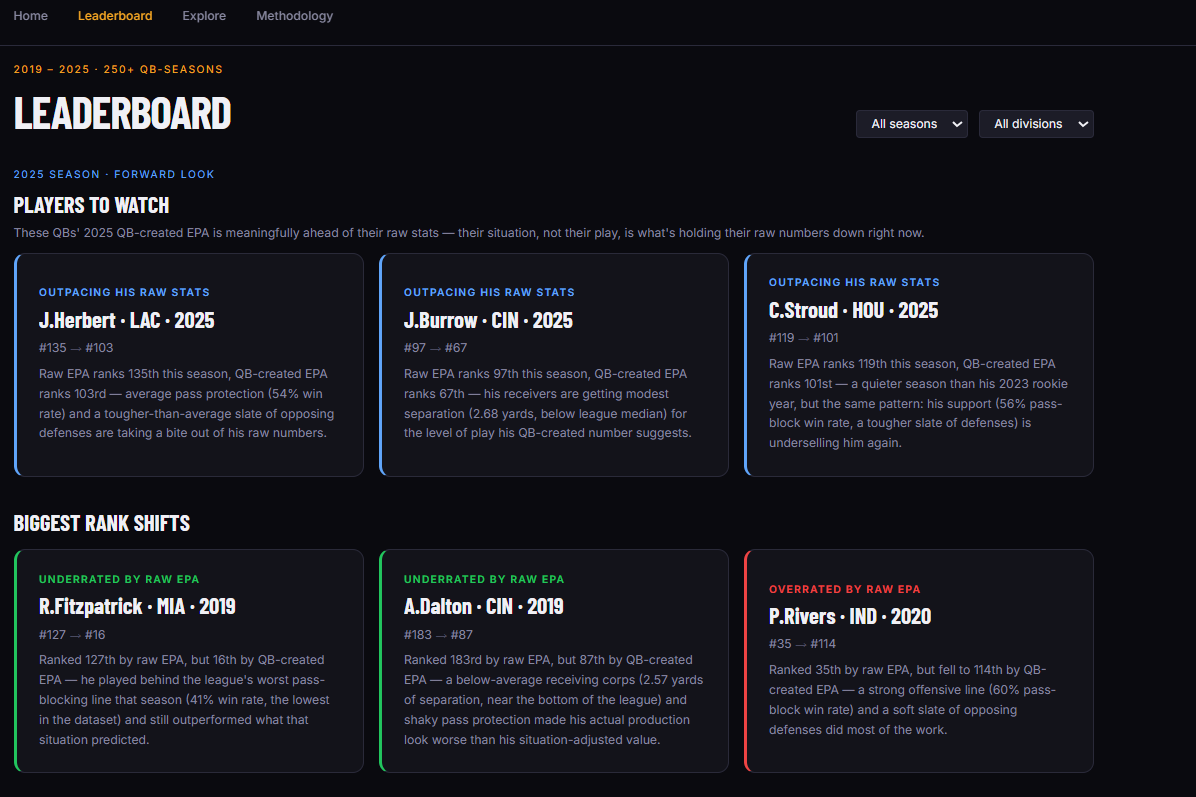
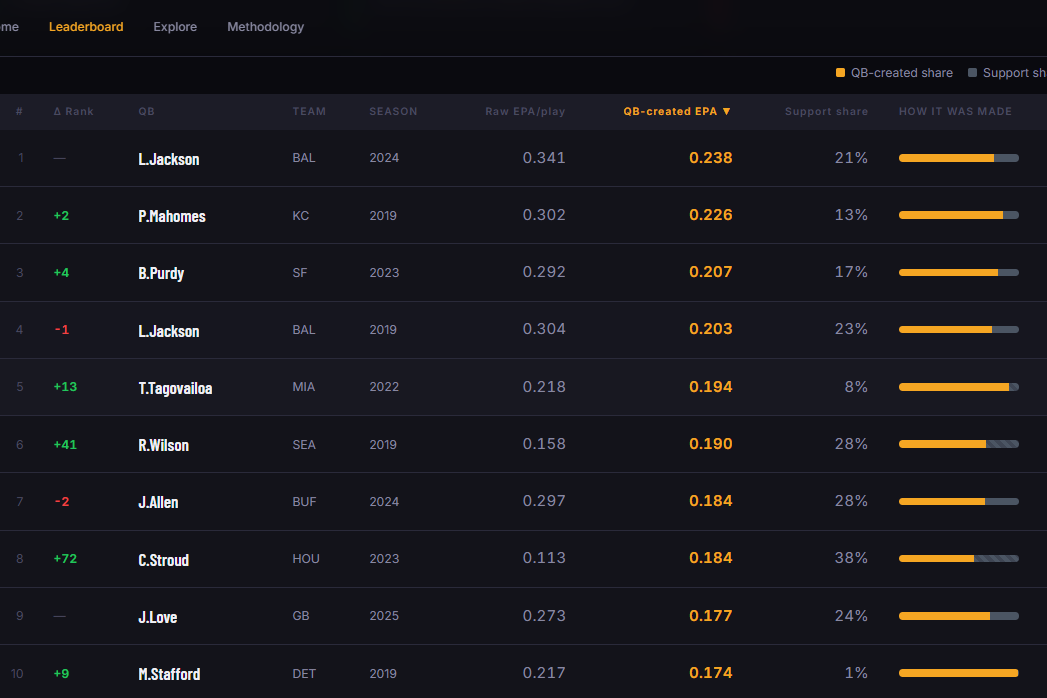
A leaderboard with side-by-side raw EPA and QB-created EPA rankings, filterable by season and division, with a "Players to Watch" callout that flags active QBs whose 2025 QB-created EPA is running ahead of their raw stats
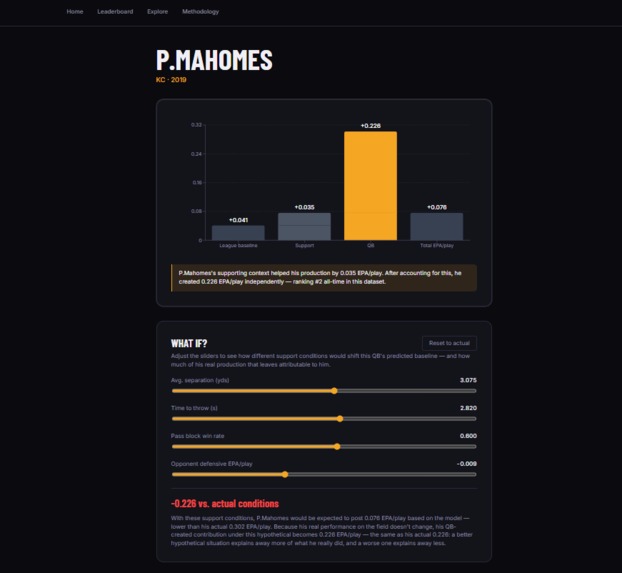
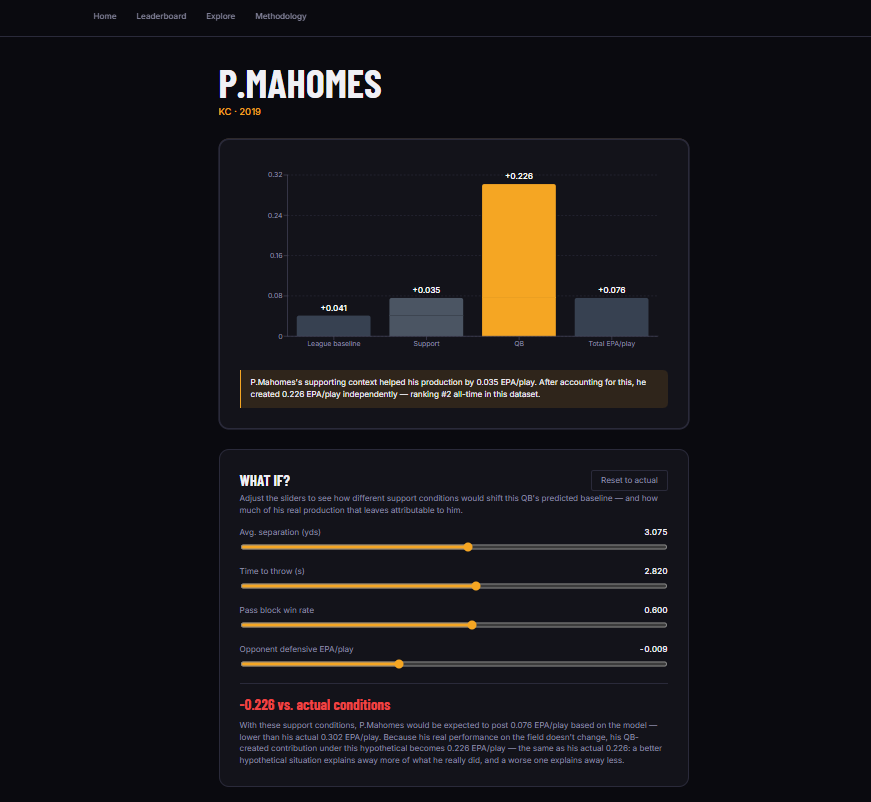
A waterfall chart showing how each quarterback's raw EPA breaks down into the three components A What If? simulator with interactive sliders to place a quarterback in any hypothetical support context and see in plain English how his attributable value changes
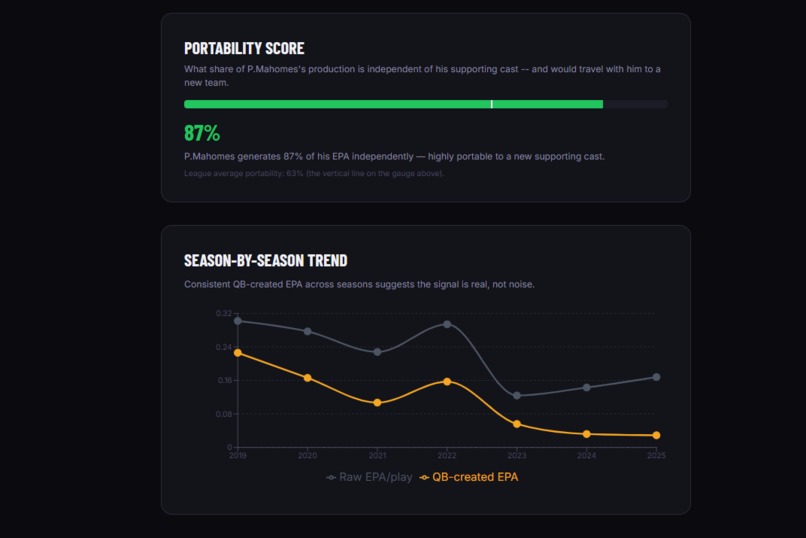
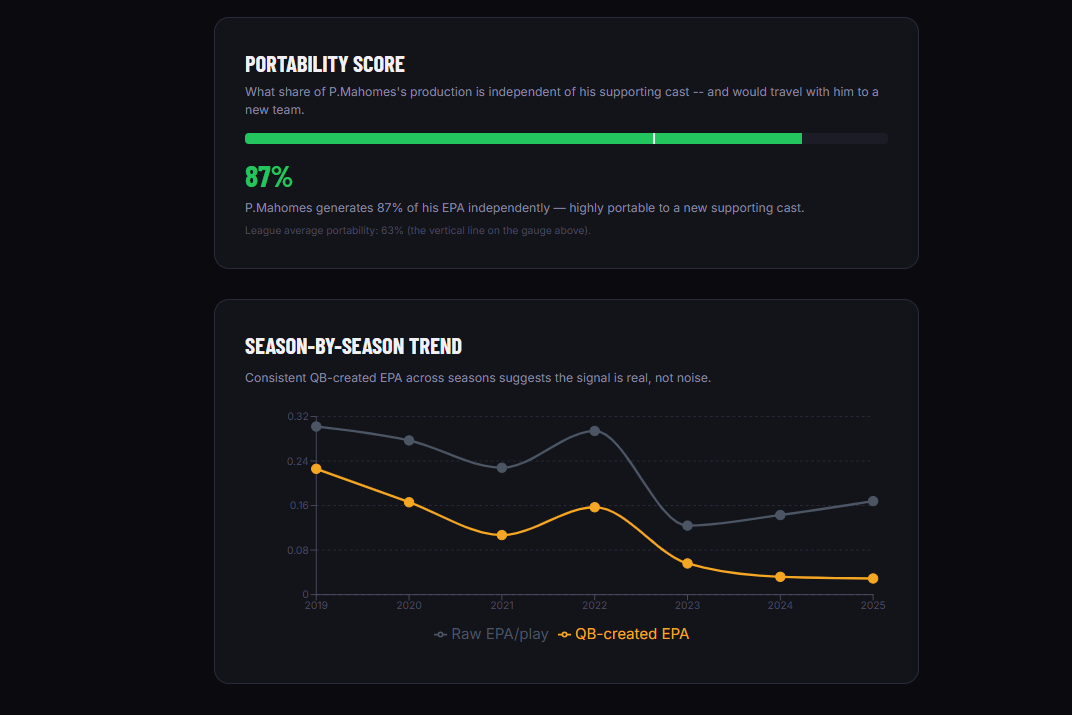
A Portability Score: a single metric that captures what fraction of a QB's production would travel with him to a new team
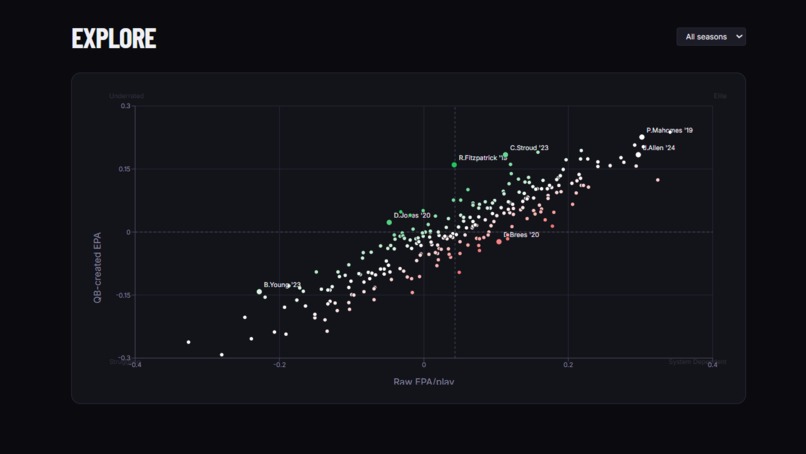
An Explore page with a raw-vs-created scatterplot (quadrant-labeled: Elite, Underrated, System-Dependent, Struggling) and a per-QB profile page with year-over-year trend charts Predictive validity charts that show how both metrics correlate across consecutive seasons
Everything runs from fully public data: nflverse play-by-play, NFL Next Gen Stats, and ESPN pass-block win rate.
How we built it
The analytical core is a deliberate two-step architecture.
Step 1 trains a gradient boosting model on play-by-play data to predict EPA from pure game-state features: down, distance, field position, score differential, win probability, time remaining, roof type, and weather. Crucially, no quarterback identity or support features enter Step 1. This gives us a situation-predicted EPA for every play. We average the residuals (actual EPA minus situation-predicted EPA) across a quarterback's season to produce a clean, situation-adjusted signal.
Step 2 takes those per-season residuals and regresses them via OLS against four support features: average receiver separation (NGS), time to throw (NGS), pass-block win rate (ESPN), and opponent defensive EPA (nflverse). The regression prediction represents the support contribution. The remaining unexplained value is interpreted as QB-created value.
One model-fit insight worth calling out: the Step 1 model's R² is below 0.4%. This is expected, not a flaw. nflverse EPA is already computed relative to a down-, distance-, and field-position-conditioned expected-points model, so game-state features have almost nothing left to explain in the residual. That is precisely the point. It confirms that Step 2 is operating on a clean, already situation-neutral signal.
The full stack consists of a FastAPI (Python) backend and a React + Vite frontend. The offline pipeline uses scikit-learn and XGBoost for the gradient boosting model. The live API requires no ML dependencies at inference time because it serves precomputed artifacts. The application is deployed on Render (API) and Vercel (frontend).
Challenges we ran into
The R² defense: Early in the project, the near-zero R² on Step 1 looked alarming. We spent significant time validating why it is correct rather than a sign that the model is broken. nflverse EPA is already situation-adjusted at the expected-points level, so game-state features genuinely have almost nothing left to explain. Confirming this analytically, and finding language to communicate it clearly without sounding defensive, proved more difficult than the modeling itself.
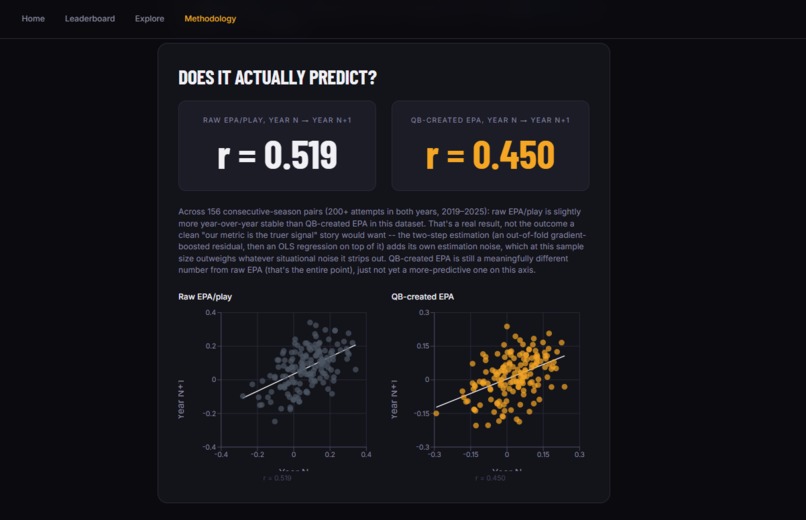
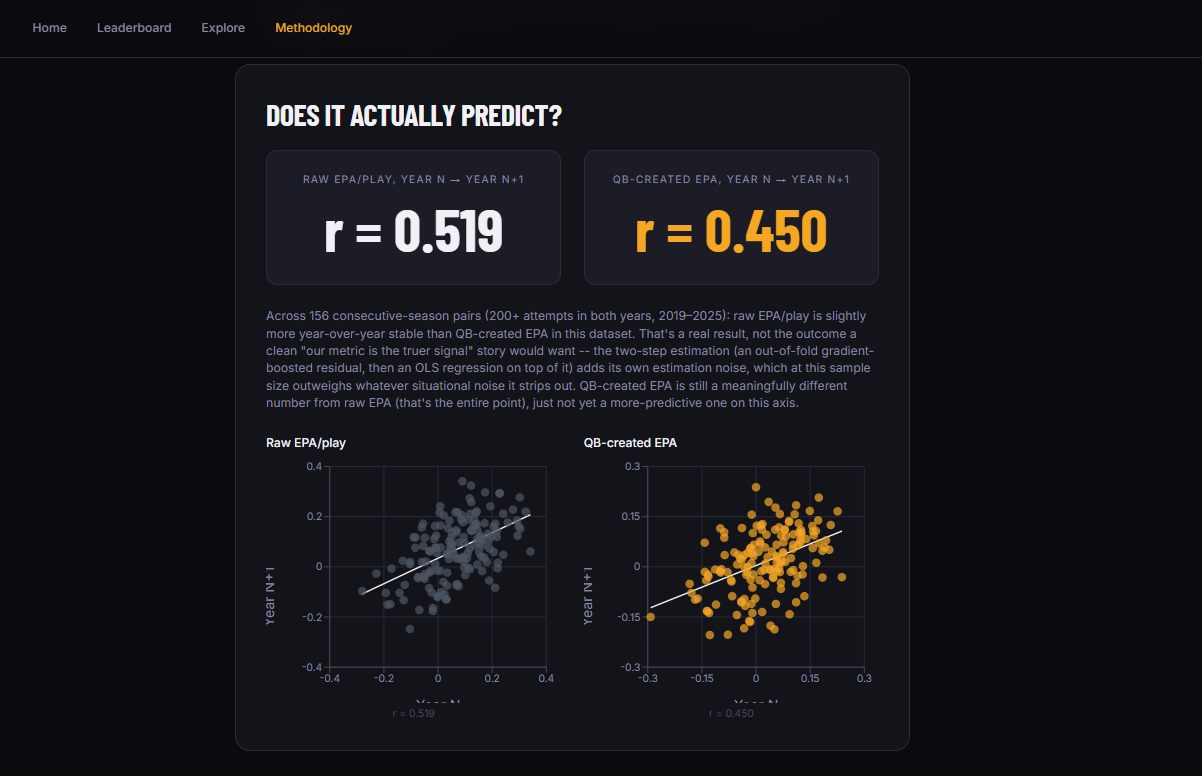
The honesty problem in year-over-year validation: When we ran predictive validity checks, we found that raw EPA/play is actually slightly more stable year over year (r = 0.519) than QB-created EPA (r = 0.45) across 156 consecutive-season pairs. A cleaner story would have hidden this result. We did not. The explanation is that two-step estimation introduces its own noise, which at this sample size can outweigh the situational noise it removes. This explanation is mechanistically sound, and reporting it honestly is the right approach for a metric that should be fully auditable.
Support data granularity: Average receiver separation from Next Gen Stats is a team-wide number rather than a quarterback-specific measure. This is a real limitation that introduces measurement error into the support component. We documented the issue, carried the caveat through the limitations section, and scoped the Portability Score accordingly. However, it remains an important constraint on what Step 2 can claim.
The Portability Score formula: Several approaches to a portability metric produced degenerate behavior in edge cases, such as quarterbacks with extremely high or low support scores or quarterbacks in their first season. We ultimately implemented a magnitude-based ratio formula that behaves sensibly across the full range of inputs and remains interpretable to non-technical users.
Accomplishments that we're proud of
The CJ Stroud finding is real, reproducible, and striking: In 2023, he ranked 80th by raw EPA but 8th by QB-created EPA. His rookie season was historically underrated by traditional efficiency metrics because it occurred within a modest supporting environment. We did not set out to find CJ Stroud. The model surfaced him organically.
The additive identity holds exactly: For every quarterback in every season, Baseline + Support + QB-Created = Raw EPA/play. This relationship holds exactly, not approximately. Maintaining that accounting identity required rigorous consistency throughout the modeling pipeline and gives the output a level of transparency that many adjusted metrics lack.
Full reproducibility from public data: Anyone can clone the repository, run the offline pipeline, and reproduce the same results. No proprietary grades, no closed charting databases, and no black-box scores are required. The project is explicitly positioned as an open-source alternative to proprietary quarterback evaluation systems.
A live, deployed, end-to-end product. This is not a notebook or a Streamlit proof of concept. The project includes a React frontend, a FastAPI backend, and a fully deployed cloud architecture on Vercel and Render. The application is accessible to anyone with a web browser.
What we learned
Building this project forced us to confront something the analytics community often glosses over: making a metric auditable is harder than making it accurate. It is easy to produce a number that looks good on a leaderboard. It is much harder to build one where every input, coefficient, and formula is inspectable by anyone who wants to verify the work.
We also learned that defensive analytics communication is a skill. The project's two most defensible findings, the near-zero Step 1 R² and the year-over-year stability result, both initially resemble failure at first glance. Translating "this result is correct and here is why" into language that lands for a non-technical audience without sounding condescending required more iteration than tuning any model hyperparameter.
Finally, the What If? simulator changed how we think about the metric. Once we could place a quarterback in any support context and observe how the decomposition shifts, patterns emerged that are not visible in static leaderboards. The interactive layer is not a presentation afterthought. It is the mechanism through which the analytical insight becomes actionable.
What's next for QB True Value
More seasons, more positions: Extending the pipeline to pre-2019 seasons and eventually adapting the decomposition framework to receivers for target quality adjustment, running backs for blocking quality, and pass rushers for opponent quality would turn QB True Value into the foundation of a full-team contextual decomposition suite.
Tracking data integration: The biggest limitation in Step 2 is that support features are team-level proxies rather than play-level measurements. NFL Big Data Bowl tracking data would allow pressure proximity, route spacing, and pocket geometry to be incorporated at the play level, significantly improving the fidelity of the support component.
Better uncertainty quantification: The current model produces point estimates. Bootstrap confidence intervals on QB-created EPA would allow the leaderboard to communicate how much of each ranking difference is signal versus estimation noise, especially for quarterbacks with smaller sample sizes.
Team-building simulator: Using the Portability Score as input to a cap-constrained roster optimizer, asking which quarterback acquisition yields the most QB-created EPA per cap dollar, would close the loop from a pure evaluation metric to an actionable front office tool.
Built With
- css3
- espn
- fastapi
- html5
- javascript
- nfl-next-gen-stats-data
- nflverse
- numpy
- pandas
- python
- react
- render
- scikit-learn
- vercel
- vite
- xgboost


Log in or sign up for Devpost to join the conversation.