-
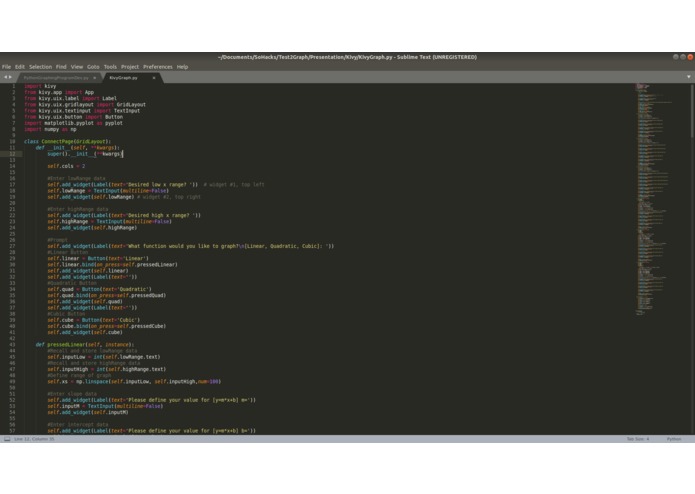
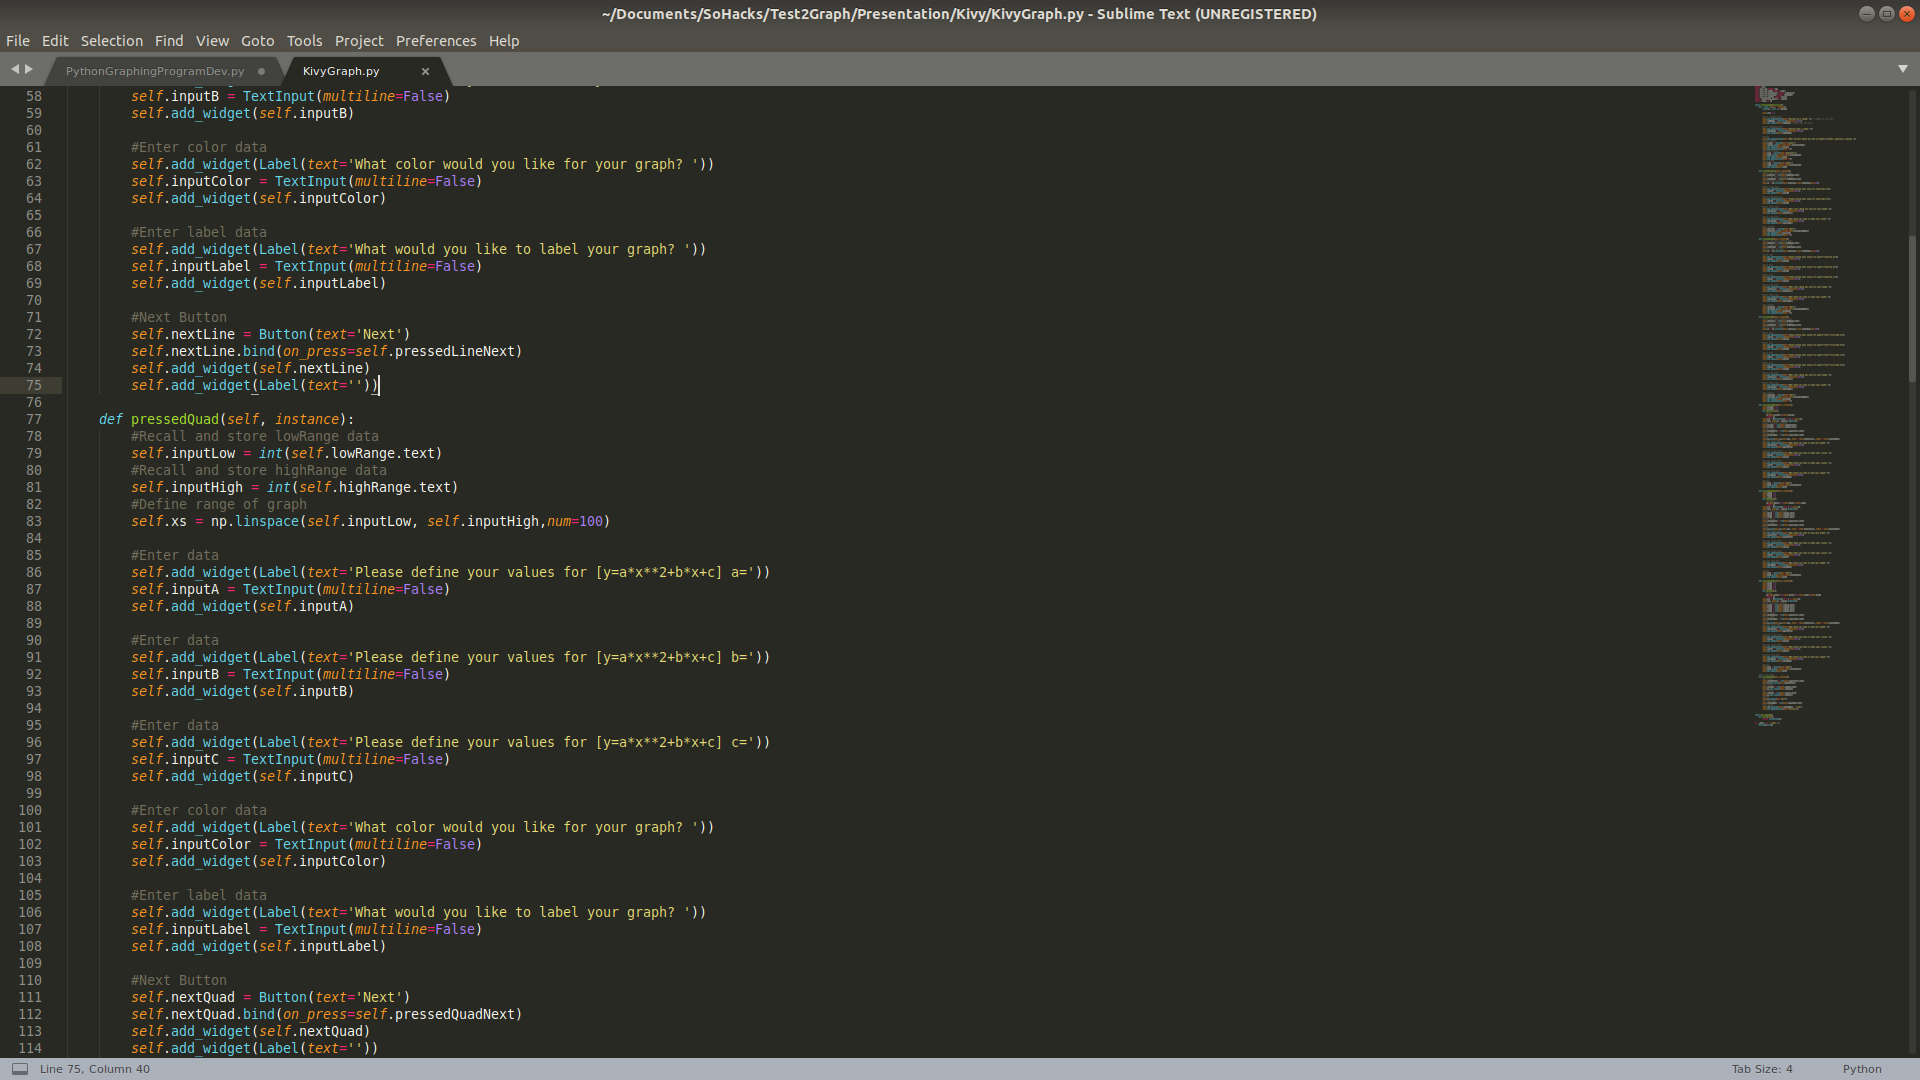
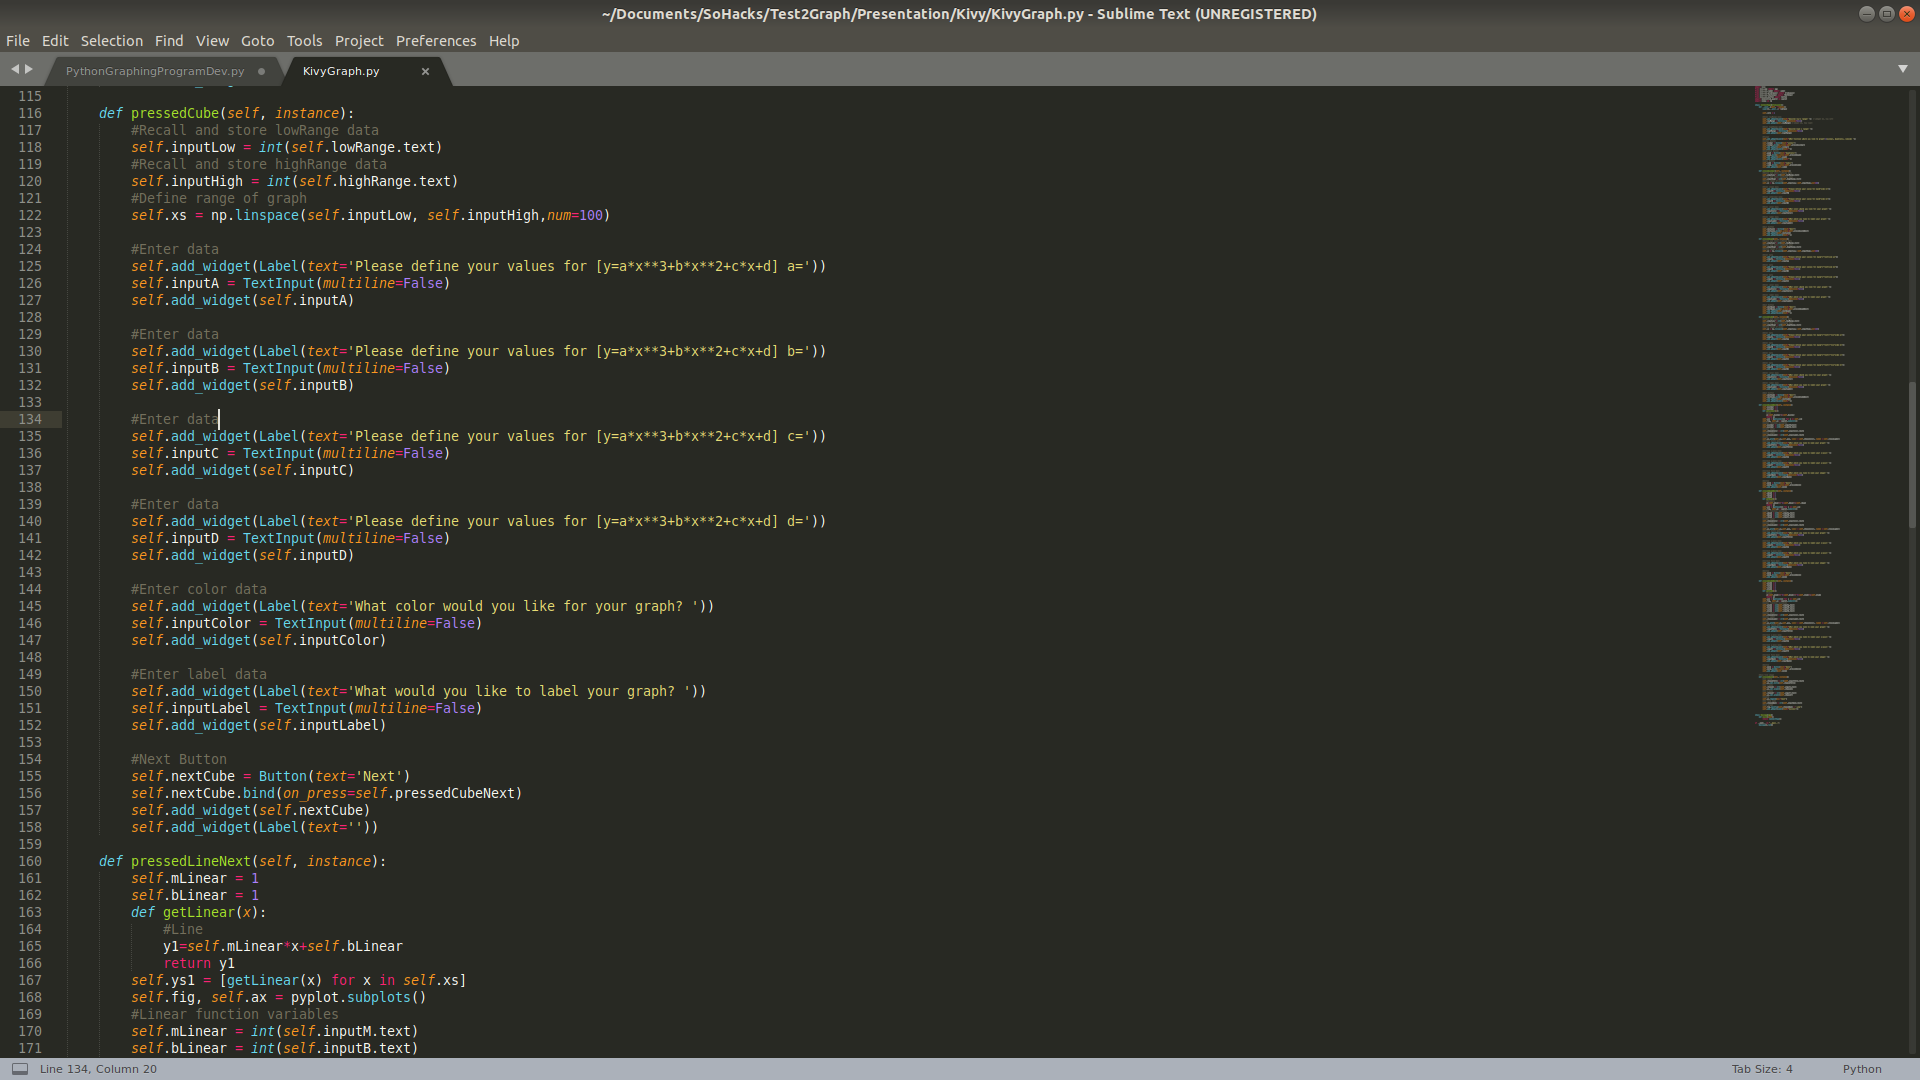
Kivy Python Code
-
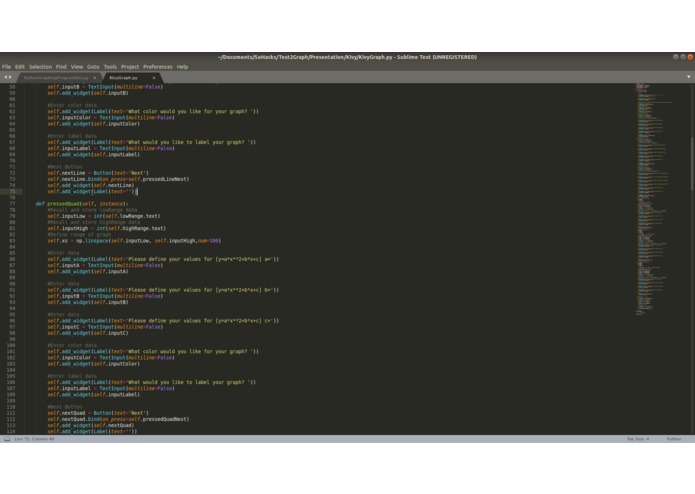
Kivy Python Code
-
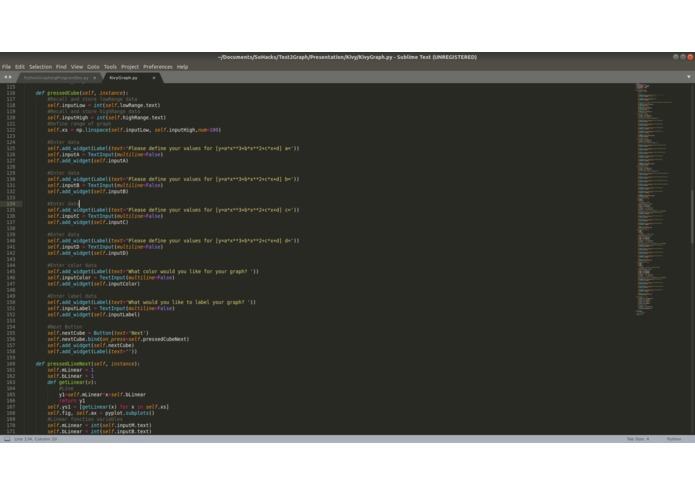
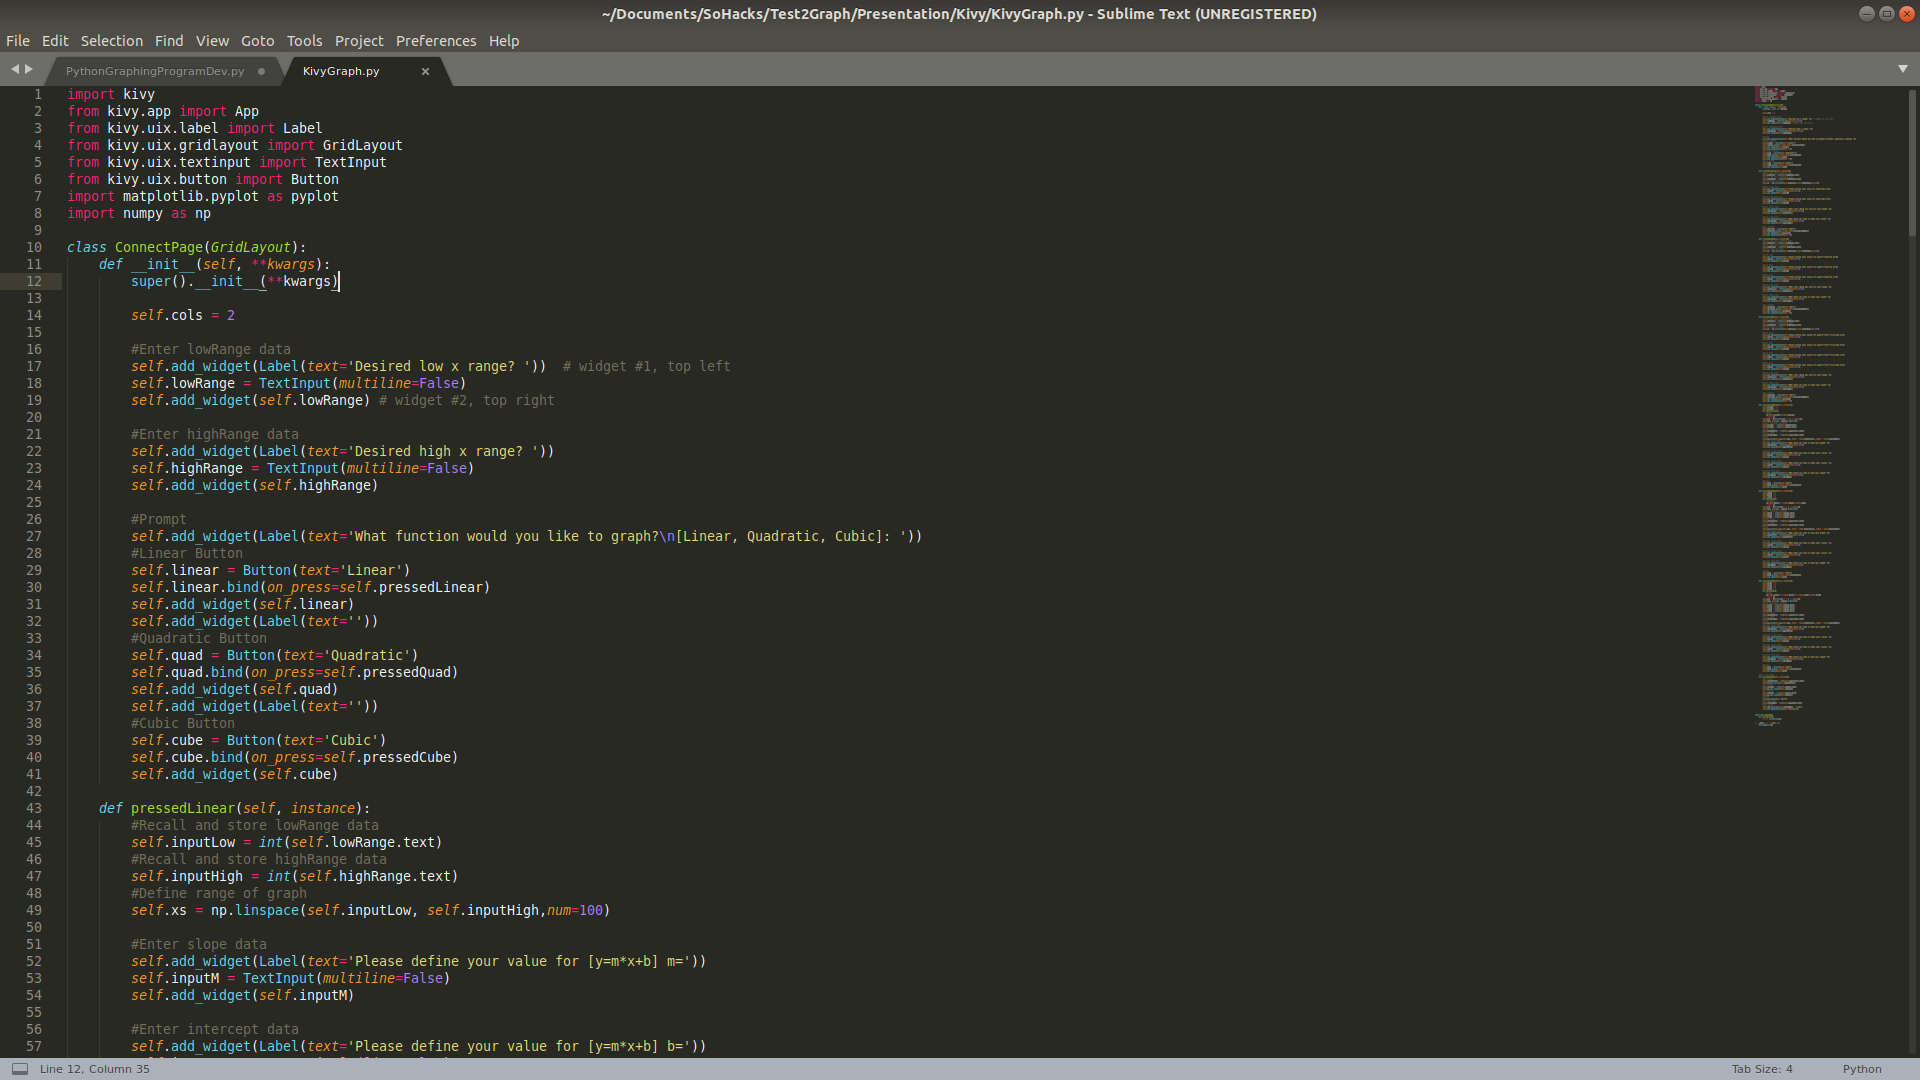
Kivy Python Code
-
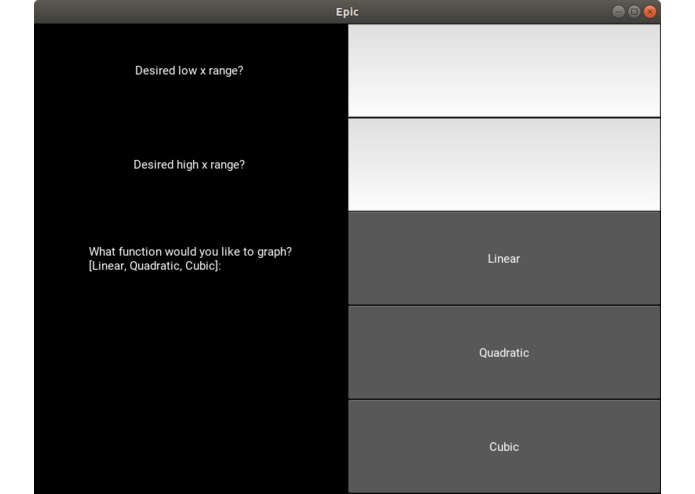
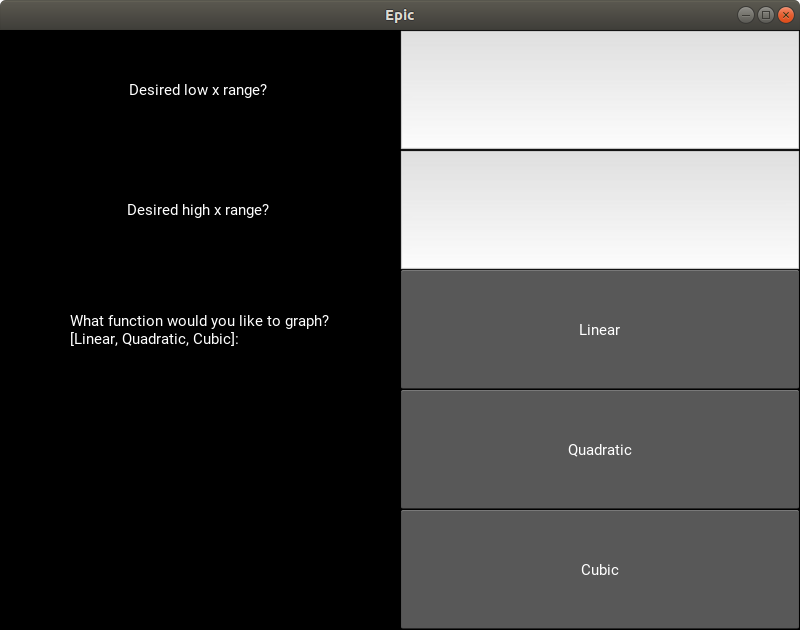
Python user interface with Kivy
-
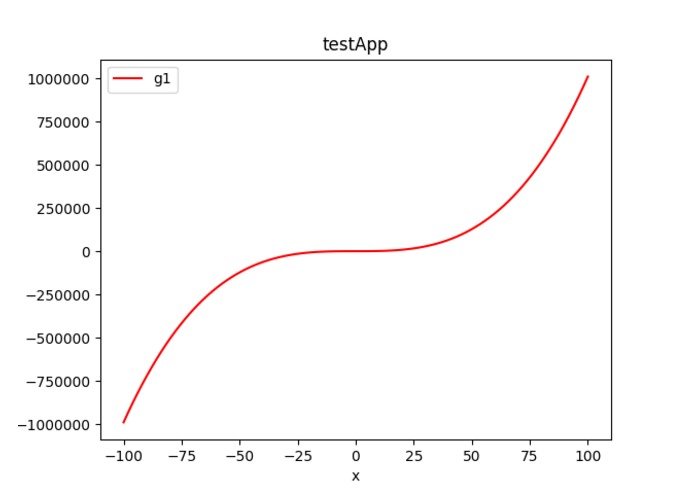
Example output of program
-
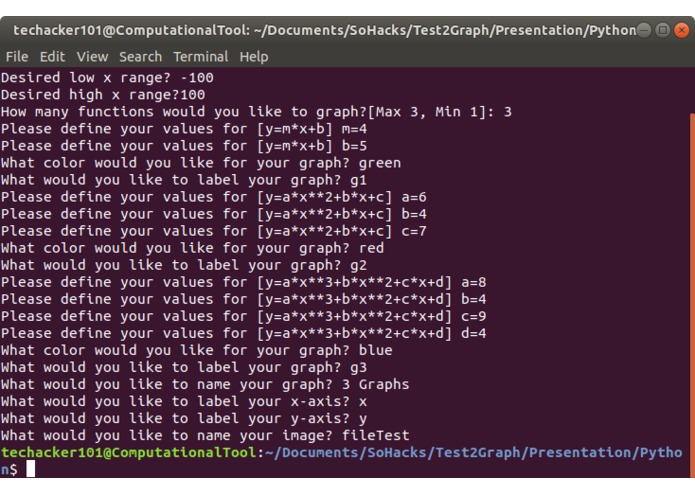
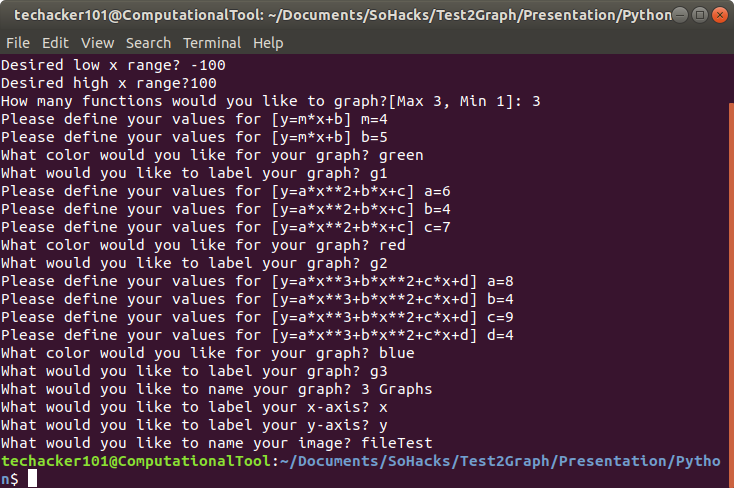
Command line execution of python code
-
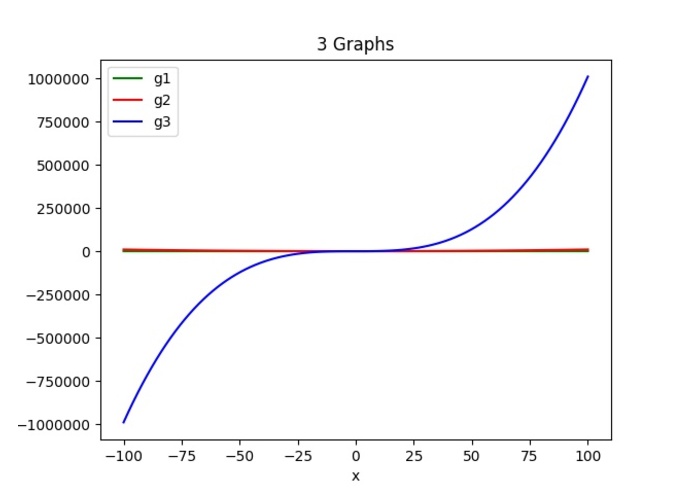
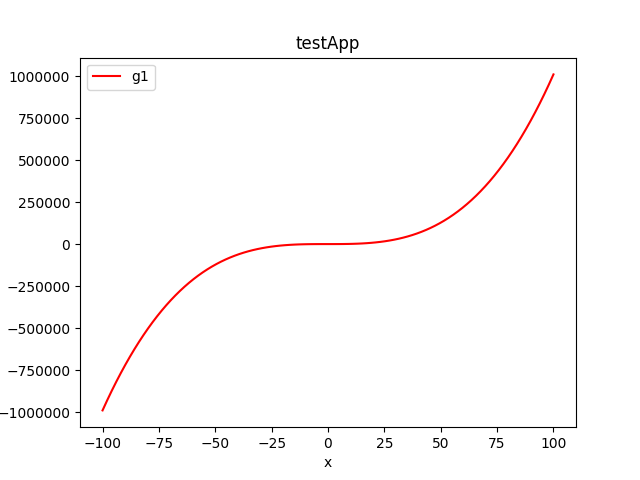
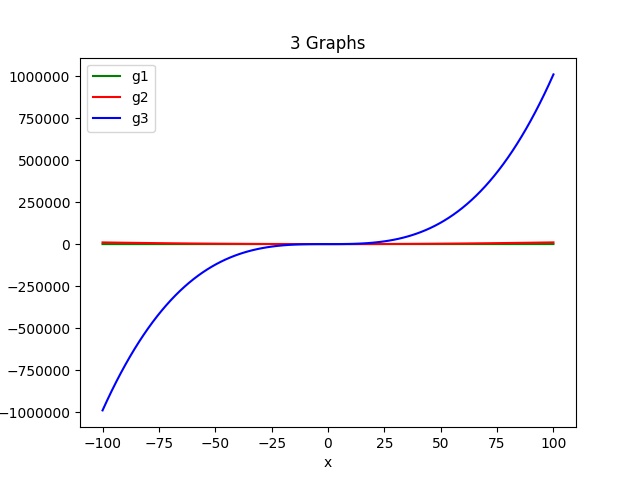
3 Graphs output
Inspiration
I was inspired to pursue this idea after a python workshop. The instructor walked me through the use of numpy and pyplot in making graphs with Python. I then realized I could use other libraries to allow the user to have a more modern experience instead of a command line interface.
What it does
The PyVy Super Graphics program uses python with the Kivy library to make a GUI for data input. The program requests data that is then evaluated and saved to a file image.
How I built it
I got the foundation from a previous plain python script that utilized numpy and pyplot to get functions and values. With the Kivy version, I used that respective library to create a UI that made the process more modern through the use of Kivy's UI components.
Challenges I ran into
I had the logic of the program down, it was just that I did not have the correct placement for calling certain variables. As a result, for various attempts, the program would crash due to the lack of input. In addition, the "buildozer" packaging software did not properly build and execute the .apk file on the android phone.
Accomplishments that I'm proud of
I am proud of the successful integration of an existing python file and kivy library. In addition, I was able to launch the application natively in android and run successfully.
What I learned
I learned more about how syntax works within Python and how to use functions to create a more complex code.
What's next for PyVy Super Graphics
The next step is to deploy the application to iOS and polish the UI. Another goal would be to allow the user to customize their graphs through more complex functions.

Log in or sign up for Devpost to join the conversation.