Inspiration
Firefighters entering unfamiliar buildings have to make critical decisions. This necessitates situational awareness, but enter smoke, heat, darkness, and changing airflow, and it becomes difficult to understand both the structure and how hazardous gases are distributed inside it. Many dangerous gases (VOCs) are invisible and cannot be reliably detected by humans without sensors.
Existing gas monitors are essential, but they still rely heavily on manual sampling. Firefighters may need to take readings at multiple locations because concentration can change with airflow, ventilation, vapor density, and sensor response time. These readings are collected at different places and times and thrown away rather than forming one continuous view.
As a result, individual measurements may only be seen by the firefighter carrying the monitor or relayed verbally to command. This makes it difficult for the whole team to maintain a unified understanding of where hazards are concentrated, how conditions are changing, and which areas remain unmeasured.
GPS is also unreliable indoors, and building plans may be missing, outdated, or incomplete.
What it does
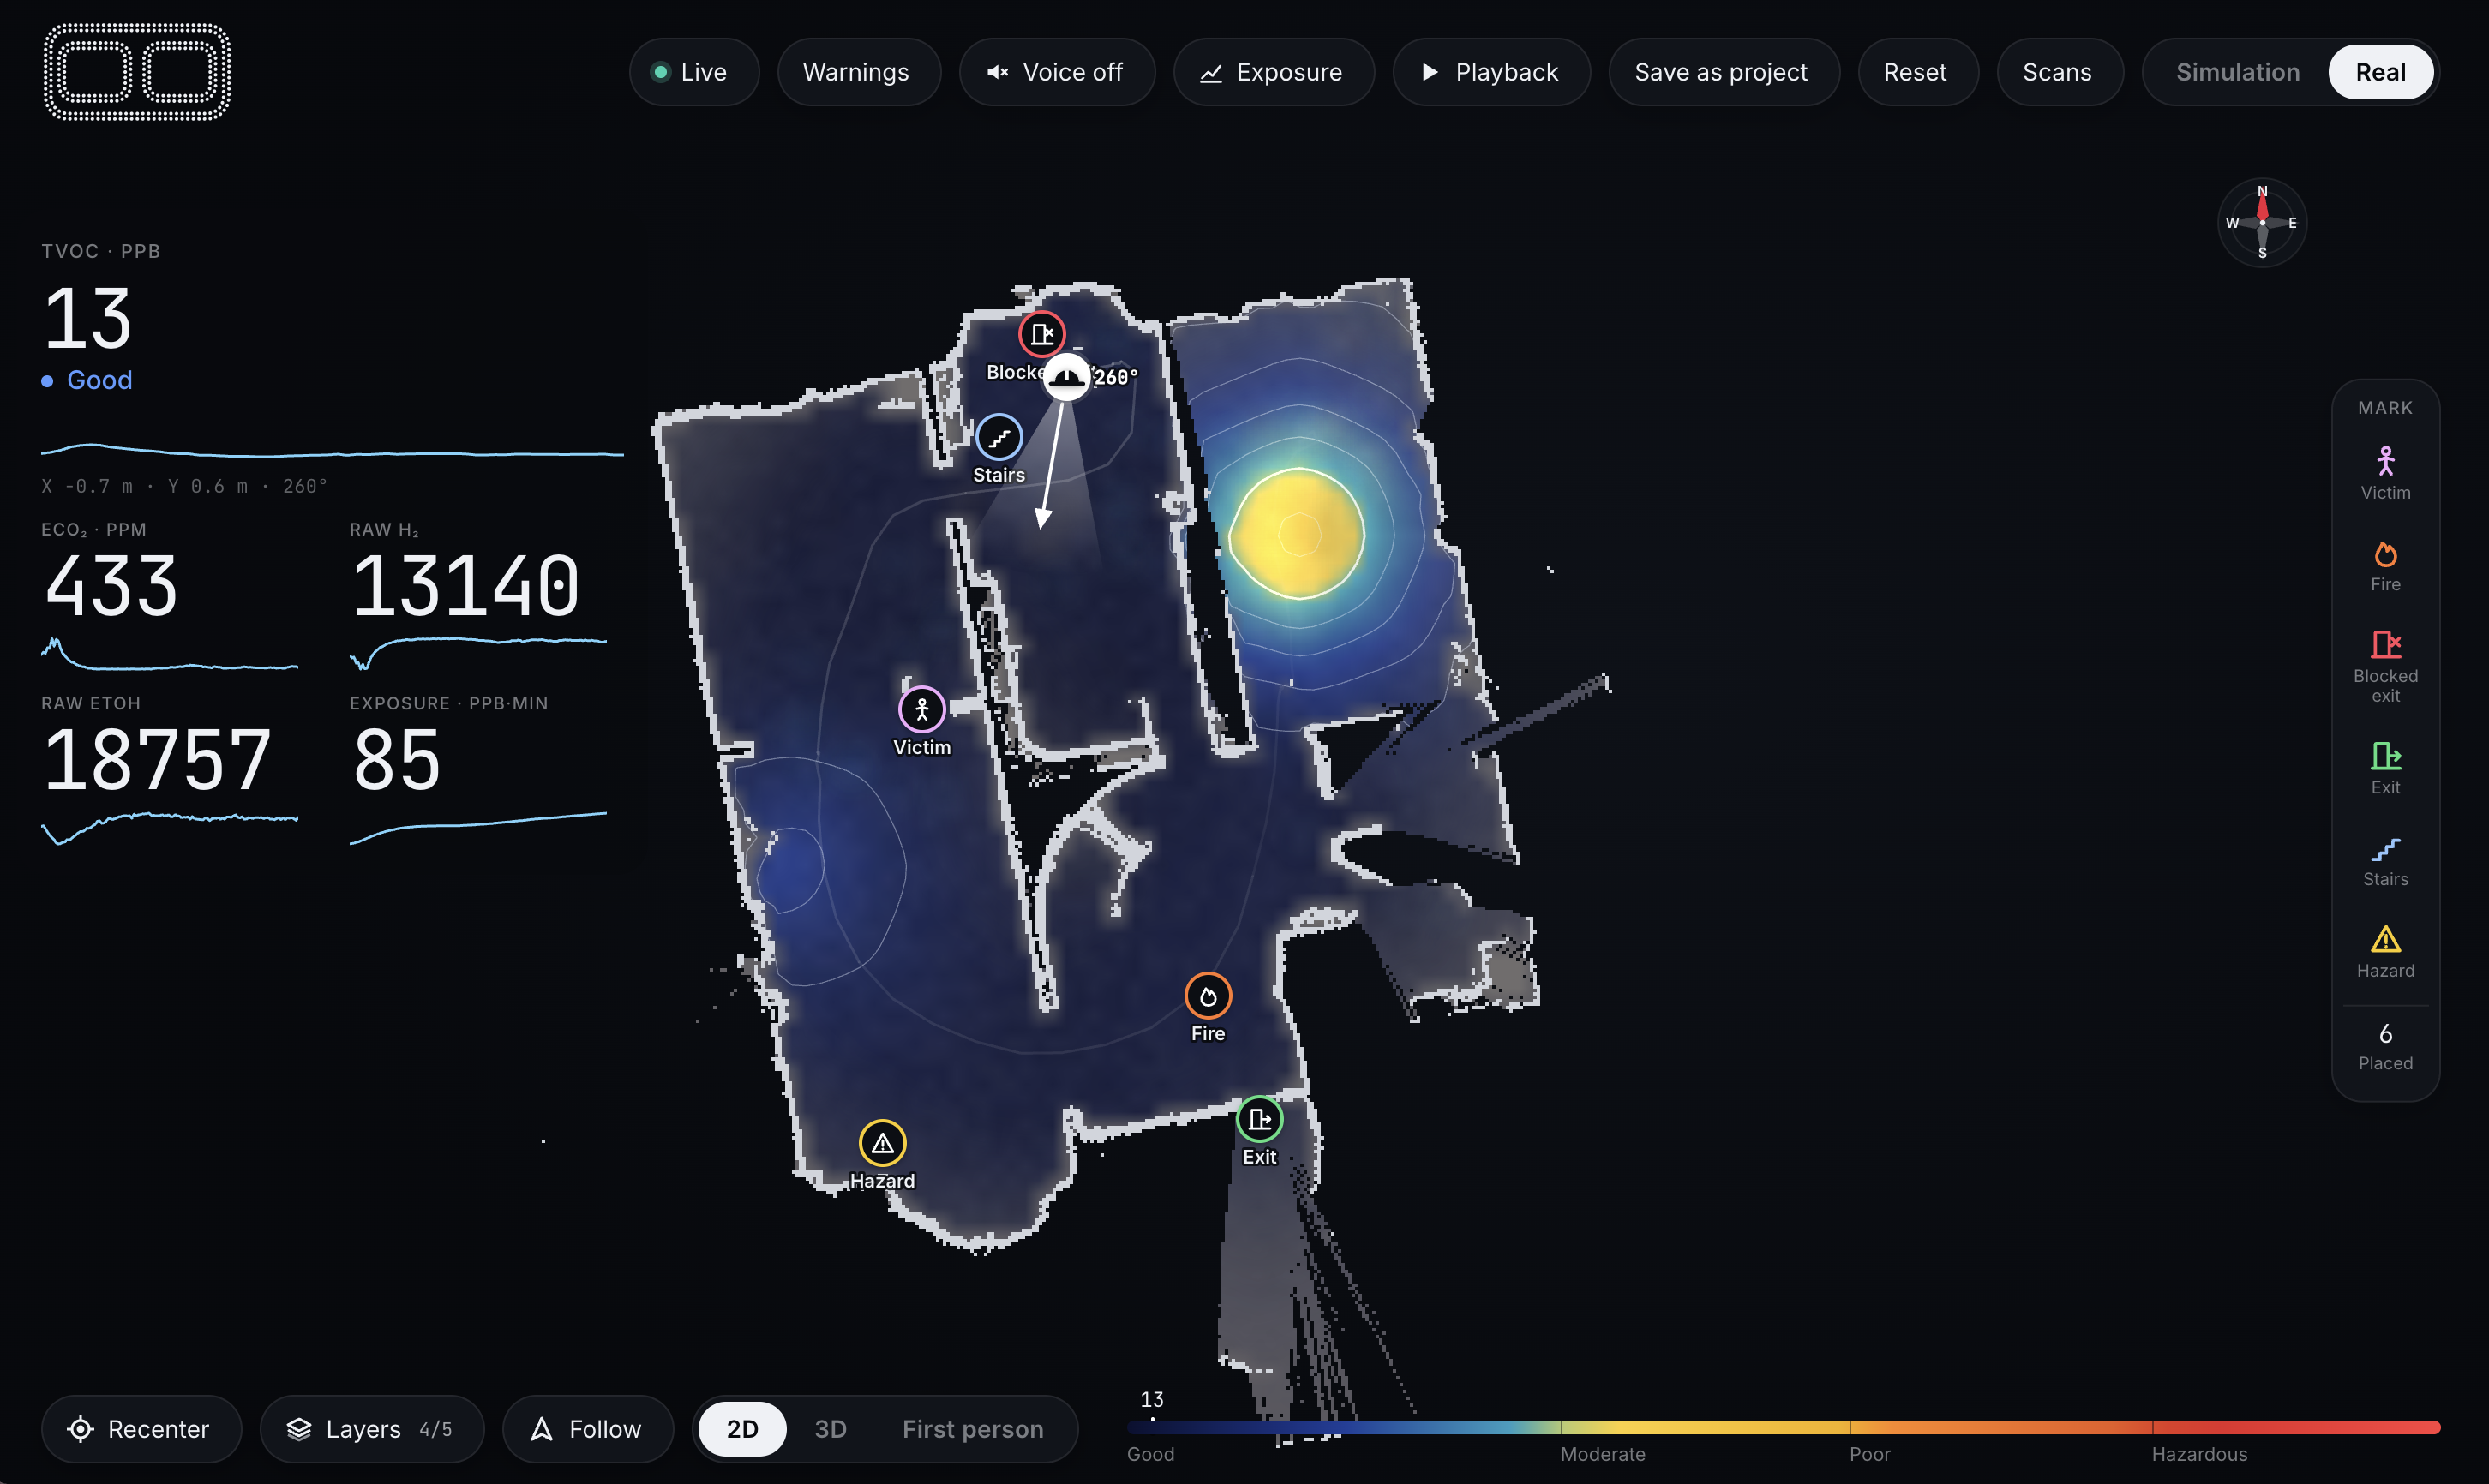
Our system creates one live spatial view of hazards (past, present, and predicted future) inside an unfamiliar building. The view maps indoor layout, firefighter locations, and gas concentrations.
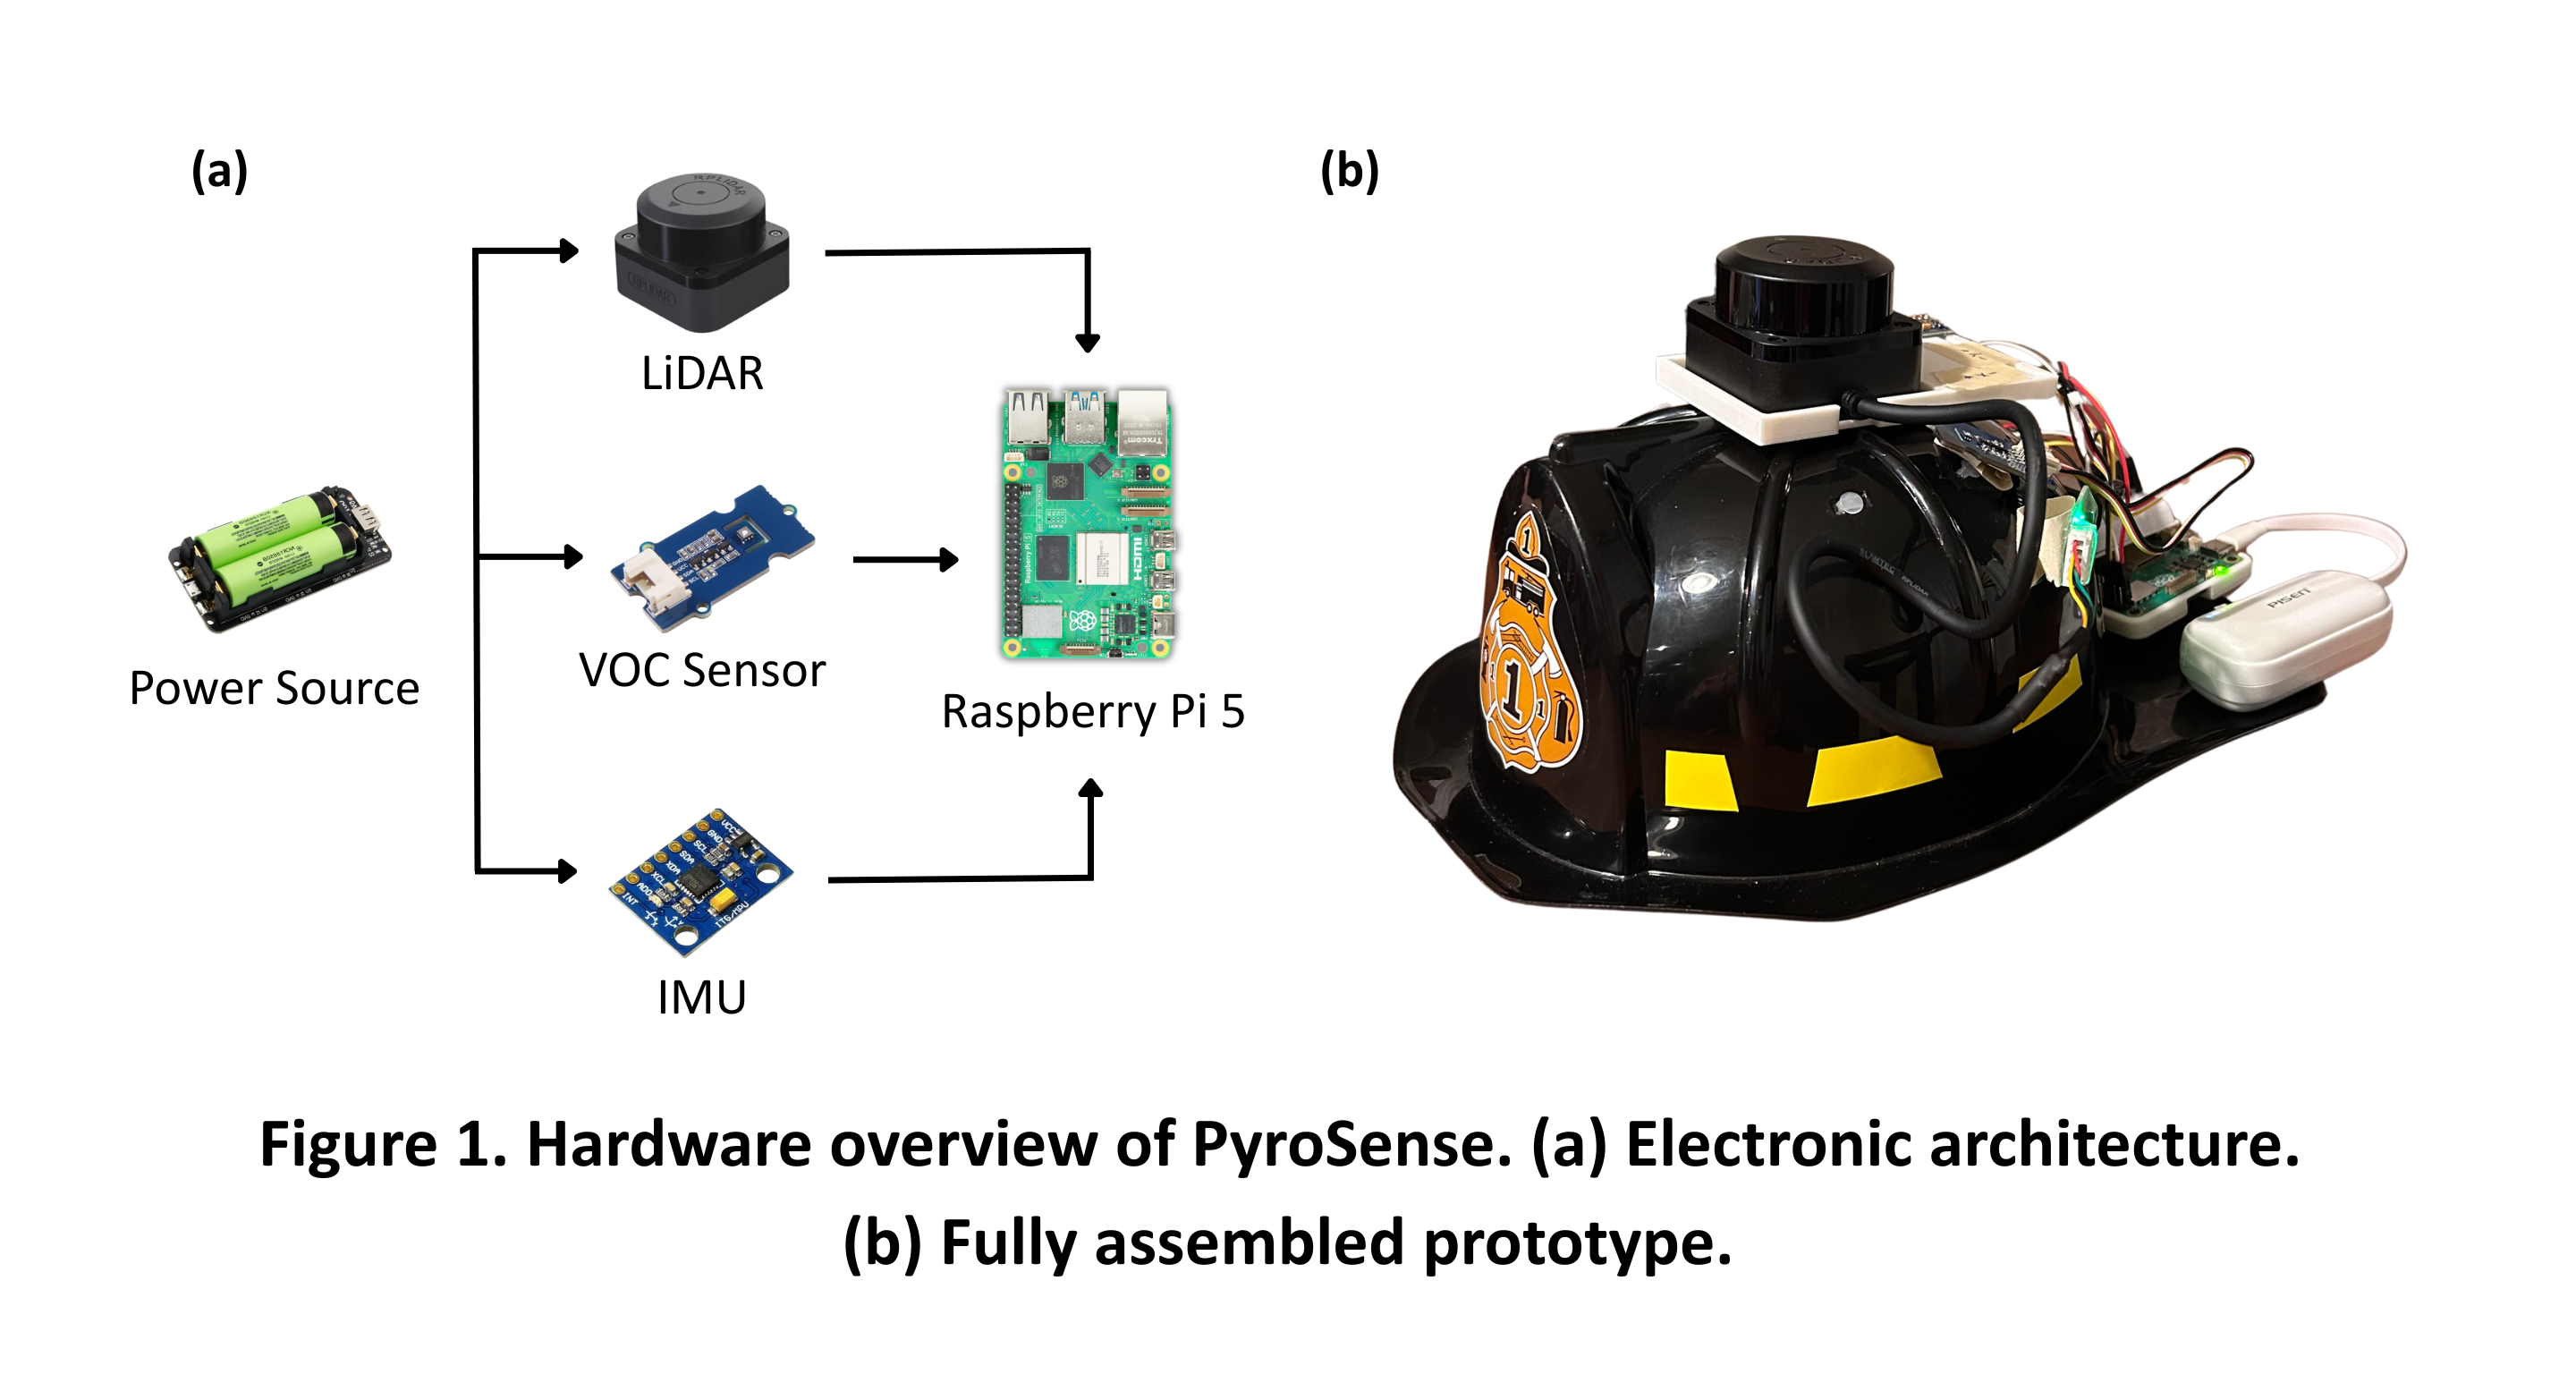
It starts with the firefighter’s helmet. A compact sensing unit is mounted on the helmet. As it moves with them through the structure, it generates a structural map, tracks their position, and links gas readings to where they were collected.
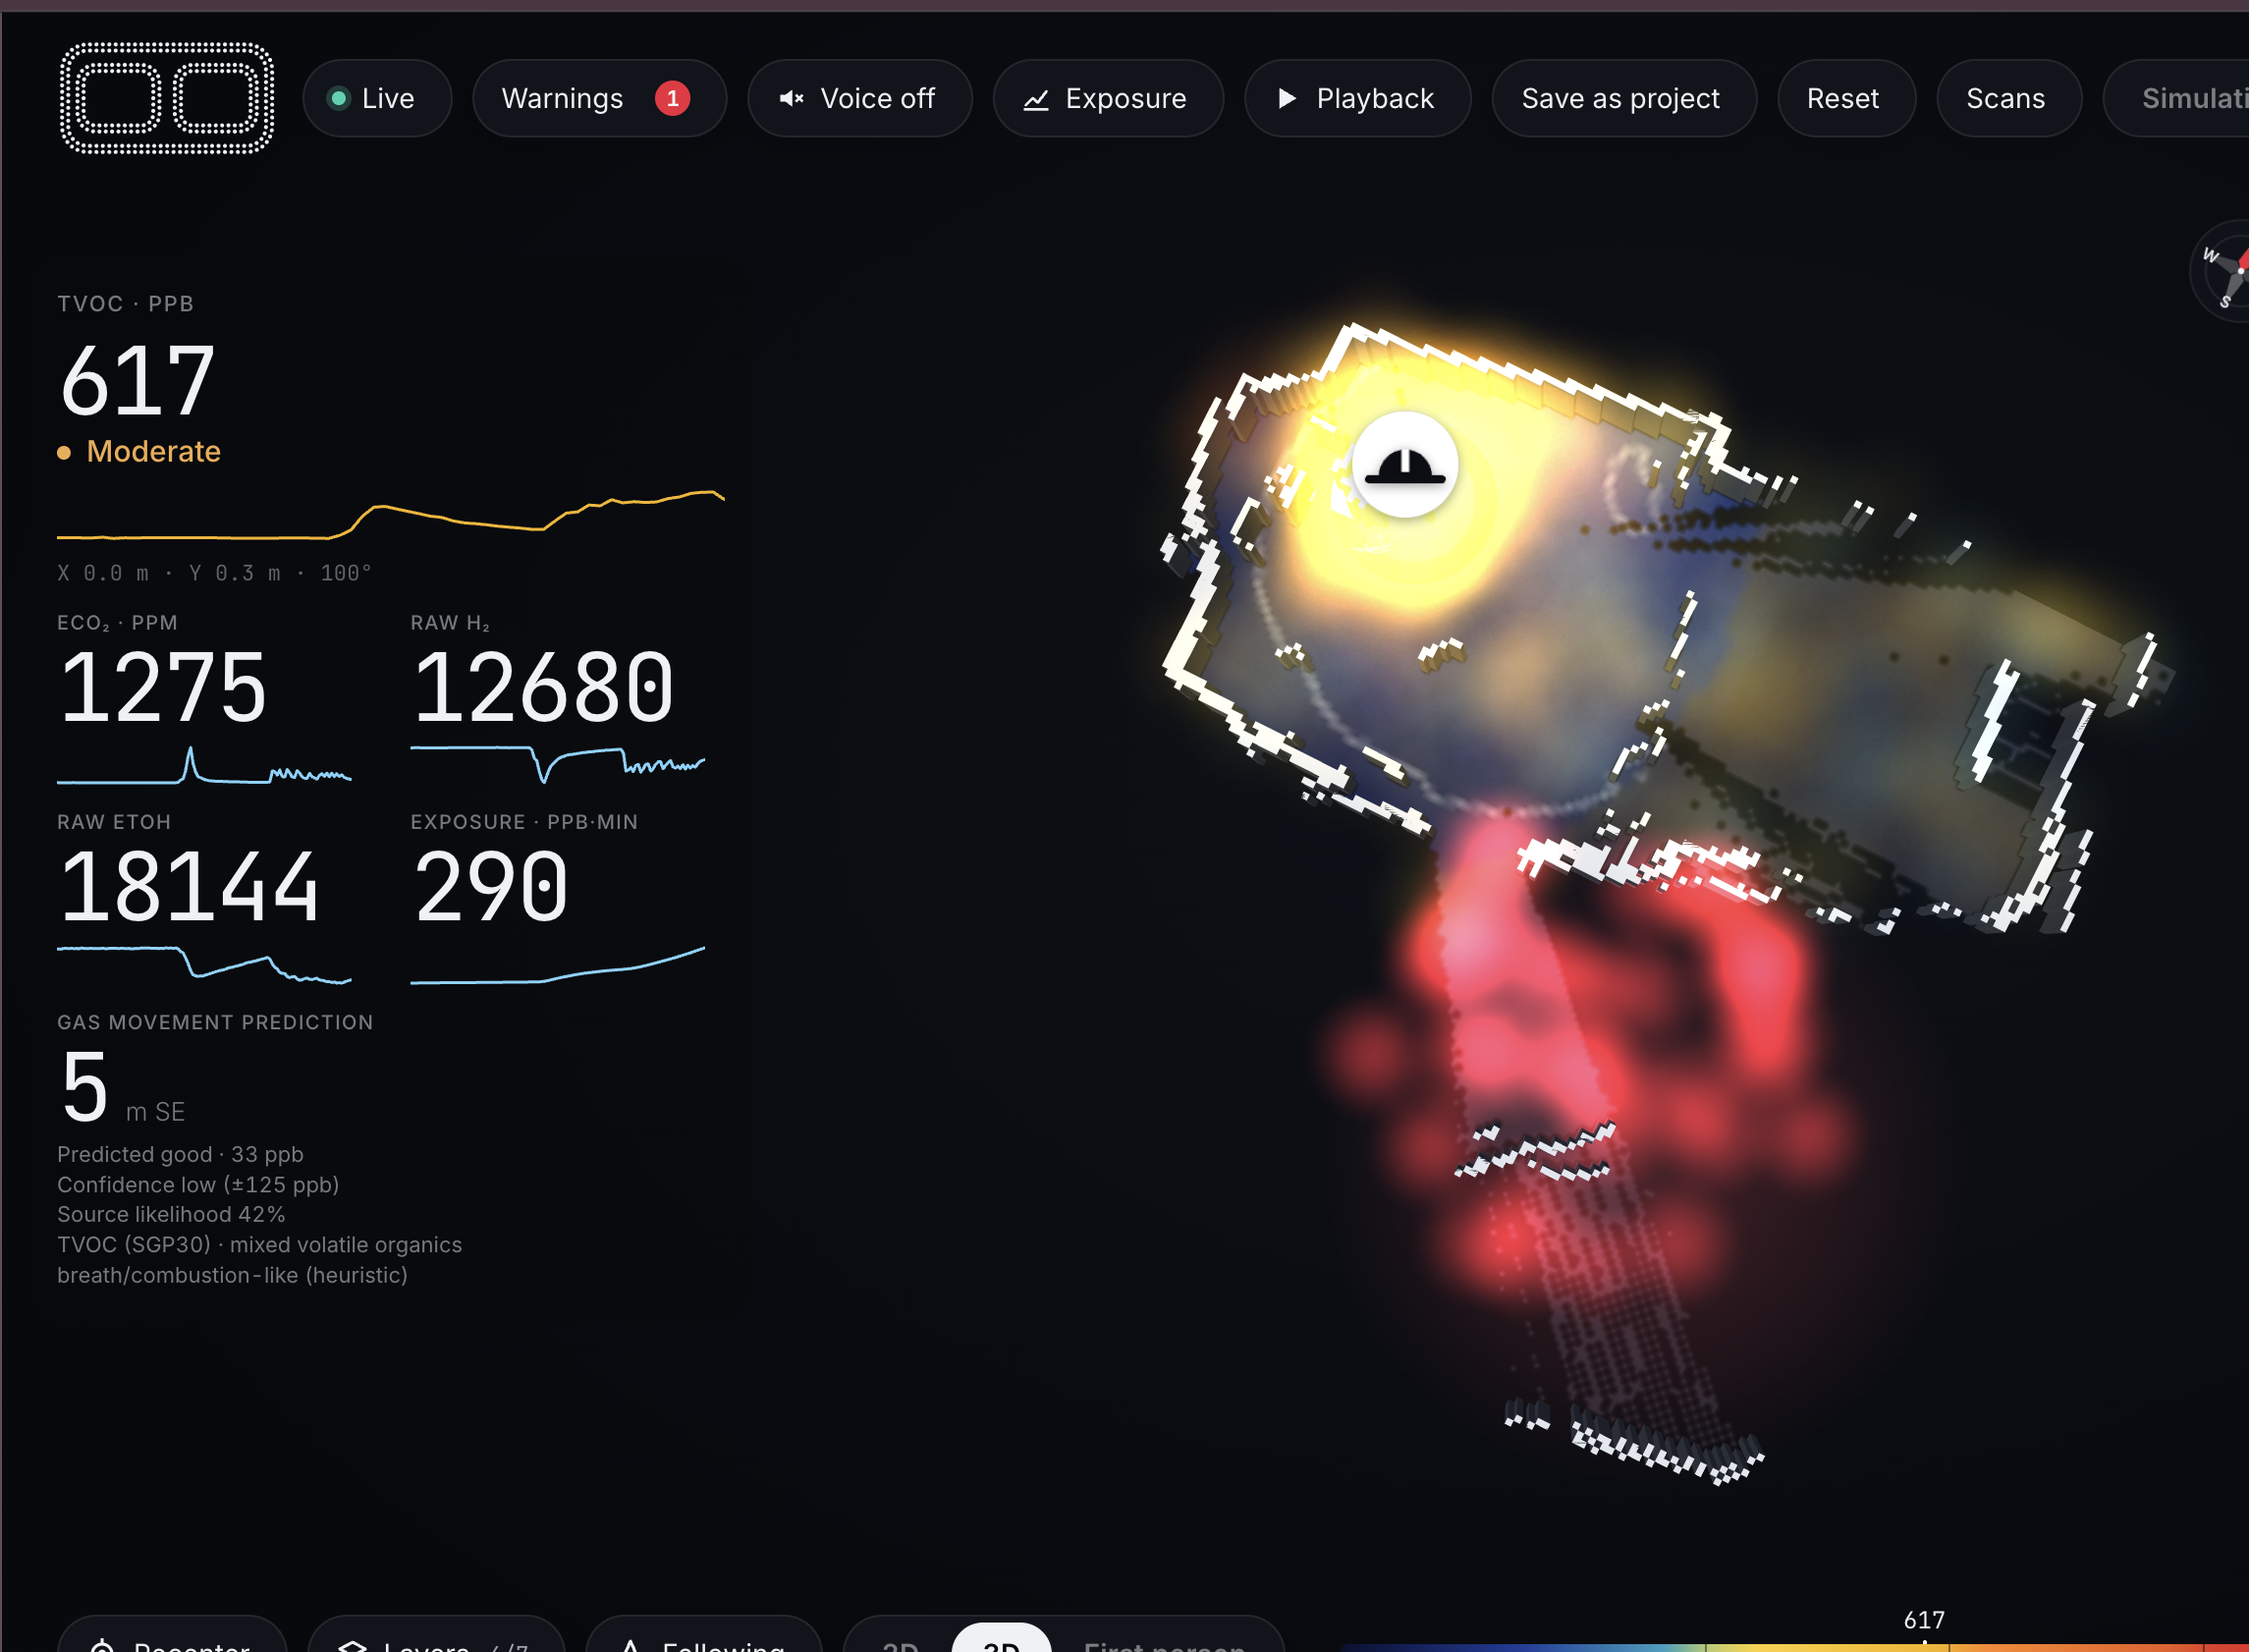
These readings form a live gas concentration heat map that highlights hazardous areas, shows changing conditions, and identifies unsampled regions, displayed onto the dashboard for the incident commander or chief on site. The system also visually and audibly alerts firefighters to dangerous conditions such as rapidly rising gas levels or entry into high hazard areas.
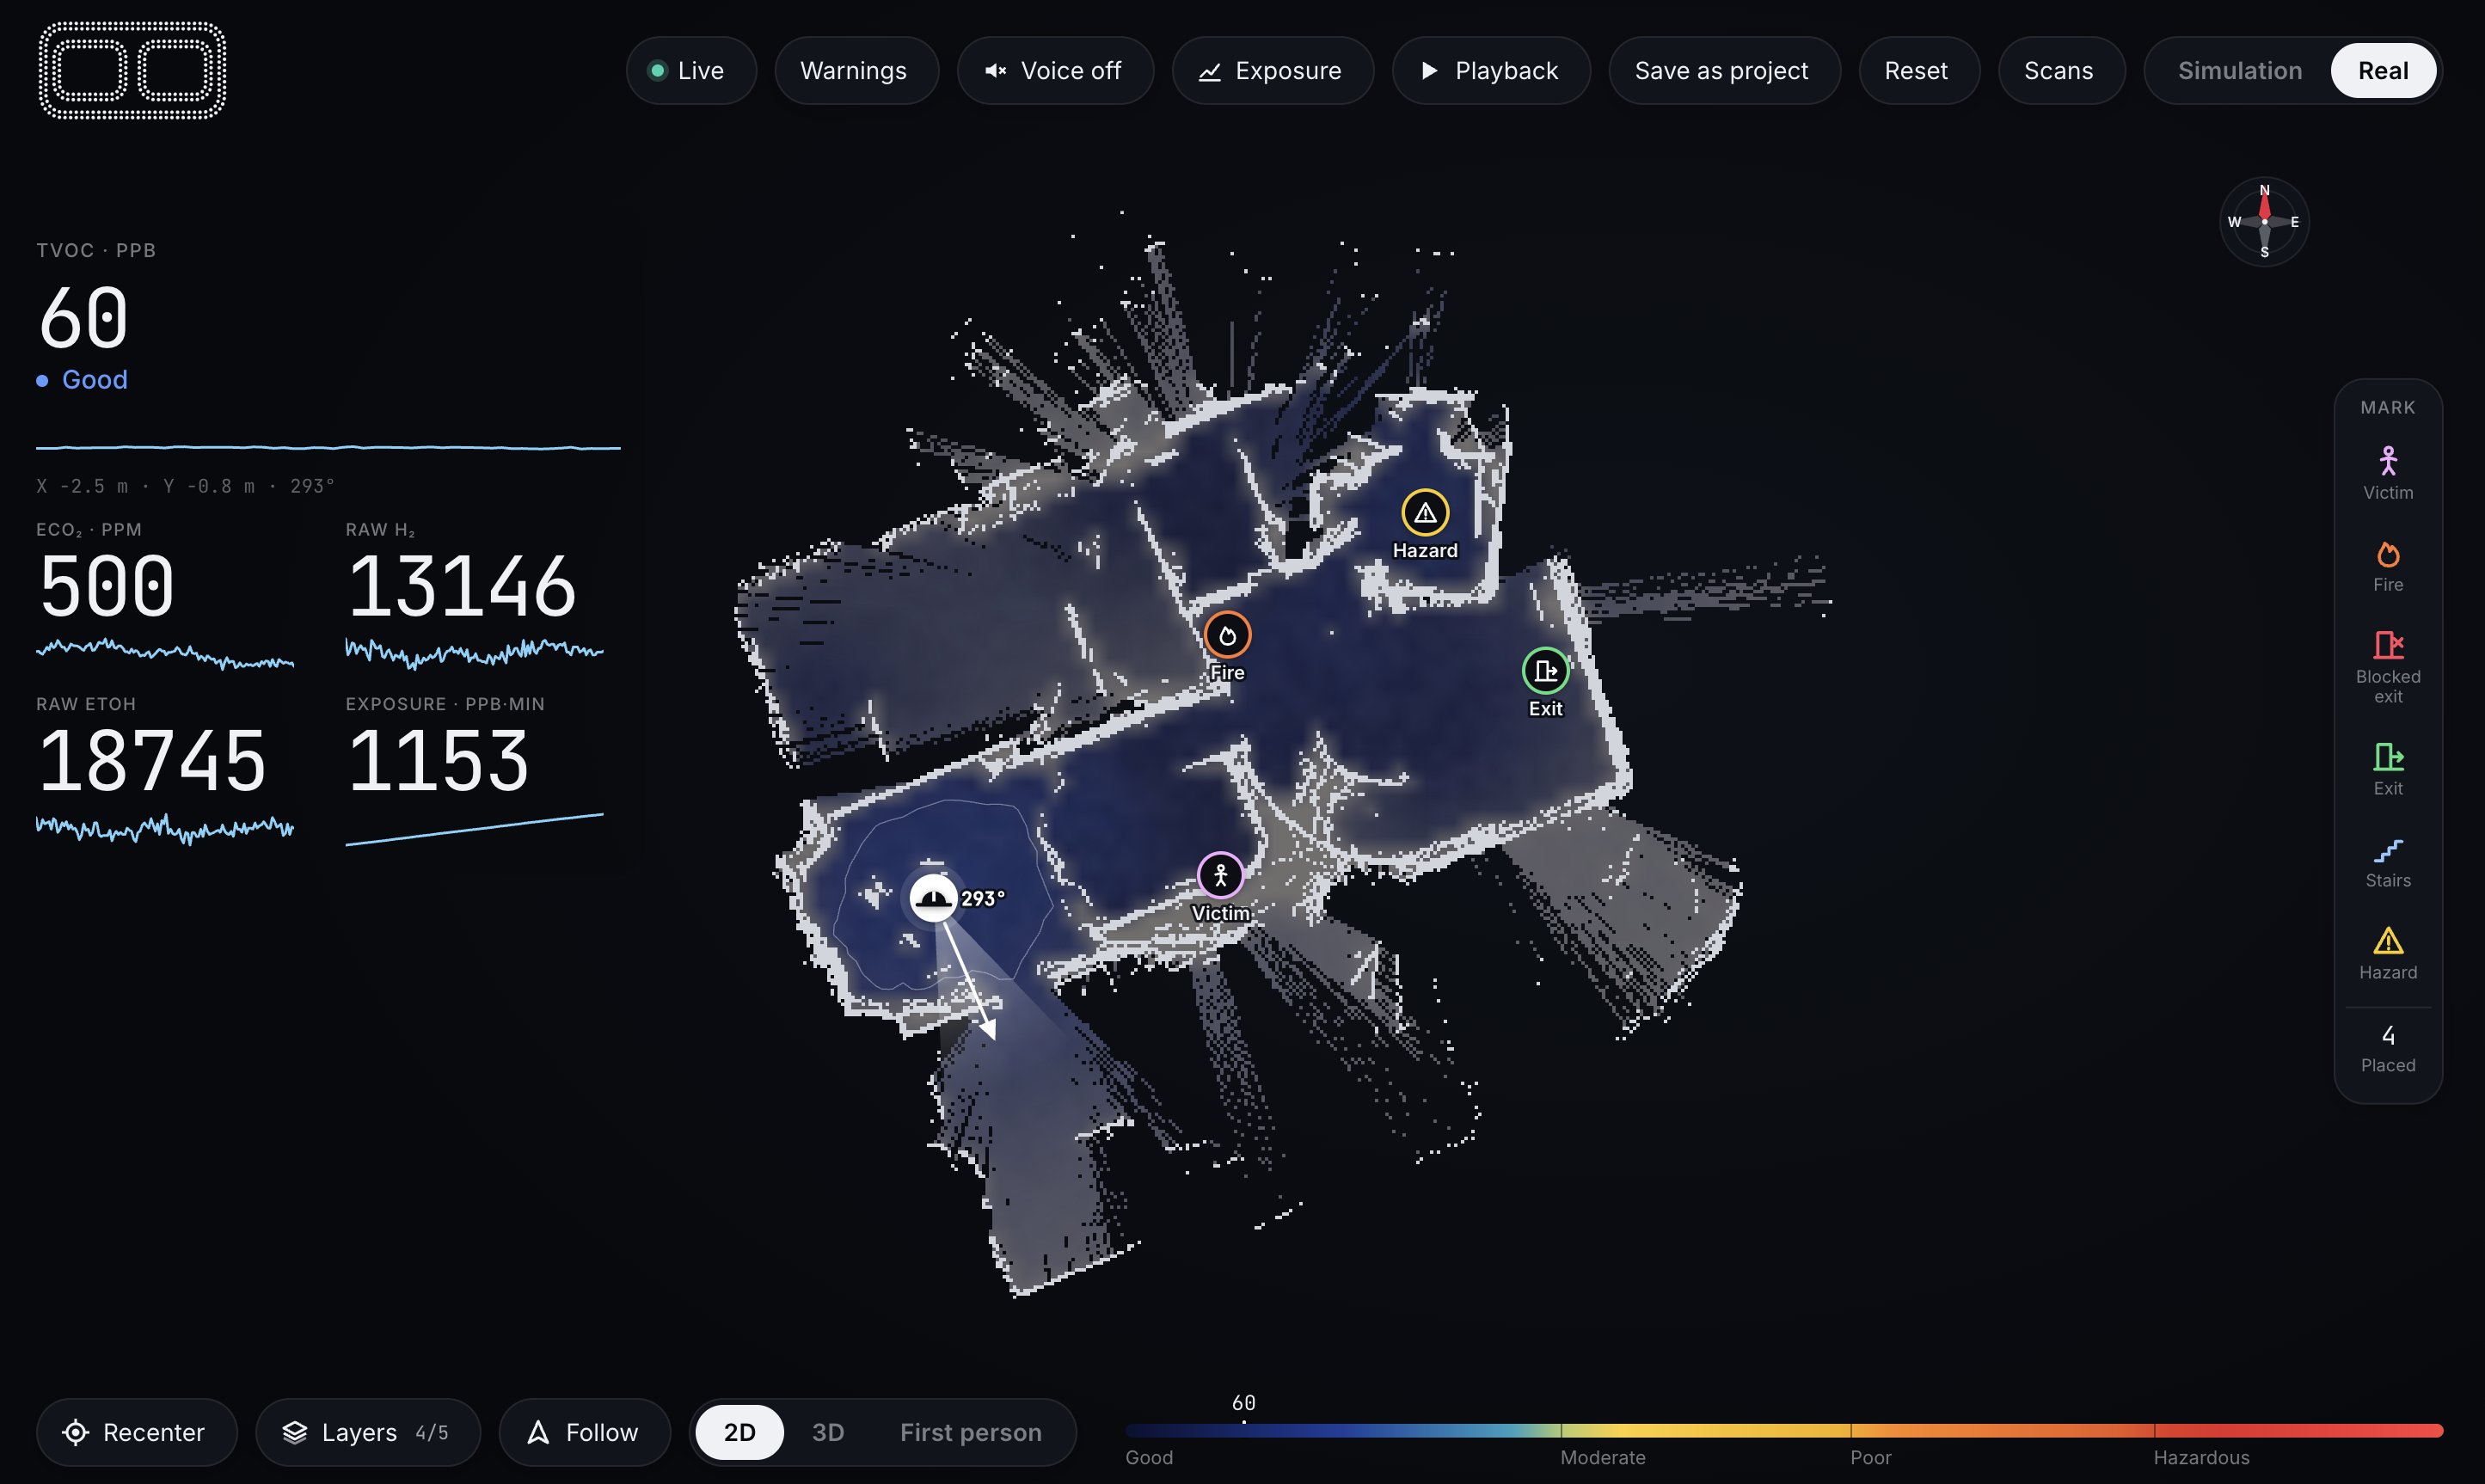
The incident commander, who coordinates crews and tactical decisions, can add reported information such as victims, blocked exits, entry points, and other hazards directly onto the map.
The system must fit into existing fireground workflows. Firefighting procedures with PyroSense keep radio communication and command procedures in place. PyroSense automatically adds mapping and environmental data to tablets or laptops already used for coordination by chiefs and incidence commanders.
Hardware design
The wearable prototype is built around a Raspberry Pi 5, which collects and synchronizes data from each sensor. A LiDAR sensor continuously scans the surroundings to generate the building layout and support indoor localization. An IMU measures motion and tilt to help track the orientation of the mapping system and reject unreliable LiDAR scans when the sensor is tilted too far. For environmental sensing, we use a volatile organic compounds (VOC) sensor to continuously measure relative VOC levels. The Raspberry Pi then streams the sensor data to a laptop, where the mapping, hazard visualization, and command interface are processed and displayed.
Software architecture
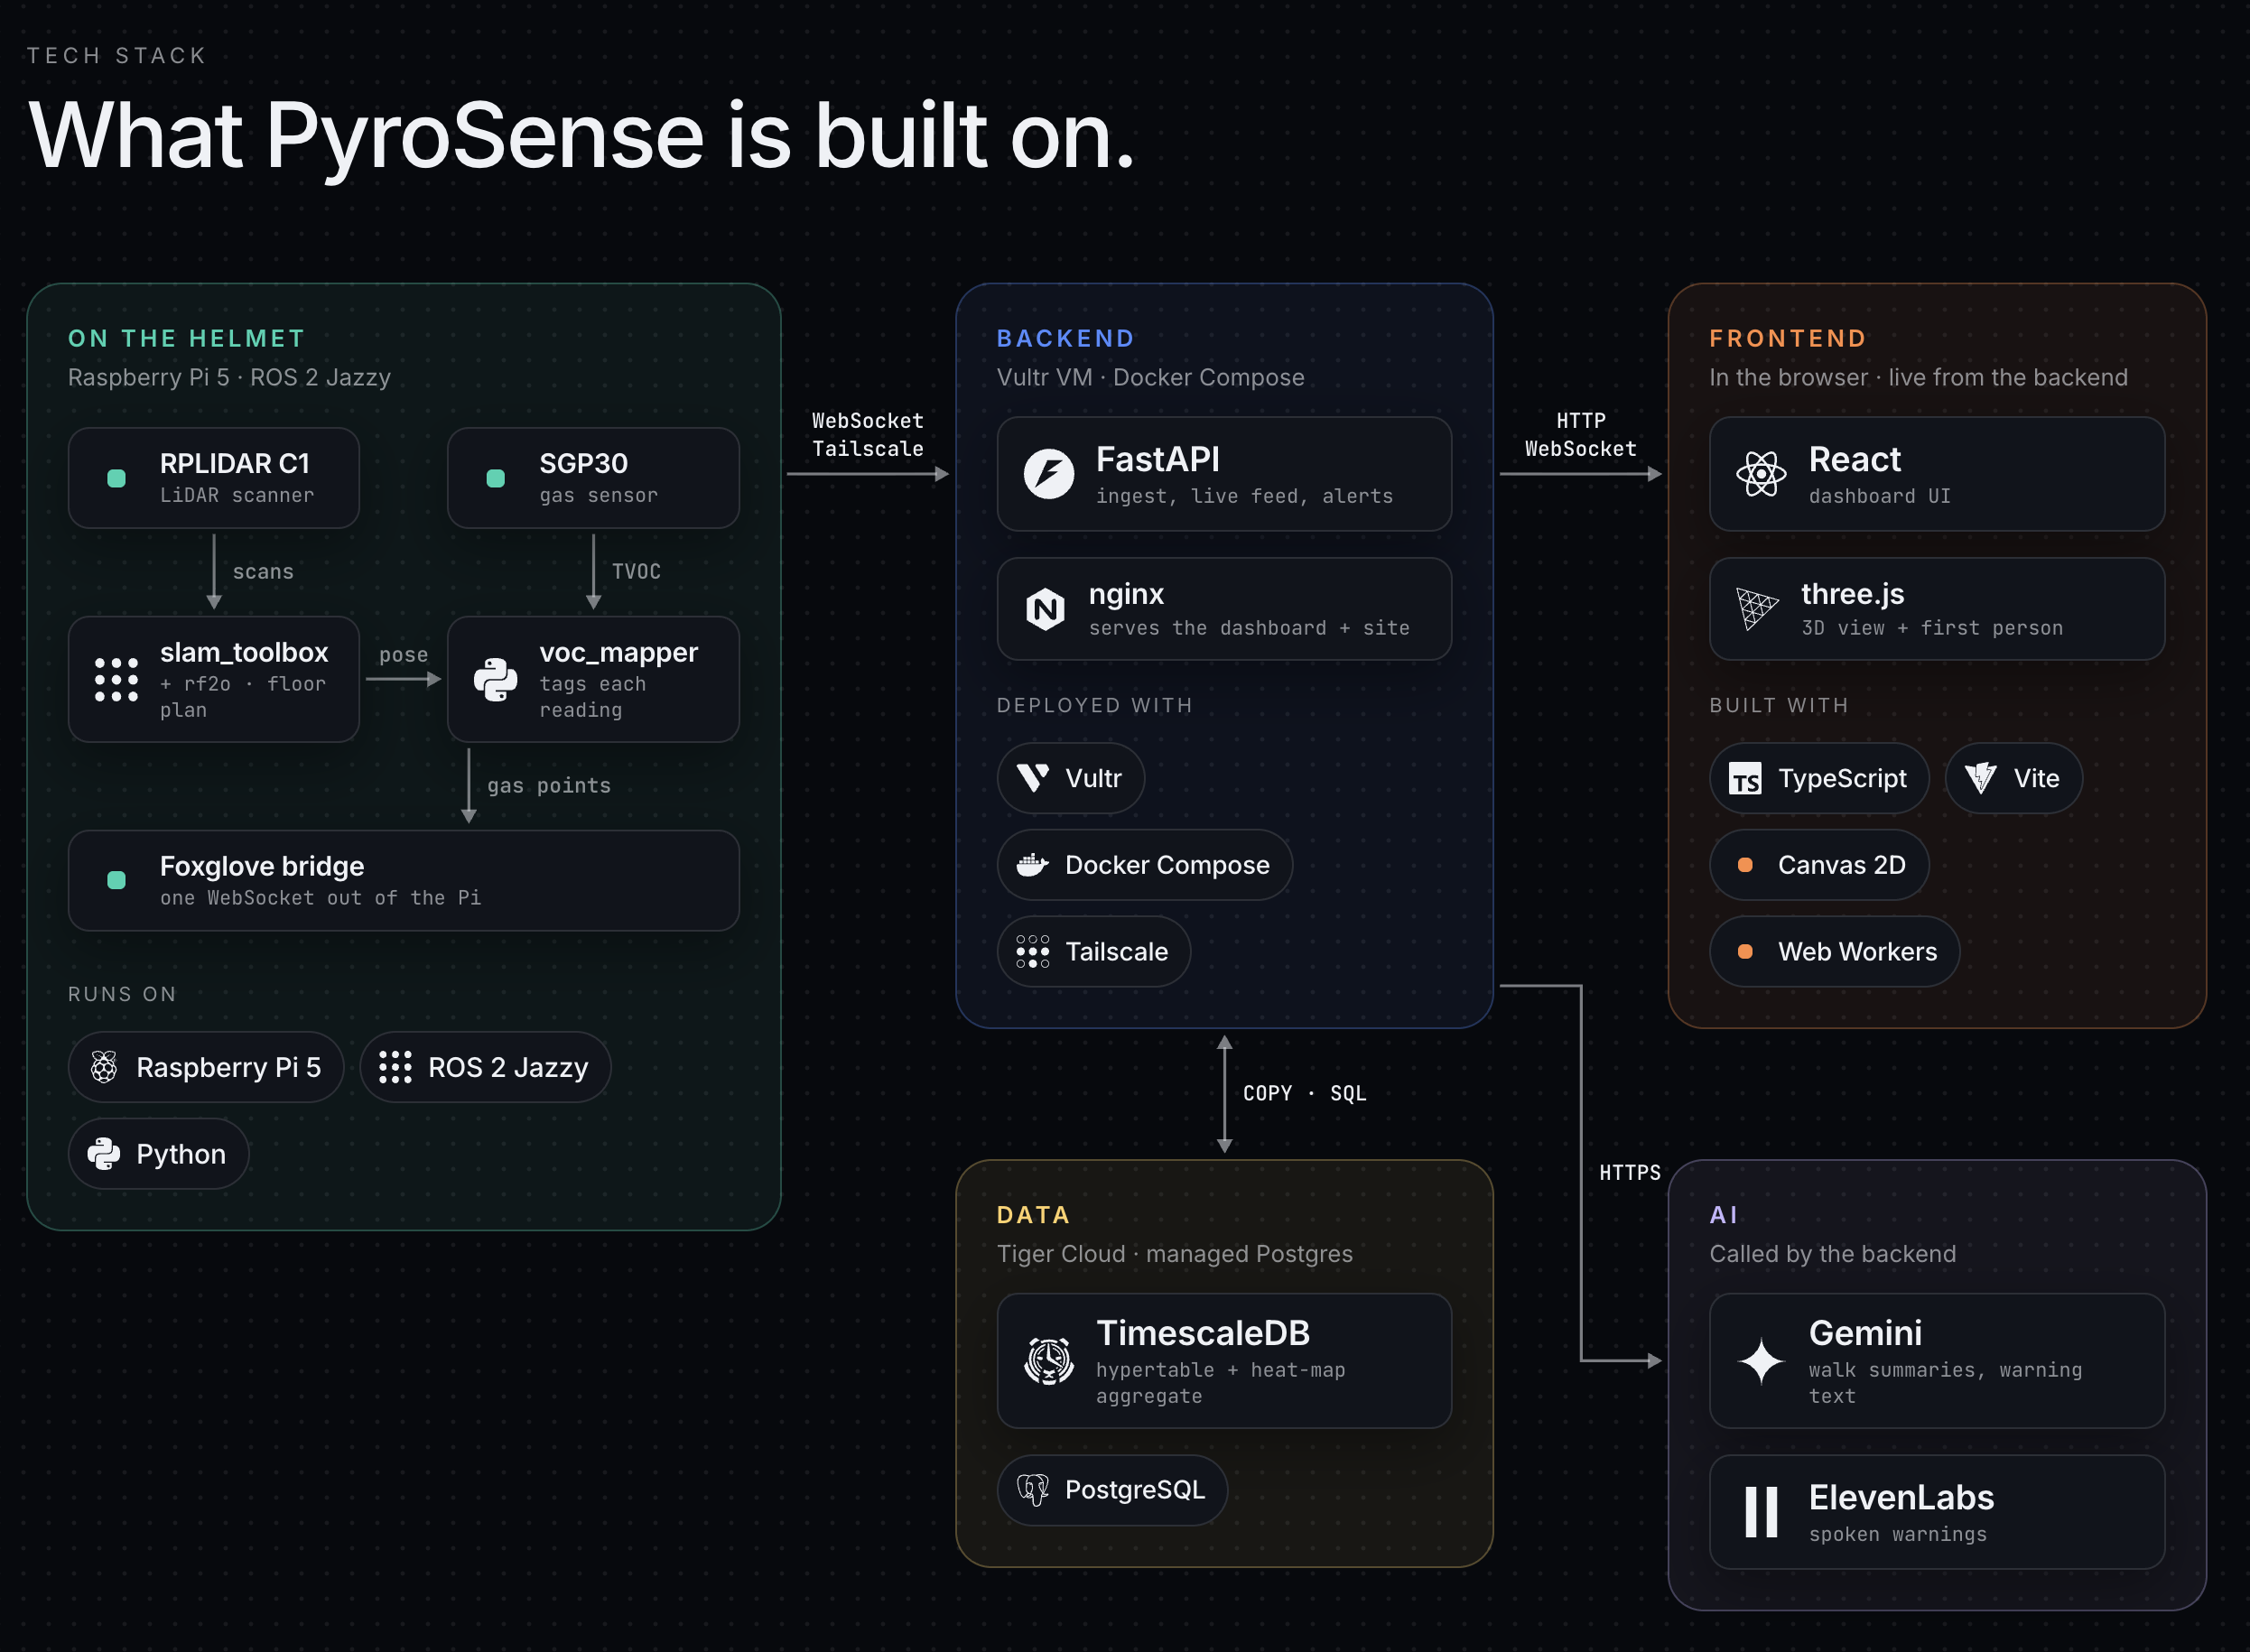
For deployment, we run backend and dashboard on a single Vultr VM with Docker Compose. FastAPI pulls the Pi's stream over Tailscale, and nginx serves the dashboard. Readings go to Tiger Cloud, which turns them into the heat map, so replaying a past walk is just a time-range query. One script deploys everything.
Dashboard was made possible with three.js. We render walls from the SLAM map as it fills in, paint the gas field on the floor, and draw the air above it as drifting particles.
You can watch from overhead or drop into first person at the firefighter's eye height, looking where they look as they move. Incident command gets layer toggles, follow mode, per-responder exposure history, and one-click marks for victims, fire and blocked exits.
Also made a really cool landing page!
Challenges we ran into
Hardware bring up: Debugging drivers, SSH, and hotspot issues to connect our Raspberry Pi to our laptop.
Data streaming latency: Reduced Pi to frontend latency by 50% by transmitting only new sensor readings, cutting traffic by about 10×, lowering SLAM map update frequency, serving live data from memory, and sending map images only when they changed.
Data visualization: Designing an intuitive way to display the building map, gas heat map, changing conditions, and unsampled areas.
Accomplishments that we're proud of
Full complete prototype: We successfully integrated mapping, localization, and gas sensing into a wearable solution that works in real-time.
Hazard mapping and prediction: Used Gaussian Processing to produce accurate gas maps with
Good workflow integration: We made sure that our solution integrates seamlessly into existing workflows so that firefighters can adopt it easily!
What we learned
When doing Raspberry Pi setup without a monitor, make sure to install Ubuntu server and not desktop!
What's next for Pyrosense
Next, we want to adapt the prototype for real fireground conditions. A key next step is replacing optical LiDAR with mmWave radar, which can continue mapping through dense smoke, darkness, and dust where cameras and optical LiDAR struggle. Thermal imaging could also be fused with radar to improve visibility and detect heat sources.
We also plan to integrate certified gas sensors, SCBA air and emergency status, and further tune gas source estimation and short term hazard prediction using real-world data. The next major step would be testing the system with firefighters and fire departments to gather feedback, validate its usefulness in real scenarios, and eventually bring it to market.
Built With
- fastapi
- foxbridge
- lidar
- python
- raspberry-pi
- ros2
- slam
- tailscale
- tiger-data
- timescaledb
- vultr


Log in or sign up for Devpost to join the conversation.